Join our fan page

Volume Rate of Change - indicator for MetaTrader 5

- Views:
- 13801
- Rating:
- Published:
-
 You are missing trading opportunities:
- Free trading apps
- Over 8,000 signals for copying
- Economic news for exploring financial markets
Registration Log inYou agree to website policy and terms of use
If you do not have an account, please register -
 Need a robot or indicator based on this code? Order it on Freelance
Go to Freelance
Need a robot or indicator based on this code? Order it on Freelance
Go to Freelance
Since now we have a possibility of using real volumes too (where it is provided by the broker), seems that the Volume Rate of Change indicator becomes interesting to be used.
The Volume Rate of Change indicator (VROC) measures the rate of change in volume over the past "n" sessions. In other words, the VROC measures the current volume by comparing it to the volume "n" periods or sessions ago.
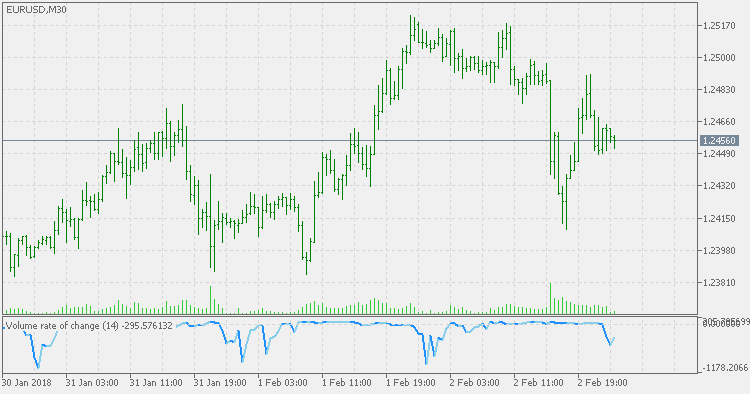
VROC can be a powerful technical indicator. When the rate of change is high, you can then compare price to any technical support or resistance levels or use any other price based technical indicators as well.
In such circumstances, the Volume Rate of Change indicator can tell you ahead of time whether the support or resistance levels can be breached and can confirm trends as well.
The Volume Rate of Change indicator can be used in a number of ways. There are quite a few trading strategies that also employ the information from the VROC indicator.
Using the Volume Rate of Change to spot fake market moves
Most commonly, the Volume Rate of Change indicator can be used to determine fake breakouts in the market. When markets are trading at a new high, volume is typically stronger. This validates the high and new interest in the security pours in pushing volume higher.
However, when volume fails to validate a new high, you can expect to see a correction in the price.
DevStops
A variation of Deviation Stops (DevStops) indicator. Some are wrongly calling this version a Kase DevStops (which it is not - Kase DevStops indicator is calculated in a quite different way), but this version has its good points too and can be used in regular support/resistance mode. Additionally each DevStop value is colored according to the slope (trend) of the line - when all are aligned in the same direction, it can be treated as a confirmed trend change.
Kase DevStops
Kase DevStops. What all of this boils down to is that we need to take variance and skew into consideration when we are establishing a system for setting stops. Three steps that we can take in order to both better define and to minimize the threshold of uncertainty in setting stops are: 1. Consideration of the variance or the standard deviation of range. 2. Consideration of the skew, or more simply, the amount at which range can spike in the opposite direction of the trend. 3. Reformation of our data to be more consistent (this step is examined in detail in Chapter 81, while minimizing the degree of uncertainty as much as possible).
CCI alternative
Commodity Channel Index (CCI) is a versatile indicator that can be used to identify a new trend or warn of extreme conditions. Donald Lambert originally developed CCI to identify cyclical turns in commodities, but the indicator can be successfully applied to indices, ETFs, stocks, and other securities.
Smoothed Kijun-Sen
The Kijun-Sen is a major indicator line and component of the Ichimoku Kinko Hyo indicator, also known as the Ichimoku cloud. It is generally used as a metric for medium-term momentum.