Join our fan page

RAVI iFish - indicator for MetaTrader 5

- Views:
- 7661
- Rating:
- Published:
-
 You are missing trading opportunities:
- Free trading apps
- Over 8,000 signals for copying
- Economic news for exploring financial markets
Registration Log inYou agree to website policy and terms of use
If you do not have an account, please register -
 Need a robot or indicator based on this code? Order it on Freelance
Go to Freelance
Need a robot or indicator based on this code? Order it on Freelance
Go to Freelance
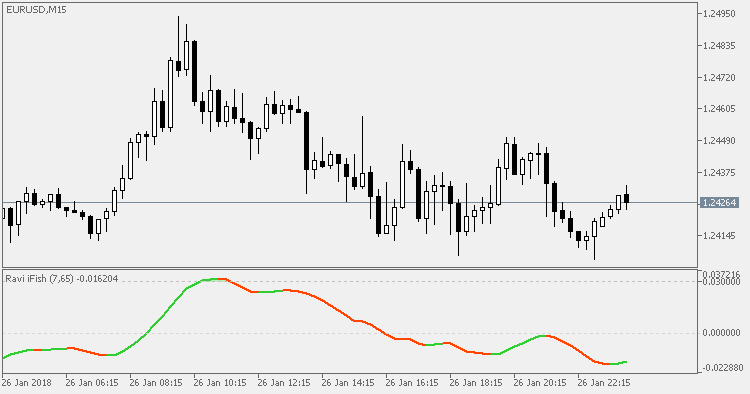
Developed by Tushar Chande, the Range Action Verification Index (RAVI) is used in order to help identify if the market is in a trend. The indicator shows the difference (in percentage) between the current prices and the past prices. Two key lines are recommended by Chande for the RAVI – 3% or 1% in dependence on the market.
- A bull trend begins, when the RAVI crosses the 3% key line from bottom-up. The bull trend is considered as active as long as the indicator line moves up.
- A bear trend begins, when the RAVI crosses the 1% key line from top to the downside. The bear trend is considered as active as long as the indicator line moves down.
This version has an additional inverse Fisher transform applied to the RAVI in order to emphasize the RAVI values and to make the detection of trend change and exhaustion easier.
Recommendations
- Can be used in both trending mode and counter trending mode.
- Adjust trigger levels for trending mode (set the trigger levels to lesser values).
Chandes Quick Stick (Qstick)
Chandes Quick Stick (Qstick)
Ulcer Index
This Ulcer Index indicator was derived from the stock risk indicator by Peter Martin in the 1987 book "The Investors Guide to Fidelity Funds".
Lot calculator - risk management tool
This tool allows you to calculate the correct lot size of the next trade by following some simple money management rules.
Chandelier exit
Chandelier exit indicator is designed to keep traders in a trend and prevent an early exit as long as the trend extends. Typically, the Chandelier Exit will be above prices during a downtrend and below prices during an uptrend.