Join our fan page
- Views:
- 6784
- Rating:
- Published:
- Updated:
-
Need a robot or indicator based on this code? Order it on Freelance Go to Freelance
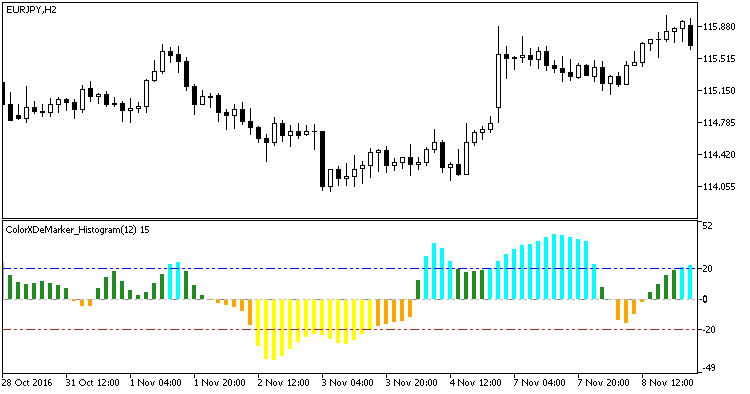
The smoothed DeMark oscillator with the color indication of overbought/oversold level breakouts and of the histogram direction. Depending on the value of the indicator's input parameter:
There are two variants of histogram coloring:
- Breakout of overbought/oversold levels;
- Change of direction.
For better histogram readability, the indicator is performed in zero relative symmetric form, and its values vary from -50 to +50.
The indicator uses SmoothAlgorithms.mqh library classes (copy it to <terminal_data_folder>\MQL5\Include). The use of the classes was described in detail in the article "Averaging Price Series for Intermediate Calculations Without Using Additional Buffers".

Fig1. Indicator ColorXDeMarker_Histogram
Translated from Russian by MetaQuotes Ltd.
Original code: https://www.mql5.com/ru/code/17653
 TTM-Trend_HTF
The TTM-Trend indicator with the timeframe selection option available in the input parameters.
 ColorXMACD_Digit
A rounded MACD histogram presented in the price chart points.
 Exp_ttm-trend_ReOpen
The Exp_ttm-trend_ReOpen trading system based on the signals of the ttm-trend indicator with trend following scaling.
 ColorSTD_Histogram
The smoothed Simple Trend Detector with the color indication of overbought/oversold level breakouts and of the histogram direction.