Join our fan page

Master Tools - indicator for MetaTrader 4

- Views:
- 69431
- Rating:
- Published:
- Updated:
-
 You are missing trading opportunities:
- Free trading apps
- Over 8,000 signals for copying
- Economic news for exploring financial markets
Registration Log inYou agree to website policy and terms of use
If you do not have an account, please register -
 Need a robot or indicator based on this code? Order it on Freelance
Go to Freelance
Need a robot or indicator based on this code? Order it on Freelance
Go to Freelance
Changelog:
v1.08: After a long time of absence :)
- Bug correction and compilation.
v1.07:
- Now SL / TP choose for each chart and not for all.
- For the grid, now you can choose a different grid gap for each chart.
- New option, have sound alert when the price is close to your TP or SL, you can choose the number of pips before ringing ** DON'T FORGET TO INPUT THE NEW SOUND FROM THE SOUNDS.ZIP ** its not activated by default.
- Add more information, in your Buy/Sell line and the TP and SL.
- And made some few correction.
- Trendline have now label information like the support and resistance line.
v1.06:
- Correction on master_info_ea.mq4 less bug, hopefully no more bugs :).
- master_info_ea.mq4 better information when the order is rejected by the broker.
- In the option panel you can choose between Classic Pivot Point or Fibonacci Pivot Point and now you can see the name of the Pivot line S1 S2...
- In the option panel you have a button to make a backup of your Resistance/Support line.
- In the option panel you can choose the default SL and TP.
- The Grid function, the line where the price is have a different color.
- Lot of correction of micro bugs.
- Correction on chart with only 1 or 0 digit.
v1.05:
- The Support and Resistance Lines are now automatically saved in a file ".../MQL4/files/supportresistance-EURUSD.csv". Each Symbol has its own file.
- If you open a new chart and open a Symbol, if a file exists, you will have the Support and Resistance Lines automatically, you can give your file to others if you want.
- A Backup Button is created for this line, it will create a file with the current date, so if you make a bad manipulation, you will not lose your precious lines!
- Correction of a minor bug.
v1.04:
- Added Label to SELL/BUY/TP/SL real order, if you have multiple orders on the same chart you will not move the wrong TP ou SL and you will see the TP value.
v1.03:
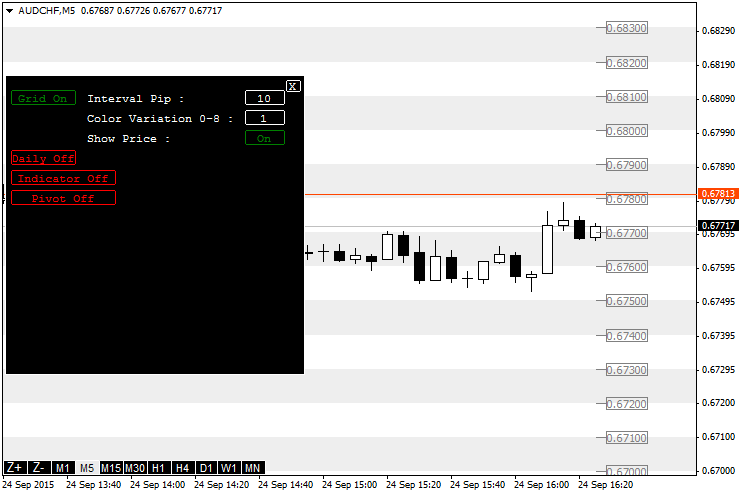
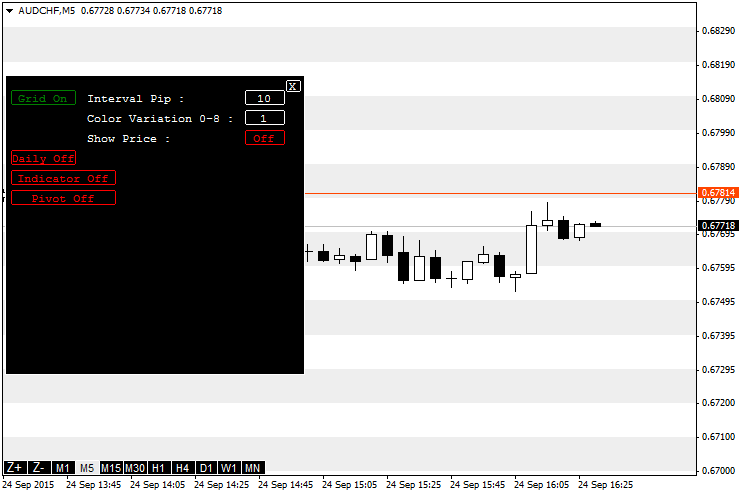
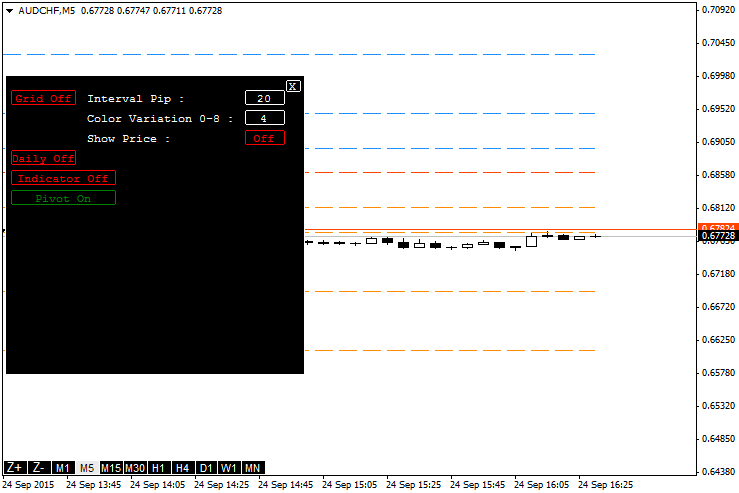
- Added a new window option, to easily change parameters, press "O" to open the options window.
- Show Grid by background color, you can choose the Pip, the variation of color, and see the price.
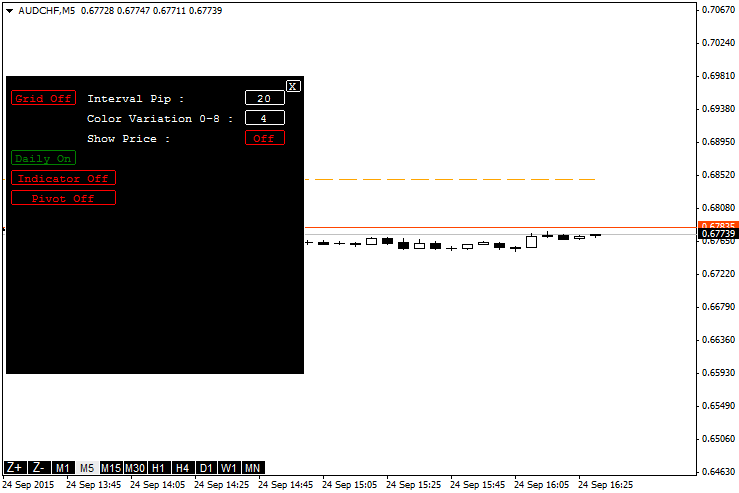
- Show Daily Open line.
- Show Pivot Point.
v1.02:
- added indicators summary (RSI/STOCHASTIC/CCI/MACD/MOMENTUM) and moving average summary simple/exponential at 5/10/20/50/100/200 period;
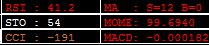
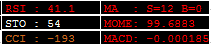
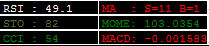
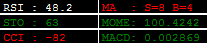
MA compute the Sell and Buy indication of the 12 MA, 6 moving average simple (5/10/20/50/100/200) period and the 6 moving average exponential.
This part is optional, use "Show indicator information" to show or hide. Red is sell, brown is oversell, white is neutral, green is buy, dark green is overbuy. - on mouse over the timeframe, you can see the indicators summary change to the timeframe chosen;
- added SL button on/off in Money Management Tool.
- correction on PipClick (int to double);
- correction on PipClick use ASK and BID correctly;
- on mouse over TimeFrame button show ATR/RSI/BULL/BEAR of the timeframe;
- correction on interface button status;
- correction on the indicator and the EA, pending order correction (don't forget to update the EA).
Until now I realized 5 indicators and I decided to bring 4 of them together in a single tool. The goal was to unify the interface for each tool because there was a floating window and use the Lot size for each.
- Money Manager Graphic Tool: Allows you to do a real money management work and open orders.
- ToolBox: Gives you a lot of information to help you decide what to do.
- Support Resistance - Tools: Helps you work with Support and Resistance levels.
- Change Timeframe...: Change timeframe easily.
The Master_Info_EA.mq4 is optional, but if you want to open orders in the Money Manager Graphic Tool, you need to download it.
The file sounds.zip is optional, it contains sounds for Support Resistance - Tools, if you want to use it, decompress in your MetaTrader 4 "Sounds" directory. If you create cool sounds, share them!
What we lose and what we gain over the original indicator:
- Money Manager Graphic Tool. We just lose the ratio button to move quickly the TP line at a fixed ratio. But the interface is now smaller.
- ToolBox. I deleted a lot of information, but I don't not use it anymore, I just kept the most useful. If you need some more, just tell me, I have some more room!
- Support Resistance - Tools. This one gained new option, the original indicator had no interface, so it's better.
- Change Timeframe.... No changes, and it is this indicator which inspired me to create Master Tools.
Explanation tool per tool:
Description: Provides information that helps you make a better decision.
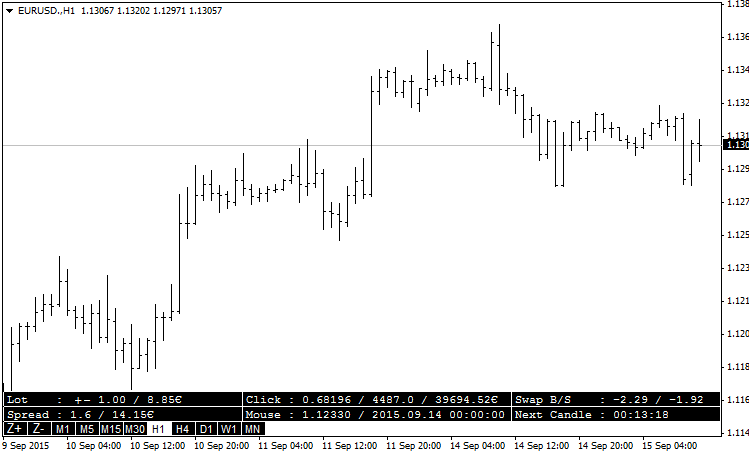
Basic interface: Always at the bottom and displays useful information.
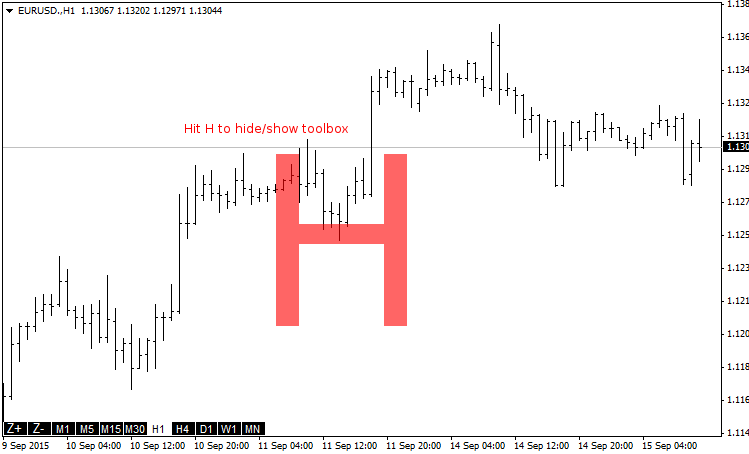
Hide/Show: The interface can be hidden, just hit "H".
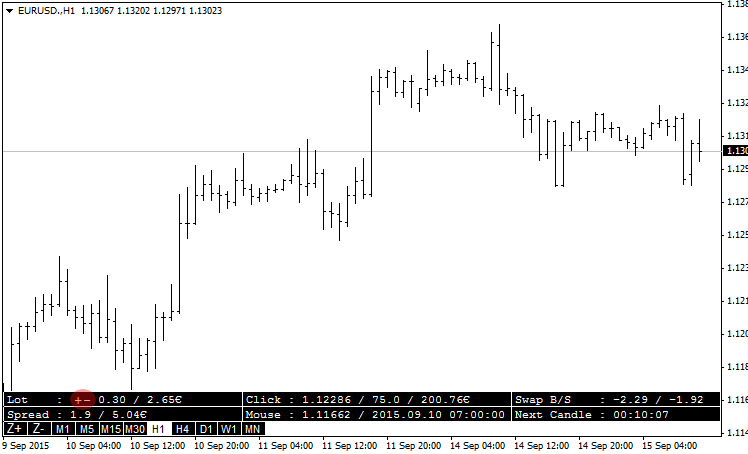
Lot Size: You can change the Lot size, for that use the + and - buttons, or use the shortcut "P" and "M". The Pip value will be recalculated. The Lot size will be used in all other functions of the other tool.
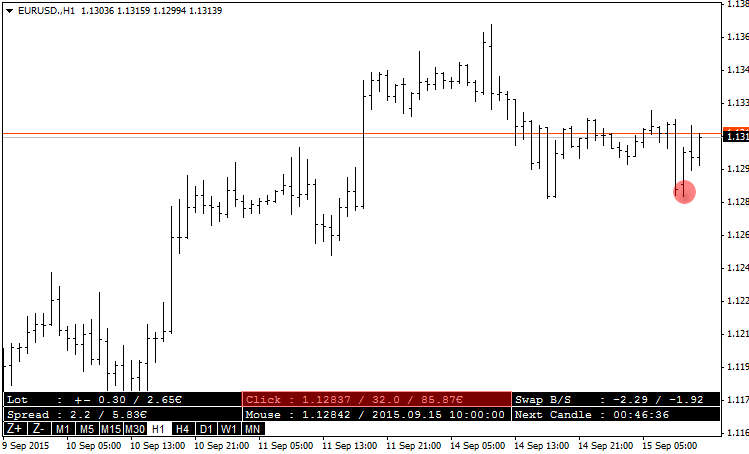
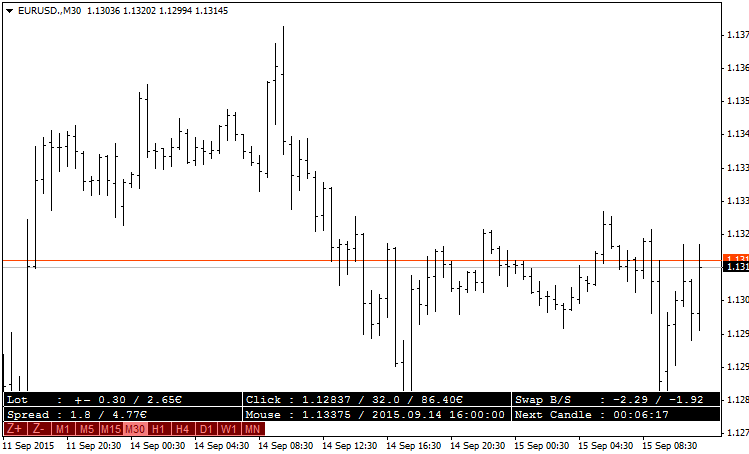
Click mouse on the chart: If you click on the chart, you can have information of the mouse position. The price you click, the Pip separating the actual price and the mouse position, the value in your currency. It is really useful to know before taking a trade the potential of it.
The Price & the date: By moving the mouse on the chart you can see the price and the date, the price information is useful for the other tool.
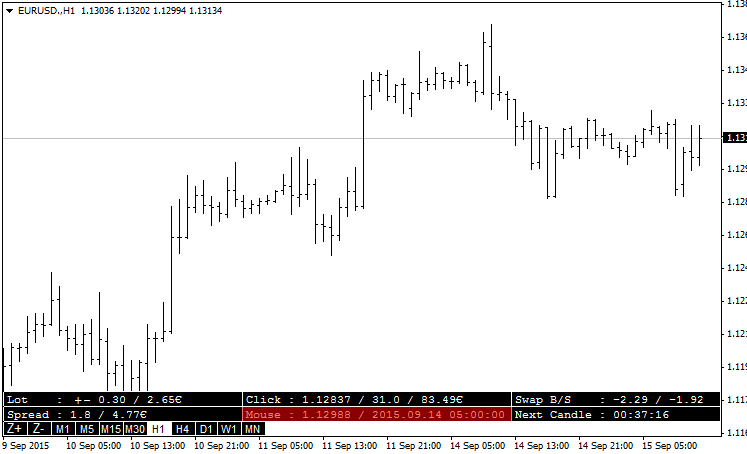
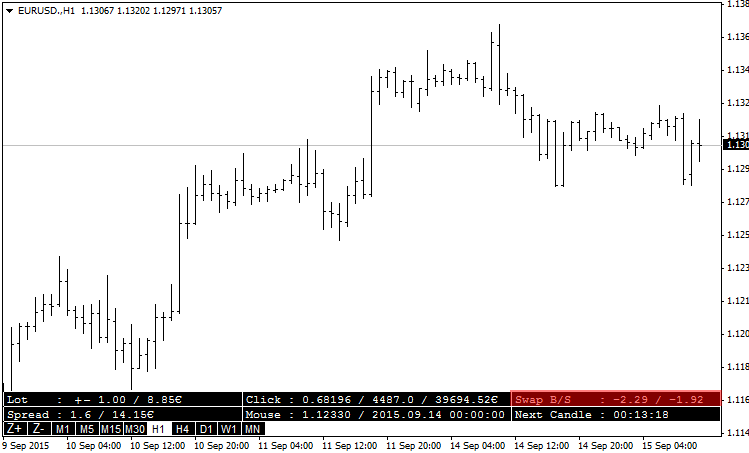
Swap Buy & Swap Sell: If you need to take a long position you can see the swap provided by your broker.
Countdown: The countdown to the next candle.

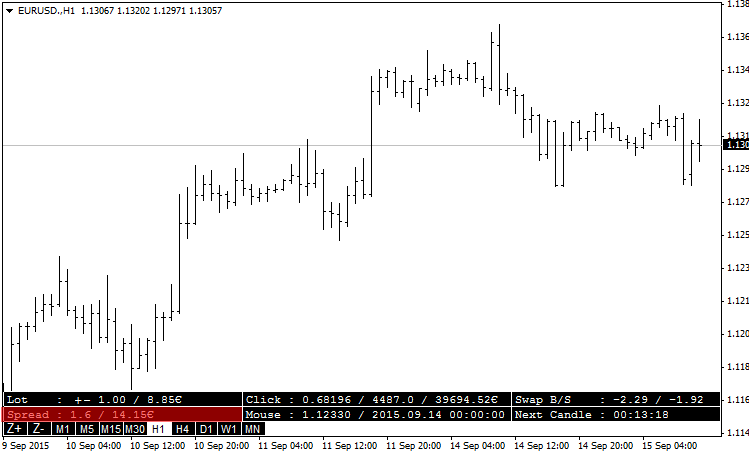
Spread: Information of the Spread in pip and in your currency.
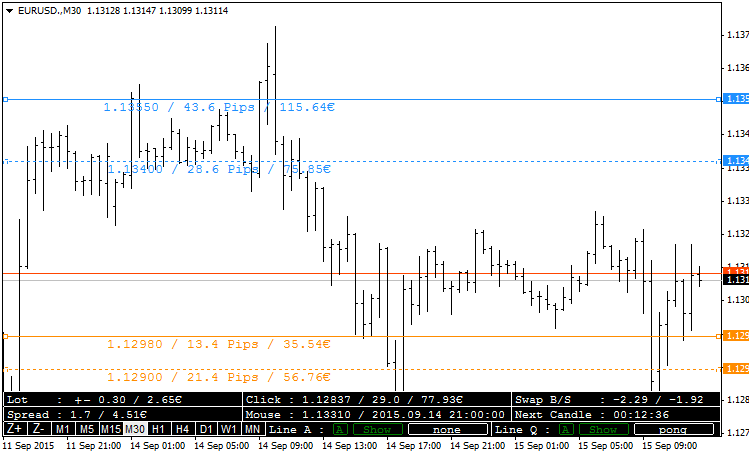
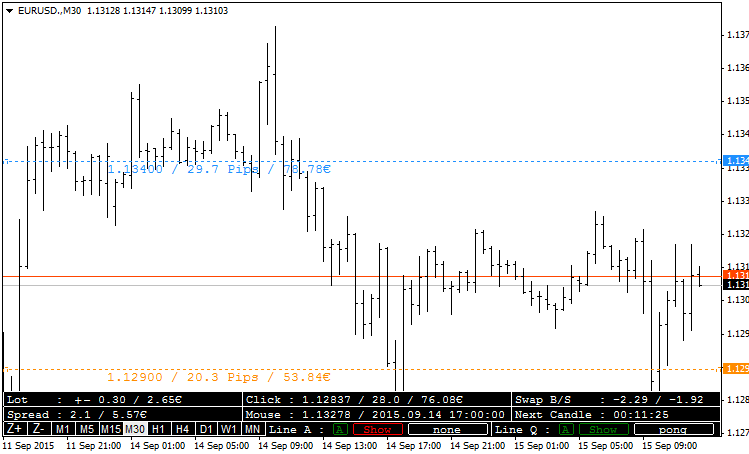
Description: This tool will help you create Support and Resistance lines — with one keystroke you can create the line with the color, shape and width you want. Each line provides information on the pip left from price, the same information in your currency. The tool changes the color of the line automatically, allowing to easily see what is going on.
You have at your disposal 2 kinds of line with 2 different shortcuts different, by default A and Q. You can choose all the line options for each.
The indicator will alert you when the price crosses the line. You can choose to activate smartphone notification when you are away. I had a new option to the original tool, you can choose the sound of the alert. You have 6 set of sounds, for each set there are 2 sounds — one for transforming a support into a resistance and the second for resistance to support, so you can take a coffee or read your news and you will not miss important information. (If you use sound, you should cut the default Alert sound of MetaTrader 4.)
Why two sorts of lines: I use the first line for resistance and support and use the second line like an alarm. Sometimes pending order can be tricky to put, so when the price reaches the second line, I can take a decision and not miss the window.
But you can use it differently: the first for big resistance and support and the second for small resistance and support.
The trend line can be handled by the script if you want (it's "yes" by default, don't be surprised).
Interface: When you create a line, a new option appears in the interface. For each line you can activate the Alarm "A" button, you can show/hide the line, and you can change the sound. Personally, I use three different currencies and therefore I set a different sound for each. So I know what is happening even if I do not look at the screen.
Hide/Show: Hiding just one kind of line.
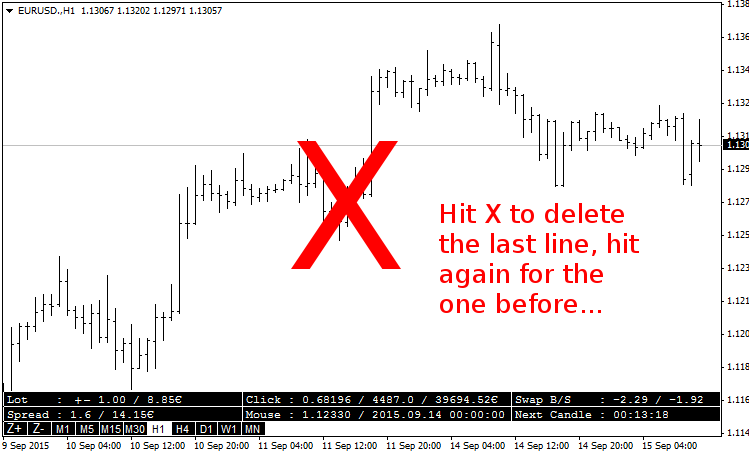
Deleting: You can delete lines just by typing X key on the keyboard. Each time you use X, you delete a new line.
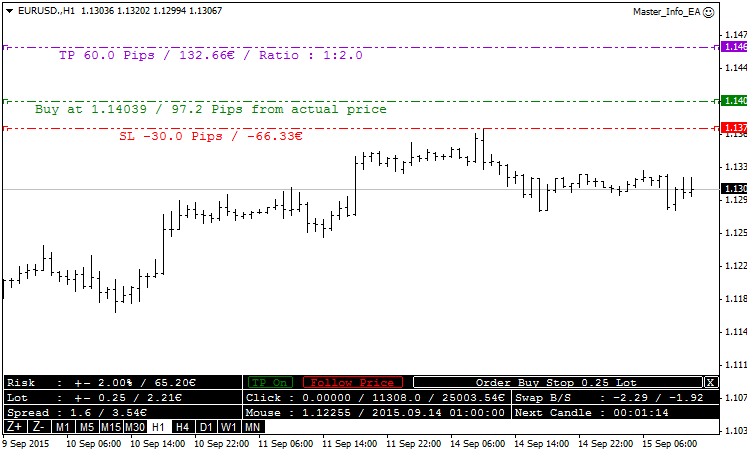
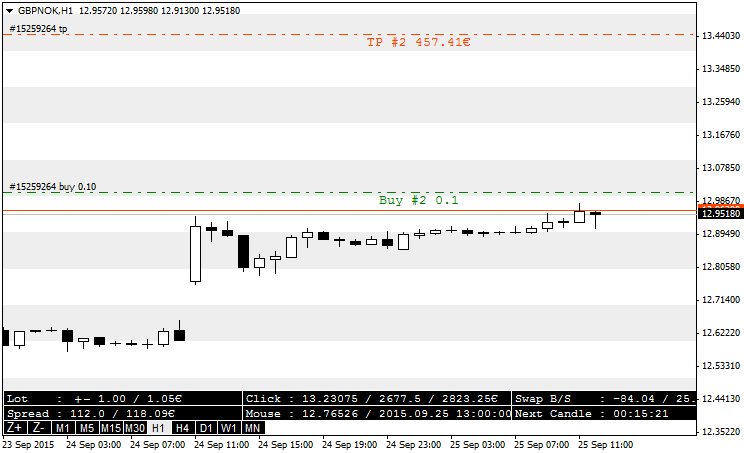
Description: By hitting "B" for Buy or "S" for Sell, you can see 3 lines: the Buy/Sell line (at the mouse position), the Take Profit line and the Stop Loss line. You can move them as you like and directly see the ratio, the SL value, the TP value, the risk. You can show/hide the TP, you can follow the price if you want to put a direct Buy/Sell, otherwise, you will place a pending order. You can change the risk and the Lot size to see what is going on. When you move line or Risk the lot size will change to the optimal size. If you activate the autotrade and put the Master_Tools_EA.mq4, then the button to order will appear.
Description: Simple buttons to change the timeframe directly on the chart. You can change the zoom too. Changing the timeframe of the wrong chart is now over!
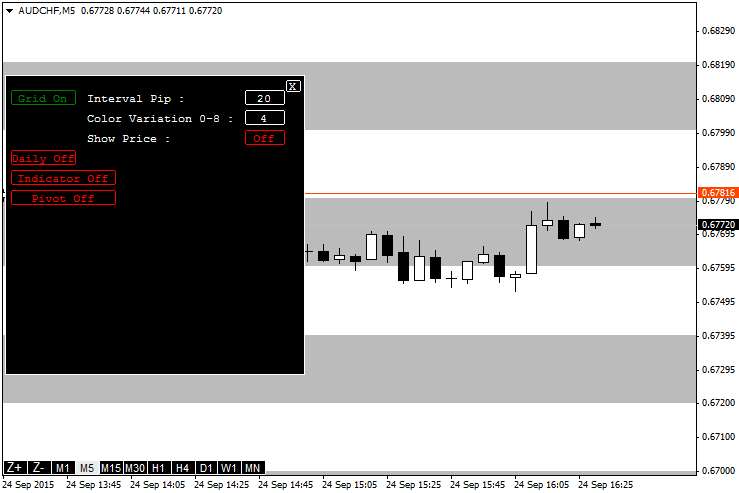
Grid
Description: you can see a grid in the background of the chart, you choose the pip height, you can choose the color intensity, and see the price or not.
DailyOpen
Description: Draw the line of the close price of the day before.
PivotPoint
Description: Draw the simple Pivot Point R4 to S4.
Sell/Buy/TP/SL Label
Description: Add information on the order line, no more mixed up by moving the wrong TP line.
Parameters:
extern string           text1="Global Information";            //Description
extern bool             CurrencySymbolRight=True;              //Is your currency symbol (€ $ £) at the Right?
extern double           LotSize=1;                             //Your default Lot Size
extern string           MasterHide="H";                        //Hide or show the tool
extern string           textc="";                              //====================================
extern string           text2="Support & Resistance Management Tool";  //Description
extern string           text3="==First Line";                  //Description
extern string           LineHorizontal="A";                    //Key to Create a SR Line (1)
extern color            LineResistcolor=clrDodgerBlue;         //Resistance Line Color (1)
extern color            LineSupportcolor=clrDarkOrange;        //Support Line Color (1)
extern ENUM_LINE_STYLE  LineStyle=STYLE_SOLID;                 //Style of SR Lines (1)
extern int              Linewidth=1;                           //Choose the width of the line (1)
extern bool             AlarmCrossWhithAlert=true;             //Send an Alert
extern bool             AlarmCrossWhithPushSmartphone=false;   //Send a Notification
extern filename         soundname=none;                        //Choose a pair of Sound (high/deep tone)
extern string           text4="==Second Line";                 //Description
extern string           LineHorizontalSecond="Q";              //Key to Create a SR Line (2)
extern color            LineResistcolorSecond=clrDodgerBlue;   //Resistance Line Color (2)
extern color            LineSupportcolorSecond=clrDarkOrange;  //Support Line Color (2)
extern ENUM_LINE_STYLE  LineStyleSecond=STYLE_DOT;             //Style of SR Lines (2)
extern int              LinewidthSecond=1;                     //Choose the width of the line (2)
extern bool             AlarmCrossWhithAlertSecond=true;             //Send an Alert
extern bool             AlarmCrossWhithPushSmartphoneSecond=false;   //Send a Notification
extern filename         soundnameSecond=none;                        //Choose a pair of Sound (high/deep tone)
extern string           text5="==TrendLine";                   //Description
extern bool             TakecareManualTrendline=true;          //Take care of your Trendline added manually
extern string           text6="==Other";                       //Description
extern string           DeleteLastLine="X";                    //Key to Delete Last Line
extern int              history=200;                           //Check on the last x candles
extern int              MaxDeviation=10;                       //Pips deviation for history
extern string           texta="";                              //====================================
extern string           text7="Money Management Tool";         //Description
extern string           BuyLine="B";                           //Key to Create a Buy Line
extern string           SellLine="S";                          //Key to Create a Sell Line
extern double           Risk=2;                                //Your Percentage Risk
extern double           DefaultSL=30;                          //Default SL in Pips
extern color            ColorBuySell=clrGreen;                 //Color of the Buy or Sell line
extern color            ColorSL=clrRed;                        //Color of the SL line
extern color            ColorTP=clrLawnGreen;                  //Color of the TP line
extern color            ColorTextBox=clrWhite;                 //Color of text in the toolbox
extern ENUM_LINE_STYLE  MMLineStyle=STYLE_DASHDOTDOT;          //Style of Lines
extern int              MMLinewidth=1;                         //Choose the width of the line
extern bool             Account=true;                          //Choose Balance [true] or Equity [false]
extern bool             CreateTP=true;                         //Create a Take Profit line
extern int              MagicNumber=159357;                    //Magic Number
 Daily Break Point
This an H1 strategy. This EA will execute at the new bar if the last bar has broken through the point that we set.
Volatility Step Channel
This indicator shows Step Channel based on volatility.
CCI on Step Channel
This version of CCI indicator uses median line of the Step Channel indicator.
 History Dump CSV with heat map for Excel analysis
This script creates a .CSV file of your order history so you can import it into Excel and analyse it using the calculated heat map slots and other calculated values. All trading attributes are extracted from the history and output to the .CSV file. Updated version 1.03 (about 27KB) has NetProfit, OpenDay, OpenHour, OpenSlot, CloseDay, CloseHour, CloseSlot, DurationMinutes, PotentialWinPips, PotentialLossPips and others. The file is tab delimited for easier conversion from text to columns in Excel. Times are server time. Handles 4 and 5 digit brokers and 2/3 and 4/5 point value pairs, e.g. JPY correctly.