Join our fan page
- Views:
- 14118
- Rating:
- Published:
-
Need a robot or indicator based on this code? Order it on Freelance Go to Freelance
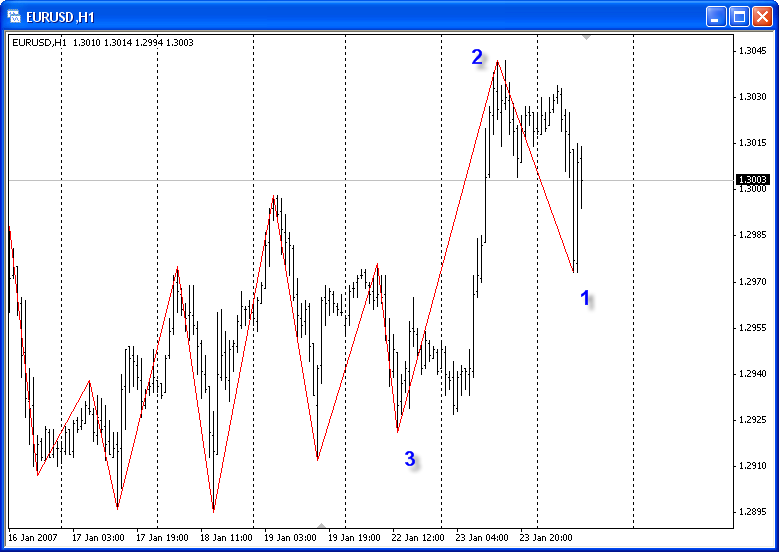
This version of Zigzag is a simple optimization of the old version of Zigzag.mq4 , which hundreds of thousands of MetaTrader users have become accustomed to since the MT3 version (MQL2 language).
Using the indicator without optimization made it difficult and time-consuming to test EAs using the values of the custom indicator Zigzag. The optimized version solves this problem.
The first time, at the first launch, the indicator calculates the entire history. On subsequent calls, when new ticks arrive in real time or when used in the tester, the third extremum from the current time is located deep into the history and recalculation starts from it. If you want to start recalculation from the second extremum, change the value of the level variable, which determines the depth of recalculation:
int level = 3 ; // recounting's depth

Zigzag R
All external variable names have been retained for consistency reasons. In addition, the extremums hanging in the air, which were formed on minute time frames, have been removed.
Translated from Russian by MetaQuotes Ltd.
Original code: https://www.mql5.com/ru/code/11206
 Read news from forex factory website by web request
Read news from forex factory website by web request
 G channel
G channel is a channel indicator with 3 lines- a middle line representing a central tendency and 2 Upper and Lower boundaries calculated based on the past values of same indicator. Its based on the paper "Recursive Bands - A New Indicator For Technical Analysis" by Alex Grover and is a code conversion from TradingView. The channel breakout of Upper or Lower boundaries represent a new trend or trend continuation while narrowing of bands represents ranging or low volatility conditions. The channel can prove to be a good indicator of a trend direction and also a guide for trailing of stop loss. It has only 2 variables. Channel period - default set to 100. Price type.
 Nadaraya-Watson estimator
Nadaraya-Watson estimator - metatrader 4 version
 RSI histogram bars
Two RSI indicator periods smoothed and displayed as histogram.