

The entry level has been identified, but how was it determined? Let’s break down one gold short and see how classic tools come together to form a complete plan.
Start by identifying the price structure
On Monday, August 3, 2026, a short setup appeared on the XAUUSD chart. The signal formed on M15 at 10:45 UTC. This is one specific example, not a typical outcome or statistical evidence.
Let’s start with fractals: they mark reversals, which ZigZag then connects into legs. By default, the indicator identifies a reversal using five candles to the left and four to the right. A fractal is considered confirmed once the candles to its right have closed.
ZigZag changes direction when a candle closes beyond the latest opposing fractal. While the current leg is developing, its endpoint moves to each new extreme.
For a short, level 0 is at the top of the retracement, while level 100 is at the low of the leg. The Fibonacci levels for the entry and target are calculated from the latest leg. The chart displays labels for the entry, stop loss and target, without showing separate Fibonacci lines.
Check the plan before placing the order
By default, the entry is at level 38.2. In this trade, Owl Smart Levels marked the entry at 4062.30, the stop loss at 4071.97 and the target at 4031.00.
The stop loss matched level 0, which was the top of the retracement. The target was at level 161.8, measured from level 0. The distance from the entry to the target was approximately 3.2 times the distance from the entry to the stop loss.
In this example, the trend was down on M15, H1 and H4. The trend directions must match across the Main, Older and Oldest timeframes. By default, these are M15, H1 and H4. If the directions on H1 and H4 had not matched, the indicator would have drawn a shaded red zone and there would have been no valid signal.
Figure 1 shows the white ZigZag line. The info bar at the top contains three downtrend icons, for M15, H1 and H4. The entry at 4062.30, stop loss at 4071.97 and target at 4031.00 are marked next to them.
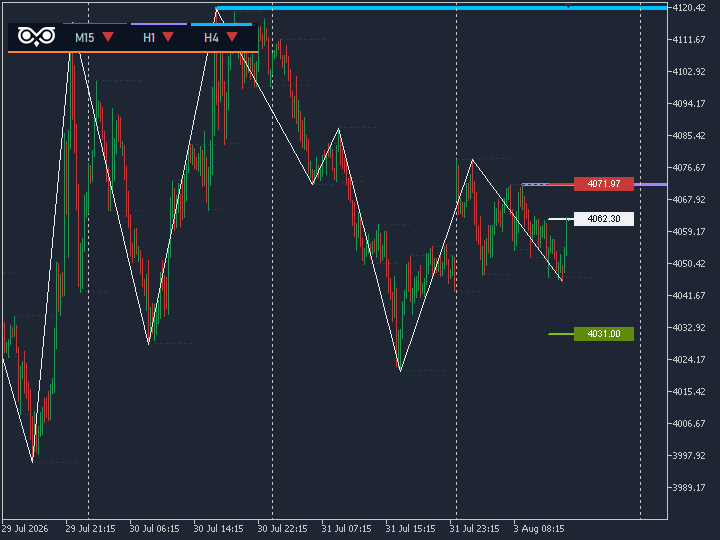
Figure 1. XAUUSD, M15: ZigZag lines, three downtrend icons and labels for the entry at 4062.30, stop loss at 4071.97 and target at 4031.00.
The plan appeared on the chart at 10:45 UTC, before price reached the entry. The indicator only plots the levels. You place the limit order yourself or wait for a price reaction.
Follow the price action
Price reached the entry at 11:51 UTC. After the entry, the maximum move against the trade was 2.32 in price terms, or 232 points. That is about a quarter of the distance to the stop loss.
The signal levels did not change during the trade, and the signal itself remained valid. At 13:31 UTC, price reached the target. This happened seven M15 candles after the entry.
In Figure 2, price is already below 4031.00. This is how this particular example played out: the fractals marked the reversals, ZigZag connected them into a leg, and the levels from that leg defined the entire plan.
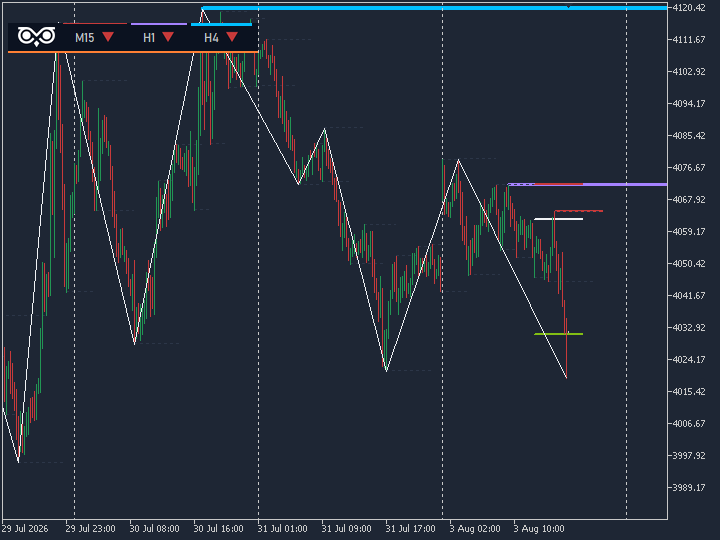
Figure 2. The same chart after the target was reached: price is below 4031.00.
The outcome became known only after price moved, but the entry, stop loss and target had been plotted in advance.
Before your next trade, look at the chart. Check where the stop loss and target are, then compare the trend directions on M15, H1 and H4. Fractals, ZigZag, Fibonacci levels and matching directions across the three timeframes combine into a single plan. You can see the entry, stop loss and target in advance.
A trade based on this type of plan can hit the stop loss.
Owl Smart Levels




