Volume Absorption for MT4 and MT5: How to Read the Signals, Zones and Sweeps of Smart Absorption Radar

1. Introduction
A bar with heavy volume tells you that a lot changed hands. It does not tell you which side got its way. Smart Absorption Radar answers that by fixed rules: when a high-volume bar leaves a long wick and closes away from it, the push toward the wick was met and turned back on that bar. The indicator marks such a bar BUY or SELL, draws the zone it left behind, marks sweeps of the recent low and high, and lays out an entry, a stop and three targets for the newest signal.
This guide explains the rule behind every mark on the chart, shows how to read a BUY, a SELL, a zone, a sweep and the dashboard, and ends with a step-by-step way to use it and the misreadings to avoid. Figures 1 to 5 are MetaTrader charts.
One rule about time runs through the whole guide. Signals are decided on the closed bar and do not change after it. On the forming bar the dashboard moves with every tick, so its rows can change until the bar closes.
2. What It Looks For: Heavy Volume That Was Turned Back
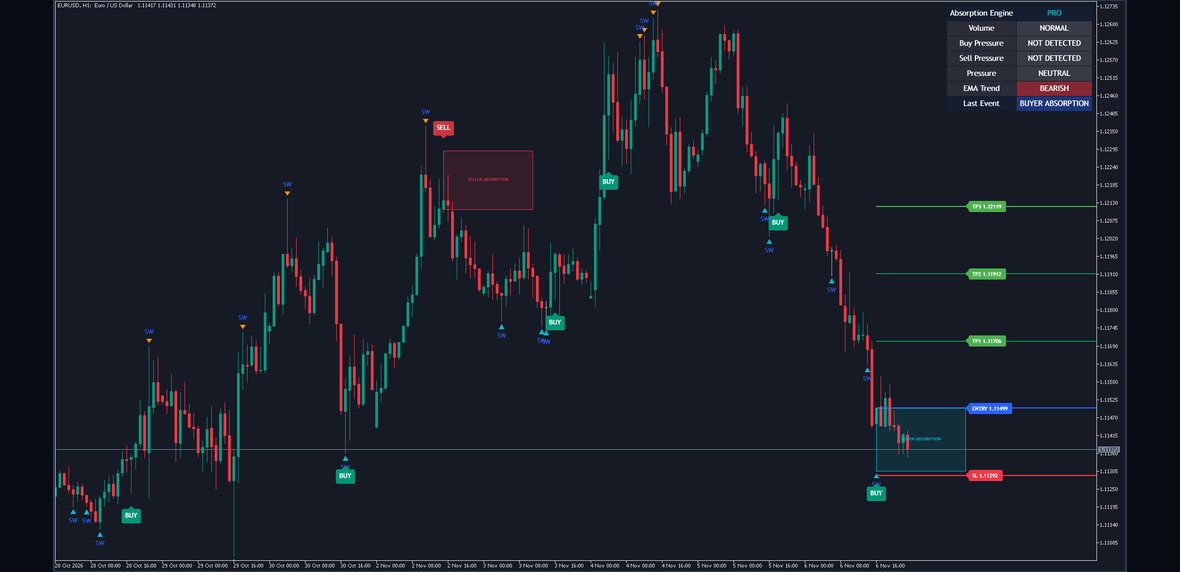
Figure 1. The indicator on a MetaTrader chart: BUY and SELL plates, an absorption zone, SW marks, the levels of the newest signal and the radar dashboard.
Absorption is a simple picture. Sellers push price down through a bar, the volume swells, and yet the bar closes near its high: the selling was absorbed by buying. Or buyers push it up, the volume swells, and the bar closes near its low: the buying was absorbed by selling. The long wick is the part of the bar where the push went and did not stay.
Absorption here is estimated from candles and tick volume. The indicator does not see order flow, bids or asks, and it cannot tell who traded. The name describes the idea behind the rule; the rule itself reads the shape of each bar and the size of its tick volume, and nothing else.
Everything is drawn on the main price chart:
- BUY plates (green) under bars where buying absorbed the selling, and SELL plates (red) over bars where selling absorbed the buying.
- Absorption zones: a BUYER ABSORPTION (aqua) zone from the newest BUY bar and a SELLER ABSORPTION (red) zone from the newest SELL bar, each reaching to the right by Zone Extension Bars (20).
- SW marks: a small aqua triangle under a bar that swept the recent low and closed back above it, and an orange one over a bar that swept the recent high and closed back below it.
- The levels of the newest signal: ENTRY, SL, TP1, TP2 and TP3 lines with priced labels.
- The radar dashboard in the top right corner, which says what the newest bar is doing.
- An optional Trend EMA, an orange line (Show EMA, off).
3. The Two Ingredients: a Volume Surge and a Rejection Wick
A signal needs both ingredients on the same closed bar. Neither is enough on its own: heavy volume with a full body is a bar that went somewhere, and a long wick on thin volume is a bar that nobody pushed hard.
The volume surge. The bar's tick volume is at least 1.5 times the average of the last 20 bars (Volume Average Length), this bar included. The average's length and the multiplier are the first two inputs of the Absorption Engine group. Tick volume is the number of price changes your broker sent during the bar, not the number of contracts traded. It shows how active a bar was against the bars around it, so the indicator only compares a bar with the same symbol's own recent average.
The rejection wick. For buyers, the lower wick, from the low up to the lower end of the body, is at least 0.40 of the bar's range (Minimum Rejection Wick Ratio), and the close sits high in the range: its close position, 0 at the low and 1 at the high, is at least 0.60. For sellers it is the mirror: the upper wick, from the upper end of the body up to the high, is at least 0.40 of the range, and the close position is at most 0.40. The wick ratio is an input; the two close-position levels are fixed. A bar with no range at all is counted as one tick wide.
Absorption. A volume surge and a buyer rejection on one bar make a buyer absorption; a volume surge and a seller rejection make a seller absorption. One bar cannot be both, because its close position cannot be at least 0.60 and at most 0.40 at once.
A worked candle, with round illustration values rather than prices read from a chart. A bar opens at 1.1030, trades down to 1.1000 and up to 1.1050, and closes at 1.1042. Its range is 50 pips. The body runs from 1.1030 to 1.1042, so the lower wick is 30 pips, 0.60 of the range, and the close position is 0.84. Both pass the buyer rejection. Its tick volume is 2,400 against an average of 1,500, which is 1.6 times the average and passes the 1.5 multiplier. The bar is a buyer absorption. Had it closed at 1.1024, the body would run from 1.1024 to 1.1030, the lower wick would be 24 pips, which still passes, and the close position of 0.48 would fail, whatever the volume.
4. The Signal and When It Is Decided
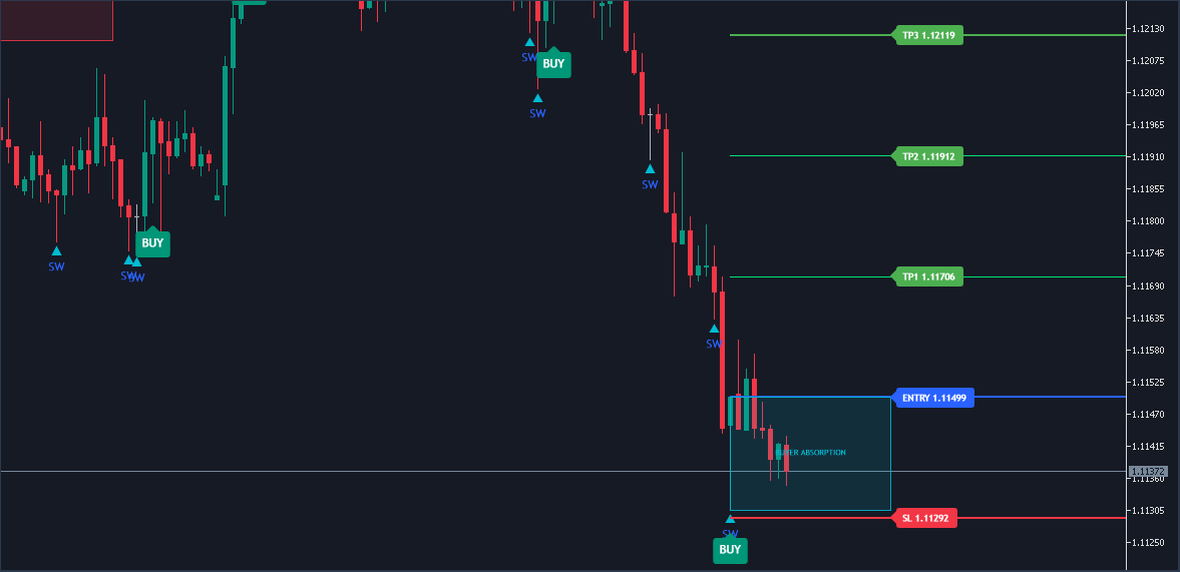
Figure 2. A BUY signal on a MetaTrader chart, with its BUYER ABSORPTION zone and the ENTRY, SL, TP1, TP2 and TP3 lines.
An absorption becomes a signal when everything you switched on agrees:
- The bar is closed. A BUY needs a buyer absorption on a closed bar, a SELL a seller absorption on a closed bar.
- The trend filter (Use EMA Trend Filter, off): a BUY only when the close is above a 200-bar EMA of the close (EMA Length), a SELL only when it is below.
- The sweep filter (Require Liquidity Sweep, off): the same bar must also have swept the recent low for a BUY, or the recent high for a SELL. Section 6 explains the sweep.
- The cooldown: more than 8 bars (Signal Cooldown Bars) since the last signal. The cooldown is shared by both sides: a BUY also holds back the next SELL, and the reverse.
With the defaults both filters are off, so a signal is an absorption on a closed bar that comes more than that many bars after the last signal.
When it is decided. Every signal is decided when its bar closes and does not change after it. MetaTrader reports a close with the next bar's first tick, so a plate sits on the bar that closed and appears as the next bar opens; on a quiet market that tick can come a little later. While a bar is still forming, the dashboard's Buy Pressure or Sell Pressure row may already read DETECTED. That is an absorption taking shape, not a signal, and it can go away again before the close, because the volume, the wick and the close are all still moving.
What a plate says. A BUY plate says that this closed bar had a volume surge, a long lower wick and a close high in its range, that the filters you switched on passed, and that the cooldown had run out. It says nothing about the bars that follow. A rejection tells you the push was turned back on that bar, not that it stays turned back.
A missing plate. An absorption inside the cooldown draws no plate and leaves the zone and the levels as they were. So does one that a filter rejects. On the newest bar the dashboard still shows it, because Buy Pressure and Sell Pressure read the absorption before the filters and the cooldown, while Last Event keeps the side of the previous signal.
5. The Absorption Zones
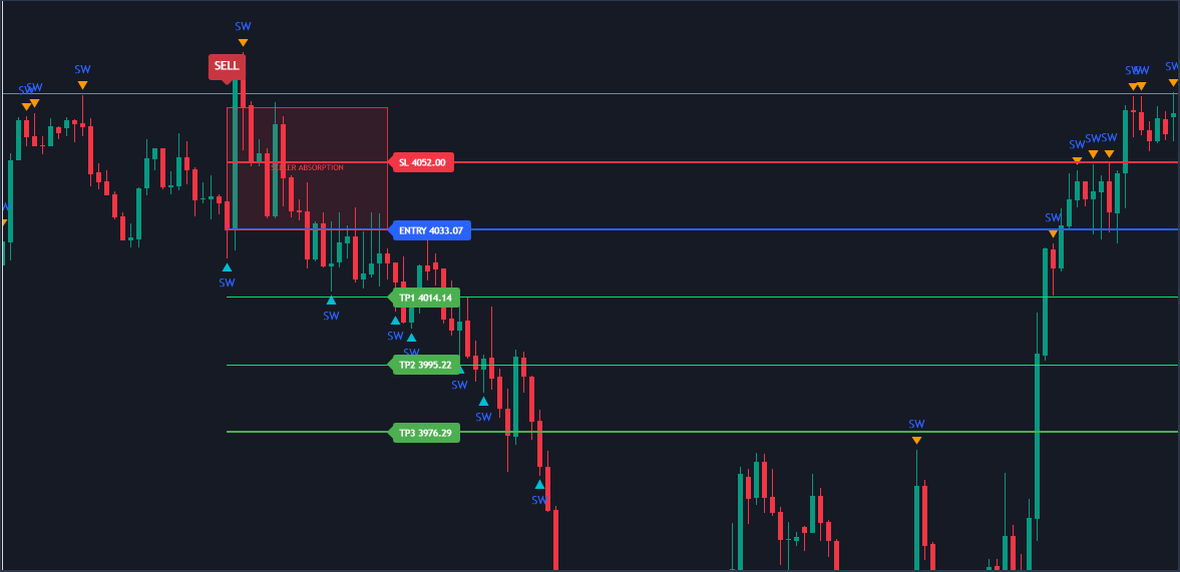
Figure 3. A SELL signal on a MetaTrader chart, with its SELLER ABSORPTION zone.
A zone marks the part of the signal bar where the absorption took place: the wick the push left behind, and the body the bar closed with.
- BUYER ABSORPTION (aqua): drawn from the newest BUY bar, from the top of its body down to its low. It covers the lower wick, where the selling was absorbed, and the body above it.
- SELLER ABSORPTION (red): drawn from the newest SELL bar, from its high down to the base of its body. It covers the upper wick, where the buying was absorbed, and the body below it.
Each zone starts on its signal bar and reaches 20 bars to the right (Zone Extension Bars), with its name written inside. Only the newest zone of each side stays: a new BUY replaces the buyer zone and leaves the seller zone where it is, so the chart can show one zone of each side at the same time. A zone is drawn when its signal prints and does not move afterwards. It does not end when price trades through it, and it does not grow when price comes back to it. Show Absorption Zones (on) hides or shows them.
Reading a zone. A zone is a level to watch, not a forecast. Price that comes back into a buyer zone revisits the place where selling was absorbed before. Whether it is absorbed again there is something only the next bars can show. A zone that price has closed through is still drawn, so judge it by what price did there, not by the fact that it is on the chart.
6. Liquidity Sweeps: the SW Marks
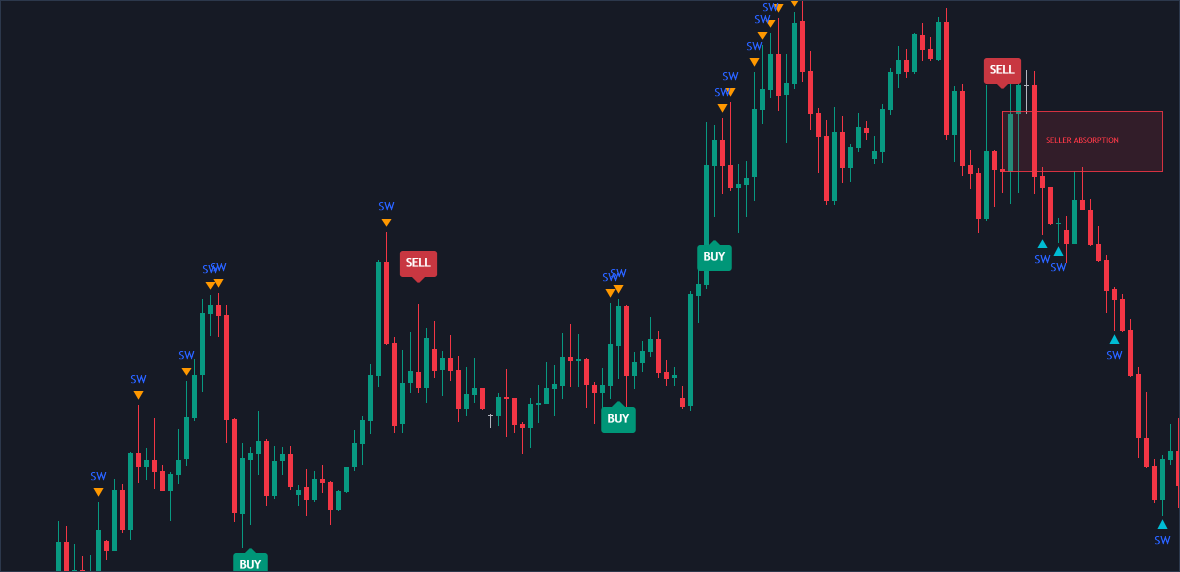
Figure 4. SW marks on a MetaTrader chart: aqua triangles under bars that swept the recent low, orange triangles over bars that swept the recent high.
The recent low is the lowest low of the 20 bars before the current one (Liquidity Lookback), and the recent high is the highest high of the same bars. The current bar is not part of its own window, so a bar can go beyond it.
- A bullish sweep: the bar's low goes below the recent low and its close comes back above it. An aqua triangle sits under the bar, with the text SW.
- A bearish sweep: the bar's high goes above the recent high and its close comes back below it. An orange triangle sits over the bar, with the text SW.
What a sweep says. An obvious low or high is a common place for stop orders and for orders that enter on a break. A bar that trades through it and closes back inside went beyond the level and did not hold there. A sweep says that much; it does not say whose orders were there or how many.
Sweeps and signals are separate. A sweep is marked on every closed bar that qualifies, whatever the filters and the cooldown say. A sweep needs no volume surge and no wick of a set length, and an absorption needs no sweep. So an SW mark can stand alone, and a plate can sit on a bar that swept nothing. When both fall on one bar, a BUY with an aqua SW under it, the bar ran through the recent low on heavy volume and closed high in its range: the two readings agree.
The sweep filter. With Require Liquidity Sweep on, a plate needs a sweep on its own bar, so every BUY then sits on a bullish sweep and every SELL on a bearish one. Show Liquidity Sweeps (on) hides or shows the marks; it does not switch the filter, and the filter still reads the sweeps when the marks are hidden.
7. The Levels: Entry, Stop and Three Targets
A signal lays out five horizontal lines for planning a trade. They are planning references, not orders: the indicator does not place trades, and it does not follow the levels after it draws them.
Entry. The close of the signal bar.
Stop. The 14-bar ATR times 1.5 (Stop Loss ATR Multiplier) away from the entry: below it for a BUY, above it for a SELL. The distance is never less than one tick. It is the unit the targets are measured in.
Targets. TP1 Risk Reward (1.0), TP2 Risk Reward (2.0) and TP3 Risk Reward (3.0) are the targets' distances from the entry, in stop distances, on the side of the signal.
What is drawn. ENTRY (blue) and SL (red) are thick lines, TP1 and TP2 (lime) thin ones and TP3 (green) a thick one. Each line starts at the signal bar and runs to the right edge of the chart. Its label, with the price, sits 20 bars past the signal bar (Target Line Extension). Only the newest signal has levels: a new BUY or SELL removes the old set and draws its own. Show Auto Targets (on) hides or shows them all.
What the levels are not. The levels are never compared with later prices. No line changes when price reaches it, and no label says that a target or the stop was touched. The indicator keeps no record of past signals and computes no statistics.
A worked calculation, with round illustration values rather than prices read from a chart. A BUY signal bar closes at 1.1000 with the ATR at 20 pips. At the default 1.5 ATR the stop distance is 30 pips, so SL sits at 1.0970. The targets follow at 1, 2 and 3 times that distance: TP1 at 1.1030, TP2 at 1.1060 and TP3 at 1.1090. For a SELL on the same bar every level is the mirror: SL at 1.1030 and the targets at 1.0970, 1.0940 and 1.0910.
Measure from your own fill. You can act only after the signal bar's close, at another price and with a spread. Say your fill is 1.1004. From there the stop is 34 pips away and TP1 only 26, so work out your own distances before you decide anything. The levels take no account of spread, slippage, commission or position size, and the stop distance changes with the ATR, so size each position from its own stop.
Where the labels sit. Because the labels sit past the signal bar, on a fresh signal they are past the last bar. Give the chart some room on the right with the chart shift, or switch on Pin Labels Inside Chart (off by default) to pull them in.
8. The Radar Dashboard, Row by Row
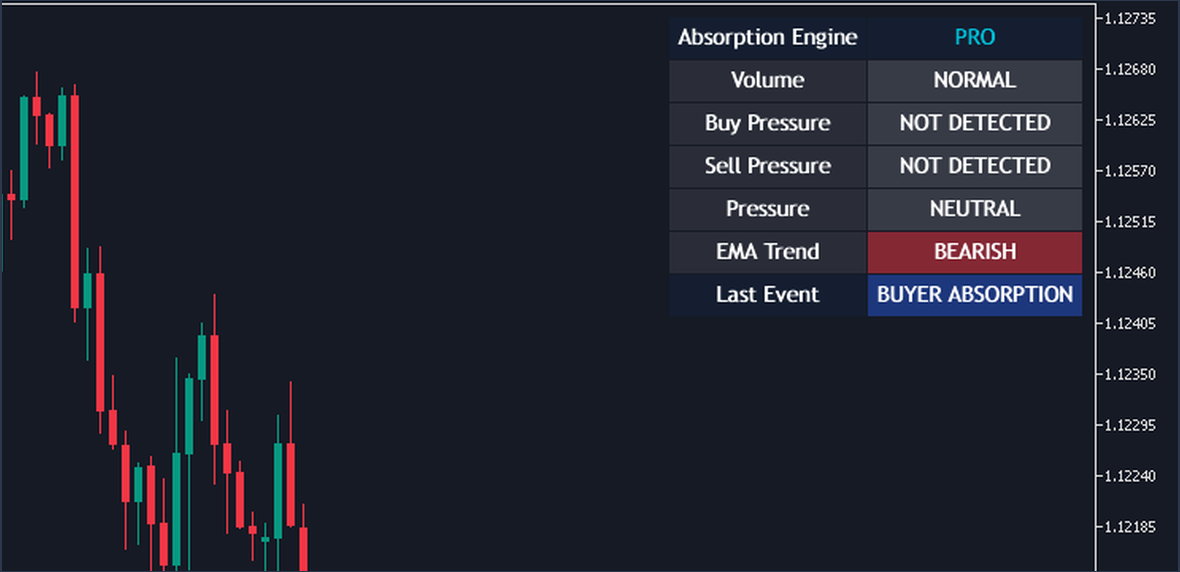
Figure 5. The radar dashboard in the top right corner of a MetaTrader chart.
The dashboard is a table of two columns and seven rows in the top right corner of the chart. Every row reads the newest bar, so on the forming bar it changes with every tick and only settles when the bar closes. Show Dashboard (on) hides or shows it.
| Row | What it shows | When |
|---|---|---|
| Absorption Engine | PRO | The header. |
| Volume | HIGH VOLUME or NORMAL | HIGH VOLUME when the newest bar's tick volume has reached the average times the multiplier. |
| Buy Pressure | DETECTED or NOT DETECTED | DETECTED when the newest bar is a buyer absorption, before the filters and the cooldown. |
| Sell Pressure | DETECTED or NOT DETECTED | The same for a seller absorption. |
| Pressure | BUY PRESSURE, SELL PRESSURE or NEUTRAL | The two rows above in one reading, NEUTRAL when neither is detected. |
| EMA Trend | BULLISH, BEARISH or NEUTRAL | The newest close above, below or exactly on the EMA, whether the trend filter is on or off. |
| Last Event | WAITING, BUYER ABSORPTION or SELLER ABSORPTION | The side of the last signal, WAITING until the first one. |
Reading the rows together. Volume and the two pressure rows are the ingredients of section 3 for the bar that is forming. HIGH VOLUME alone is a high-volume bar with no rejection yet. HIGH VOLUME with Buy Pressure DETECTED is a buyer absorption taking shape: it becomes a BUY only if it is still there at the close and the filters and the cooldown let it through. Last Event is the row that remembers. It changes only when a signal prints on a closed bar and keeps the side until the next one, so it can read BUYER ABSORPTION while Sell Pressure reads DETECTED on the newest bar.
Right after a signal. When a plate prints, the bar that made it has closed, and the dashboard already reads the next bar. So Last Event names the new signal, while Volume and the pressure rows usually start again from NORMAL and NOT DETECTED, because a bar that has just opened has little volume yet.
Two things it does not do. The dashboard computes no statistics: no count of signals, no results and no rate of any kind. And EMA Trend is a reading, not a filter: the trend filter is a separate switch, off by default.
9. The Filters, and What Each Removes
With the defaults, every absorption outside the cooldown is a signal. Two switches and one number narrow that down, and each of them removes something.
Use EMA Trend Filter (off). A BUY only above the EMA, a SELL only below it. It keeps the signals that agree with the slower direction and drops the ones against it, which includes the first turn after a long move. It also needs the EMA to exist: on a chart with fewer bars than EMA Length there is no EMA yet, and with the filter on there is no signal until there is. Switch on Show EMA to see the line the filter reads; the EMA Trend row tells you which side the newest close is on.
Require Liquidity Sweep (off). A signal also needs a sweep of the recent low or high on its own bar. It keeps the absorptions that ran through an obvious level and closed back, and drops those in the middle of a range. Signals become rarer, and long stretches can pass without one.
Signal Cooldown Bars (8). After a signal, the next absorption on either side must wait more than that many bars. A lower value shows absorptions closer together, and 0 lets one follow on the very next bar. A higher value leaves more absorptions unmarked after each signal, which keeps one move from printing a row of plates.
A filter says nothing about what happens after the signals it keeps. Judge any change on your own market, on a demo account.
10. Timeframes, Sessions and Symbols
The rules are the same on every timeframe and symbol. What changes is what one bar holds.
Timeframes. On M1 a volume surge can be a few seconds of busy quoting, and a long wick a single quick move. On H1 and H4 a surge is an hour or more of trading, and the wick is the part of it that did not hold. The zone's width, the sweep window and the cooldown are all counted in bars, so the same setting covers minutes on M1 and days on H4.
Sessions. On most forex symbols tick volume rises when a major session opens, so the first bars of a session are compared with the quieter bars before them and reach the multiplier more easily. A surge there is partly the clock. One way to read it: compare the bar with the same hour on earlier days, by eye, before you treat it as unusual. The reverse holds in quiet hours, when the average is low and a modest bar can reach it.
News. A release can make one bar with heavy volume and long wicks on both sides. Whether it is marked depends only on where it closes: a close high in the range makes it a buyer absorption, a close low makes it a seller one, and a close in the middle makes it neither.
Symbols and brokers. Tick volume is your broker's own count of price changes. A symbol with few quotes has a low average, and a small rise reaches the multiplier. Two brokers count differently, so their charts can mark different bars. The stop and the targets are measured in the symbol's own ATR, so the same multiplier fits a quiet pair and a fast index.
11. A Step-by-Step Way to Use It
When a plate prints or an alert arrives, read the chart in the same order every time.
- Which side, on which bar? BUY or SELL, on the bar that just closed.
- How did the bar look? The length of the wick against the range, and how near the close sits to the far end.
- Where did it happen? On an SW mark, near an older zone, at a level you were already watching, or in open space.
- What is the slower direction? The EMA Trend row, or the Trend EMA line if you show it.
- What are the levels? The stop's distance from the entry, and how far price already is from the entry by the time you can act.
- What would change the picture? A close through the zone, or an absorption on the other side.
One reading, as a walkthrough of what to look at, with round illustration values. A BUY plate prints under a bar whose low swept the recent low, so an aqua SW mark sits under the same bar. The BUYER ABSORPTION zone runs from the top of its body down to its low. EMA Trend reads BEARISH: the signal goes against the slower direction, and the trend filter would have dropped it. The stop is 30 pips below the entry and TP1 30 pips above. The next bar opens 4 pips above the entry, so from a fill there the stop is 34 pips away and TP1 26. What you do with that is your own plan.
A second reading. A SELL plate prints over a bar in the middle of a range, with no SW mark. EMA Trend reads BEARISH, so the signal agrees with the slower direction. The seller zone covers the upper wick and the body. Nothing was swept, so the sweep filter would have dropped it. One reading agrees and one does not, and the decision is yours.
A routine.
- Attach it with the defaults on the timeframe you trade and let it work through the history.
- Scroll back and look, by eye, at how price moved after the plates on that symbol.
- Decide in advance which plates you would consider: any, only with the trend, only on a sweep, or both, and switch on the matching filter or keep it as a rule of your own.
- Switch on the alerts you need and choose a channel.
- When an alert arrives, run the six questions above before anything else.
- Keep a journal of the signals you take and the ones you skip, with the reason.
Common misreadings
- Treating a plate as an instruction. It says the closed bar matched fixed rules.
- Reading the forming bar as final. Buy Pressure and Sell Pressure can read DETECTED and go away before the close.
- Reading a zone as a level that must hold. It marks where an absorption happened once.
- Reading the name as a fact about who traded. The rule reads candles and tick volume; it cannot see who was behind them.
- Comparing tick volume across symbols or brokers. Each feed counts its own ticks.
12. Alerts
There are five conditions, each with its own switch: Buyer Absorption, Seller Absorption, Bullish Sweep, Bearish Sweep and a high-volume bar alert. Buyer Absorption and Seller Absorption are on by default, the other three off.
Every condition is decided at the bar's close. The two absorption alerts fire on a signal, so they follow the filters and the cooldown. The sweep alerts fire on every sweep, and the high-volume bar alert on every closed bar whose tick volume reached the average times the multiplier, whatever the filters and the cooldown say. The drawing switches change what you see, not what fires: with Show BUY / SELL Signals off, a signal still alerts.
Four channels deliver them: a pop-up (on by default), a sound of your choice, a push notification to your phone and e-mail. Push and e-mail use the terminal's own settings, and Test Alerts on Start checks your settings without waiting for a signal. Alert Frequency chooses Once Per Bar, Once Per Bar Close, Only Once or Once Per Minute; because every condition is decided at the close, the first two behave the same here. Nothing fires during the history pass or in the Strategy Tester. The pop-up reads:
Smart Absorption Radar | Buyer Absorption: Buyer absorption confirmed on candle close. | EURUSD H1 Smart Absorption Radar | Bullish Sweep: Bullish liquidity sweep detected. | EURUSD H1
An alert is the moment to run the six questions of section 11, not an instruction.
13. What It Does Not Do
- It does not place trades. It draws and alerts; you place and manage every order.
- It does not see order flow. It reads candles and tick volume; bids, asks and the traders behind them are out of its sight.
- It does not promise a result. A plate, a zone, a sweep or a target says where price has been, not where it will go.
- It does not change the past. A signal waits for the closed bar and stays as it printed. On the forming bar only the dashboard moves.
- It keeps no score. It computes no statistics about its own signals.
- It reads only your chart. Everything reads your broker's candles and tick volume, so another feed can mark other bars. It needs no DLL, no internet access and no files.
14. Common Settings Changes, and What Each Trades Away
Install the indicator from its Market page (MetaTrader 5: {{MT5_URL}}, MetaTrader 4: {{MT4_URL}}) and attach it with the defaults. All 34 inputs are described in the user manual ({{MANUAL_URL}}). A setting says nothing about what comes after the signals it keeps, so judge any change on your own market, on a demo account.
| Input | Default | What changing it trades away |
|---|---|---|
| Volume Average Length | 20 | Shorter follows changes in activity sooner. Longer measures a surge against a longer stretch. |
| Minimum Rejection Wick Ratio | 0.40 | Higher keeps only long wicks and shows fewer signals. Lower accepts shorter wicks and shows more. |
| Liquidity Lookback | 20 | Longer looks for sweeps of older, more obvious lows and highs and finds fewer. Shorter marks more. |
| Use EMA Trend Filter | false | On drops every signal against the EMA, and every signal before the EMA exists. |
| EMA Length | 200 | Shorter follows the direction more closely and turns more often. It also moves the EMA Trend row. |
| Require Liquidity Sweep | false | On keeps only absorptions on a sweep bar and leaves long stretches with none. |
| Signal Cooldown Bars | 8 | Shorter shows absorptions closer together. Longer leaves more of them unmarked after a signal. |
| Stop Loss ATR Multiplier | 1.5 | Wider puts the stop and every target further away, in proportion. |
| Zone Extension Bars | 20 | How far the zone is drawn, and nothing else. |
The volume multiplier, 1.5 by default, works the same way: higher keeps only heavier bars, lower accepts more. The user manual lists it under its dialog name.
Change one setting at a time, and start from the defaults on the timeframe you trade.
15. Conclusion
A high-volume bar says little on its own. Smart Absorption Radar says whether its push was turned back, on which side, and whether it ran through a recent low or high on the way, by fixed rules, and it lays out the levels you need for a plan. The decision stays yours. Test it on a demo account first and keep a journal of the signals you take.
Risk Disclaimer
Trading leveraged products carries a high level of risk and may not be suitable for all investors. Smart Absorption Radar is an analysis tool, not financial advice. Test it on a demo account first.