Smart Absorption Radar User Manual for MetaTrader 4 and MetaTrader 5

1. What Smart Absorption Radar Is
Smart Absorption Radar is an indicator for MetaTrader 4 and MetaTrader 5, drawn on the main price chart. It marks BUY and SELL on closed bars where a volume surge meets a long rejection wick, draws the absorption zone of the newest signal of each side, marks liquidity sweeps of the recent low and high, lays out an entry, a stop and three targets for the newest signal, and shows a radar dashboard.
It does not place trades and has no access to your account. Absorption is estimated from candles and tick volume; the indicator does not see order flow, bids or asks. The stop and the targets are planning references, not orders, and not a forecast. The trading guide explains how to read each mark and how to use them together.
2. Installation
The steps are the same on both platforms, and nothing is copied by hand. Each platform is a separate product.
- Buy or rent the indicator on its MQL5 Market page with your MQL5 account.
- In MetaTrader, log in to the same account (Tools > Options > Community).
- Open the Toolbox (Ctrl+T; the Terminal window on MetaTrader 4), go to the Market tab, find it under Purchased and click Install.
- In the Navigator (Ctrl+N), open Indicators, then Market, and drag it onto a chart.
- Change anything you want on the Inputs tab and click OK. Change an input later with Ctrl+I on the chart.
It runs on any symbol and timeframe from M1 to monthly, needs no DLL, no internet access and no files, and removes everything it drew when you remove it.
On attaching, it calculates the newest 20,000 bars (Bars To Calculate) before it draws. A chart with fewer bars uses all it has; the terminal's limit is in Tools > Options > Charts, Max bars in chart.
3. What You See on the Chart
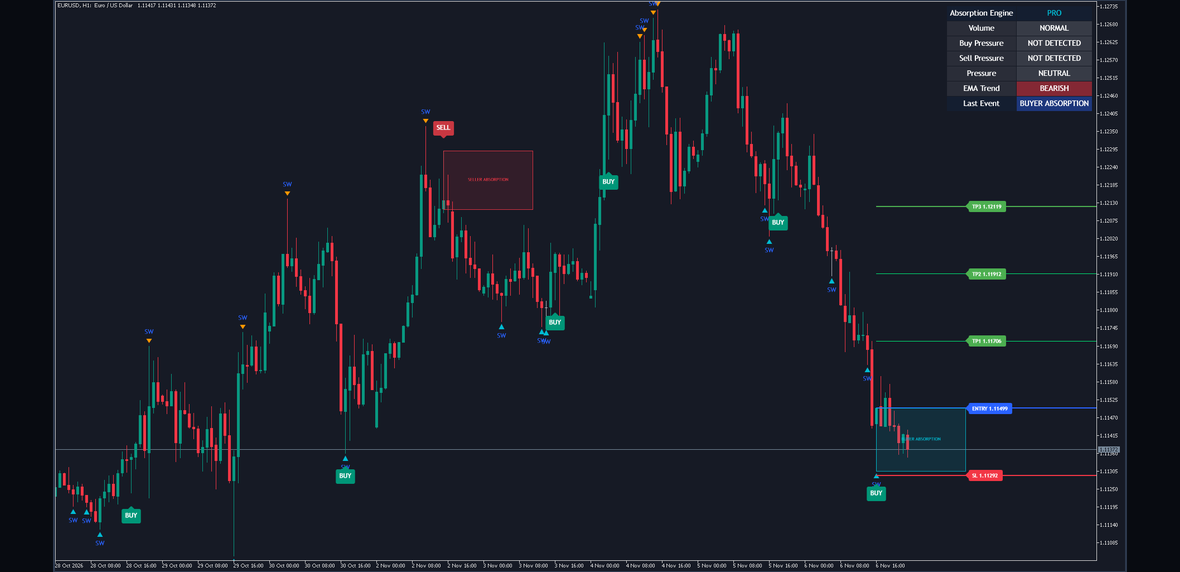
Figure 1. The indicator on a MetaTrader chart: BUY and SELL plates, an absorption zone, SW marks, the levels of the newest signal and the radar dashboard.
| Mark | What it is |
|---|---|
| BUY plate (green) | Under a closed bar where a volume surge met a long lower wick and a close high in the range, with the filters passed and the cooldown over. |
| SELL plate (red) | Over a closed bar with the mirror: a long upper wick and a close low in the range. |
| BUYER ABSORPTION zone (aqua) | From the newest BUY bar, from the top of its body down to its low, Zone Extension Bars wide. |
| SELLER ABSORPTION zone (red) | From the newest SELL bar, from its high down to the base of its body. |
| SW triangle, aqua, under a bar | A bullish sweep: the low went below the lowest low of the previous Liquidity Lookback bars and the close came back above it. |
| SW triangle, orange, over a bar | A bearish sweep: the high went above the highest high of those bars and the close came back below it. |
| ENTRY, SL, TP1, TP2, TP3 | The newest signal's levels: blue, red, lime, lime and green lines to the right edge of the chart, with priced labels. |
| Trend EMA (orange) | The EMA of the close, when Show EMA is on. |
Each side keeps only its newest zone, and only the newest signal has levels: a new signal replaces them. The labels sit 20 bars past the signal bar (Target Line Extension). The stop sits the 14-bar ATR times Stop Loss ATR Multiplier from the entry, and the targets are whole stop distances beyond it.
The radar dashboard sits in the top right corner. Every row reads the newest bar:
| Row | What it shows | When |
|---|---|---|
| Absorption Engine | PRO | The header. |
| Volume | HIGH VOLUME or NORMAL | The newest bar's tick volume against the average times Volume Spike Multiplier. |
| Buy Pressure | DETECTED or NOT DETECTED | A buyer absorption on the newest bar, before the filters and the cooldown. |
| Sell Pressure | DETECTED or NOT DETECTED | A seller absorption, the same way. |
| Pressure | BUY PRESSURE, SELL PRESSURE or NEUTRAL | The two rows above in one reading. |
| EMA Trend | BULLISH, BEARISH or NEUTRAL | The newest close against the EMA of EMA Length. |
| Last Event | WAITING, BUYER ABSORPTION or SELLER ABSORPTION | The side of the last signal; it changes only when a signal prints. |
4. When Things Are Calculated
- On the closed bar: signals are decided on the closed bar, as are the zones, the levels, the SW marks and every alert. What is drawn on a closed bar does not change after it. A bar counts as closed when the next bar's first tick arrives.
- On the forming bar: the dashboard moves with every tick. It is worked out at most four times a second, then once more when the bar closes.
- Again from the start: when older history is scrolled into the chart, or after a gap of more than 1,000 new bars. No alert is sent for bars calculated again.
5. Inputs
There are 34 inputs in 7 groups. On MetaTrader 4 each group starts with a separator line, a label that changes nothing. A value outside its allowed range is held at the nearest end of it.
Absorption Engine
| Input | Default | Allowed | What it does |
|---|---|---|---|
| Volume Average Length | 20 | 5 or more | Bars in the tick volume average, the bar itself included. |
| Volume Spike Multiplier | 1.5 | 1.0 or more | A bar's tick volume must reach the average times this. |
| Minimum Rejection Wick Ratio | 0.40 | 0.1 to 0.9 | The wick's minimum share of the bar's range. The close-position levels, 0.60 and 0.40, are fixed. |
| Liquidity Lookback | 20 | 5 or more | The bars before the current one whose lowest low and highest high a sweep must pass. |
Signal Filters
| Input | Default | Allowed | What it does |
|---|---|---|---|
| Use EMA Trend Filter | false | true/false | BUY only above the EMA, SELL only below it. |
| EMA Length | 200 | 20 or more | The EMA of the close, for the filter, the EMA Trend row and the line. |
| Require Liquidity Sweep | false | true/false | A signal also needs a sweep on its own bar. |
| Signal Cooldown Bars | 8 | 0 or more | A new signal needs more than this many bars since the last, on either side. |
With Use EMA Trend Filter on, no signal prints until the chart has EMA Length bars, because the EMA does not exist before that.
Chart Visuals
| Input | Default | Allowed | What it does |
|---|---|---|---|
| Show Absorption Zones | true | true/false | The newest zone of each side. |
| Show Liquidity Sweeps | true | true/false | The SW marks. The sweep filter does not depend on it. |
| Show EMA | false | true/false | The Trend EMA, an orange line. |
| Show BUY / SELL Signals | true | true/false | The plates. The alerts do not depend on it. |
| Zone Extension Bars | 20 | 1 to 200 | How far a zone reaches to the right. |
Radar Dashboard
| Input | Default | Allowed | What it does |
|---|---|---|---|
| Show Dashboard | true | true/false | The table, top right. |
Auto Targets
| Input | Default | Allowed | What it does |
|---|---|---|---|
| Show Auto Targets | true | true/false | The ENTRY, SL and TP lines and labels. |
| Stop Loss ATR Multiplier | 1.5 | 0.2 or more | The stop's distance, in the 14-bar ATR. |
| TP1 Risk Reward | 1.0 | 0.5 or more | TP1, in stop distances. |
| TP2 Risk Reward | 2.0 | 1.0 or more | TP2, the same way. |
| TP3 Risk Reward | 3.0 | 1.5 or more | TP3, the same way. |
| Target Line Extension | 20 | 5 to 200 | Where the labels sit, in bars past the signal. |
MetaTrader
| Input | Default | Allowed | What it does |
|---|---|---|---|
| Bars To Calculate (0 = all) | 20,000 | 0 or more | Section 7. |
| Pin Labels Inside Chart | false | true/false | Section 7. |
Alerts
| Input | Default | Allowed | What it does |
|---|---|---|---|
| Alert Frequency | Once Per Bar | Once Per Bar, Once Per Bar Close, Only Once or Once Per Minute | Section 6. |
| Alert: Buyer Absorption | true | true/false | A BUY. |
| Alert: Seller Absorption | true | true/false | A SELL. |
| Alert: Bullish Sweep | false | true/false | Every bullish sweep. |
| Alert: Bearish Sweep | false | true/false | Every bearish sweep. |
| Alert: Volume Spike | false | true/false | Every closed bar whose tick volume reached the average times the multiplier. |
| Alert Pop-up | true | true/false | The terminal's alert window. |
| Alert Sound | false | true/false | Plays the file. |
| Alert Sound File (in the terminal's Sounds folder) | alert.wav | a file name | Blank plays nothing. |
| Alert Push Notification | false | true/false | To your phone. |
| Alert E-mail | false | true/false | Sends an e-mail. |
| Test Alerts on Start | false | true/false | One test through every channel on. |
6. Setting Up Alerts
- Choose the conditions. Alert: Buyer Absorption and Alert: Seller Absorption are on by default.
- Choose the channels: pop-up, sound, push and e-mail. The pop-up is on by default.
- Sound: switch it on and name a .wav file from the Sounds folder of the terminal's installation folder.
- Push notification: in Tools > Options > Notifications, enable push notifications, enter the MetaQuotes ID shown in the MetaTrader app on your phone and click Test; then switch the channel on. A message is cut at 255 characters.
- E-mail: in Tools > Options > Email, enable e-mail, enter your mail server, login, password and addresses and click Test; then switch the channel on. The subject names the indicator, the condition, the symbol and the timeframe.
- Test: Test Alerts on Start checks all of this without waiting for a signal. Every change of an input sends one more, so switch it off afterwards.
What each condition fires on. Alert: Buyer Absorption and Alert: Seller Absorption fire on a BUY and a SELL, so they follow the filters and the cooldown. Alert: Bullish Sweep and Alert: Bearish Sweep fire on every sweep, and Alert: Volume Spike on every closed bar whose tick volume reached the average times Volume Spike Multiplier, whatever the filters and the cooldown say. The drawing switches change what you see, not what fires.
Alert Frequency. Once Per Bar (the default) sends the first time a condition is true on a bar. Once Per Bar Close sends only at the close; every condition here is decided at the close, so the two behave the same. Only Once sends the first time per alert, until the indicator reloads. Once Per Minute sends at most once a minute per alert.
Every condition is decided at the bar's close. Nothing fires during the history pass or in the Strategy Tester, and a bar that had already closed when you attached the indicator sends nothing.
The pop-up starts with the indicator's name and the condition, and ends with the symbol and timeframe:
Smart Absorption Radar | Buyer Absorption: Buyer absorption confirmed on candle close. | EURUSD H1 Smart Absorption Radar | Seller Absorption: Seller absorption confirmed on candle close. | EURUSD H1 Smart Absorption Radar | Bullish Sweep: Bullish liquidity sweep detected. | EURUSD H1 Smart Absorption Radar | Bearish Sweep: Bearish liquidity sweep detected. | EURUSD H1 Smart Absorption Radar | Volume Spike: Volume spike detected. | EURUSD H1 Smart Absorption Radar | test: Smart Absorption Radar: test alert on EURUSD H1 @ 1.12345. | EURUSD H1
A push notification leaves out the name at the start. An e-mail carries the name, the condition, the symbol and the timeframe in its subject, and the message in its body. For a BUY, those three read:
Buyer Absorption: Buyer absorption confirmed on candle close. | EURUSD H1
Smart Absorption Radar | Buyer Absorption | EURUSD H1
Buyer absorption confirmed on candle close. | EURUSD H1
7. Bars To Calculate and Pin Labels
Bars To Calculate (20,000 by default; 0 = the whole chart) sets where history starts. A lower setting starts faster, and it can change the earliest signals, because each signal waits for the cooldown of the one before it and the averages need their bars first.
Pin Labels Inside Chart (off by default). The level labels sit past the signal bar, so on a fresh signal they are past the last bar; give the chart room on the right with the chart shift. Switched on, while the last bar is on screen, it compresses the space after that bar so the labels and the zones stay inside the chart.
8. MetaTrader 5 and MetaTrader 4: How the Drawing Works
The drawing is one image with real transparency, following every scroll and zoom, and the dashboard is a second image in the top right corner. MetaTrader 4 draws on the terminal's interface thread, so it repaints the forming bar at most once a second; a new bar is repainted at once. In a Strategy Tester run without visual mode nothing is drawn.
9. Troubleshooting
Nothing appears for a while. It works through every bar of Bars To Calculate before it draws. A lower value is faster.
The labels are off the right edge. Use the chart shift or Pin Labels Inside Chart.
No signal for a long time. Check the filters. With Use EMA Trend Filter on, nothing prints until the chart has EMA Length bars, and then only on the EMA's side. With Require Liquidity Sweep on, only sweep bars can signal. After a signal, the next absorption waits more than Signal Cooldown Bars bars.
Buy Pressure reads DETECTED but no plate appears. The row reads the forming bar, before the filters and the cooldown. A plate needs the closed bar to qualify, and it appears when the next bar's first tick arrives.
The zone or the levels have gone. A new signal replaced them: a zone by the next signal of its side, the levels by the next signal of either side. Show Absorption Zones and Show Auto Targets switch them.
EMA Trend reads NEUTRAL. The close sits exactly on the EMA, or the chart has fewer bars than EMA Length.
No alerts arrive. Check the condition's switch and a channel. Alerts fire only for bars closing while it runs, never for history or in the Strategy Tester. Push and e-mail also need Tools > Options. Test Alerts on Start checks them.
Another chart marks other bars. Tick volume is your broker's own count, so another broker or another feed can mark other bars. A different Bars To Calculate can also change the earliest signals.
The dashboard covers part of the chart. Show Dashboard switches it off; the signals and the alerts do not depend on it.
10. Frequently Asked Questions
Does it repaint? No plate, zone, level or SW mark moves after its bar closes; a zone or a set of levels is only ever removed, by a newer signal. Only the dashboard moves on the forming bar. A new calculation can differ near its start, because Bars To Calculate sets where history starts.
Does it work on any symbol? It reads tick volume, which MetaTrader keeps for every symbol, so it runs on forex, metals, indices and the rest alike. The volume is always compared with the same symbol's own average.
Can I watch it in the Strategy Tester? Yes, in visual mode, to see how it marks bars as they close. It sends no alerts there.
11. Support
Ask in the Comments (Discussion) section of the product's page on mql5.com. Give the platform and build, the symbol and timeframe, your broker, the inputs you changed, a screenshot, and the lines of the Experts and Journal tabs from that time.
12. Version History
- 1.00: first release for MetaTrader 4 and MetaTrader 5.
Risk Disclaimer
Trading leveraged products carries a high level of risk and may not be suitable for all investors. Smart Absorption Radar is an analysis tool, not financial advice. Test it on a demo account first.