
Available on the MQL5 Market: FVG and Structure PRO
Risk notice. Trading involves risk of loss. This indicator marks price structures on the chart; it does not predict the market, does not place trades and does not guarantee any result. Use it together with your own analysis and risk management, and test on a demo account first.
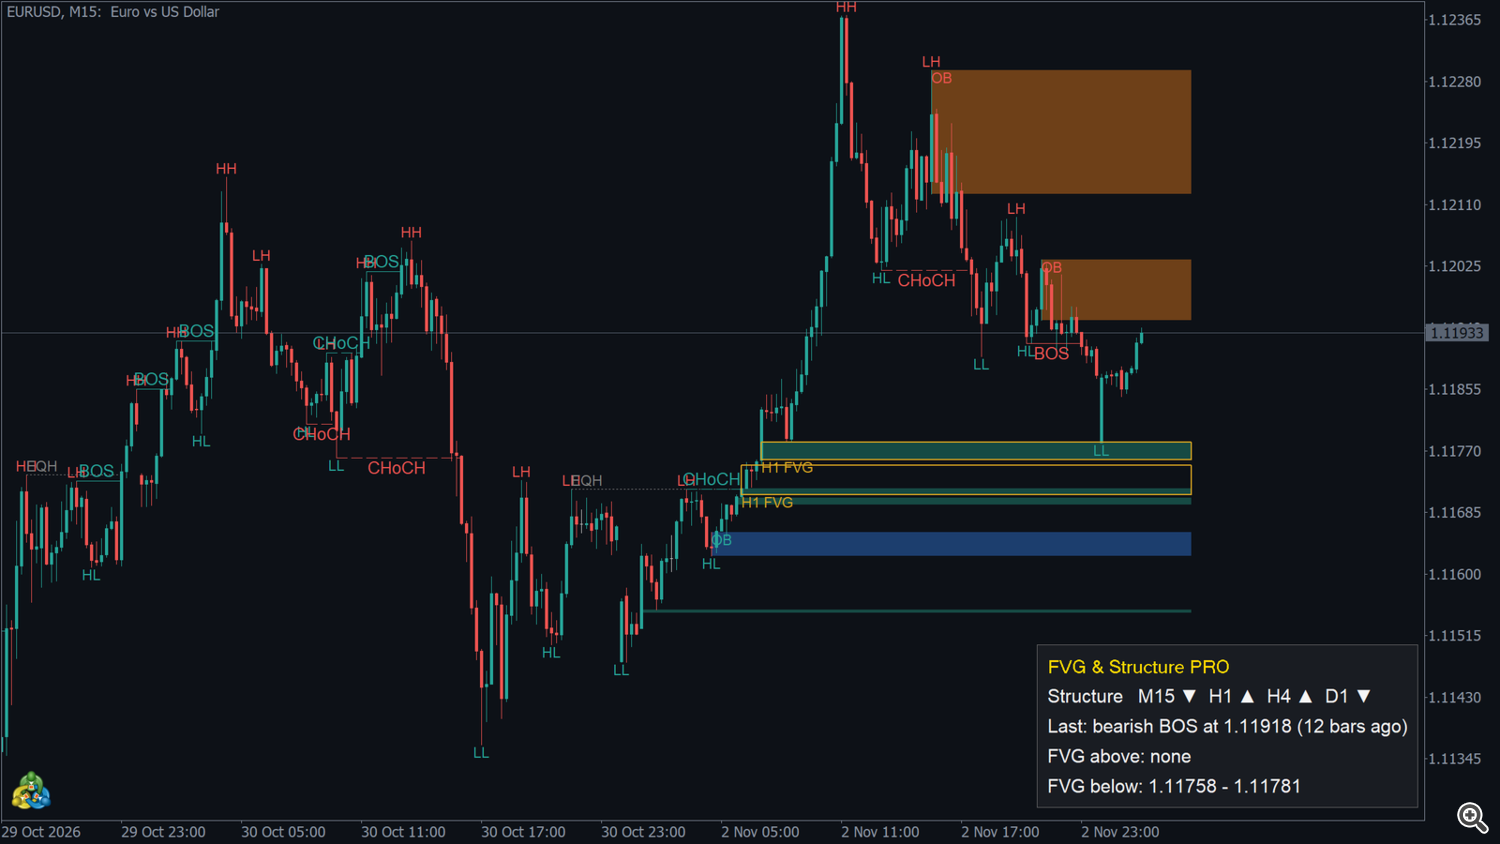
FVG and Structure PRO draws market structure (BOS / CHoCH), fair value gaps (FVGs) with fill tracking, order blocks, equal highs / lows, higher timeframe FVGs, an optional premium / discount range and a multi-timeframe structure panel. Every element is confirmed on a closed bar: nothing is redrawn after it appears. It works on any symbol, any broker and any timeframe.
New in version 2.00
- 5 new buffers for Expert Advisors and dashboards: nearest open bullish FVG (top, bottom), nearest open bearish FVG (top, bottom) and a zone event (new / mitigated FVG, new / broken order block) — section 14.
- FVGs and order blocks are tracked even when their drawing is off, so the buffers also work on a clean chart. Drawing, alerts and the existing buffers are unchanged.
- Panel: the "bars ago" text is hidden while the bar of the last event is not yet available in the chart history.
1. Installation and first start
- Buy or rent the indicator on the MQL5 Market and install it from the Market tab of the terminal (Toolbox → Market → Purchased → Install).
- Open a chart and drag FVG and Structure PRO from the Navigator (Indicators → Market) onto it.
- Keep the default inputs or adjust them (section 13) and press OK.
The indicator analyses the last 1500 bars (input Bars analysed) and then follows every new bar. The panel appears in the lower right corner. On the chart the indicator is called FVG & Structure PRO.
Settings that make the indicator refuse to start (the inputs window opens again): Swing strength outside 1-50, Bars analysed below 100, or any "per side" limit below 1.
2. Chart legend
| On the chart | Meaning |
|---|---|
| Solid line + BOS label (teal / red) | Break of structure: a bar closed beyond the last swing high (teal, label above) or swing low (red, label below) in the direction of the current trend. |
| Dashed line + CHoCH label (teal / red) | Change of character: the same kind of break, but against the current trend (the structure trend flips). |
| HH / LH labels (red, above the high) | Higher high / lower high, compared with the previous swing high (optional). |
| HL / LL labels (teal, below the low) | Higher low / lower low, compared with the previous swing low (optional). |
| Dark green filled box | Open bullish FVG. |
| Dark red filled box | Open bearish FVG. |
| Dark blue filled box + OB label (teal) | Active bullish order block. |
| Dark brown filled box + OB label (red) | Active bearish order block. |
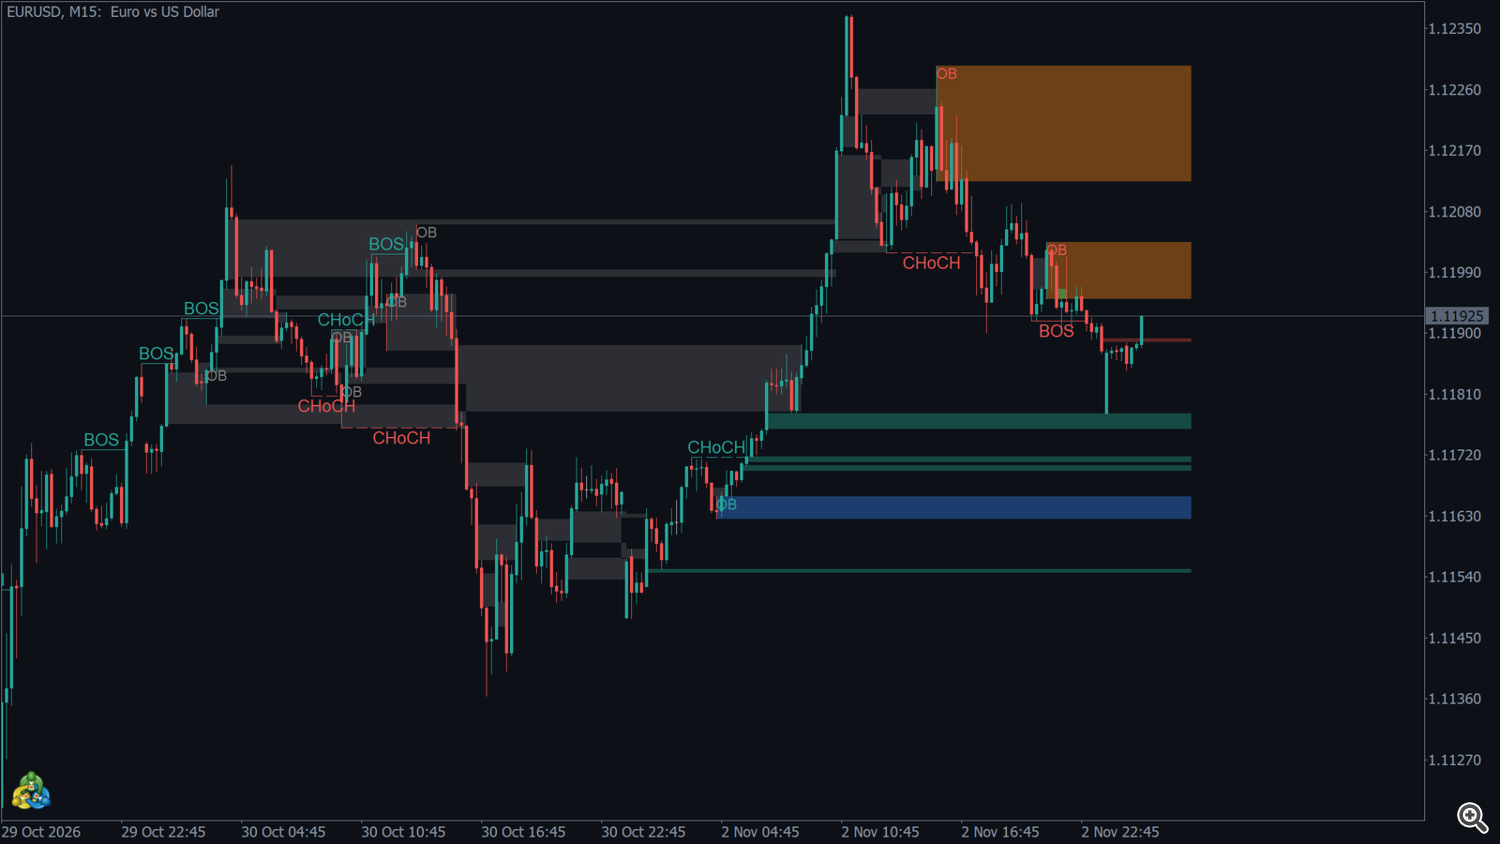
| Dark grey box (grey OB label for order blocks) | Mitigated FVG or broken order block — only when Hide mitigated is off. |
| Gold outlined box + label such as H1 FVG | Open FVG of the higher timeframe (optional). |
| Gold dotted line + EQH / EQL | Equal highs / equal lows (resting liquidity). The line turns grey once price trades through it (swept). |
| Red dotted line Premium, silver dashed Equilibrium, teal dotted Discount | Range of the current swing high / swing low and its midpoint (optional). |
| Text panel (lower right) | Structure bias M15 / H1 / H4 / D1, last structure break, nearest FVG above and below the price. |
Every line and box has a tooltip: hover the mouse over it to read its type and prices. The objects are hidden from the object list and cannot be selected, so they are not moved by accident. Active zones and levels extend 10 bars to the right of the current bar (input Active zones extend right).
3. Market structure: BOS and CHoCH
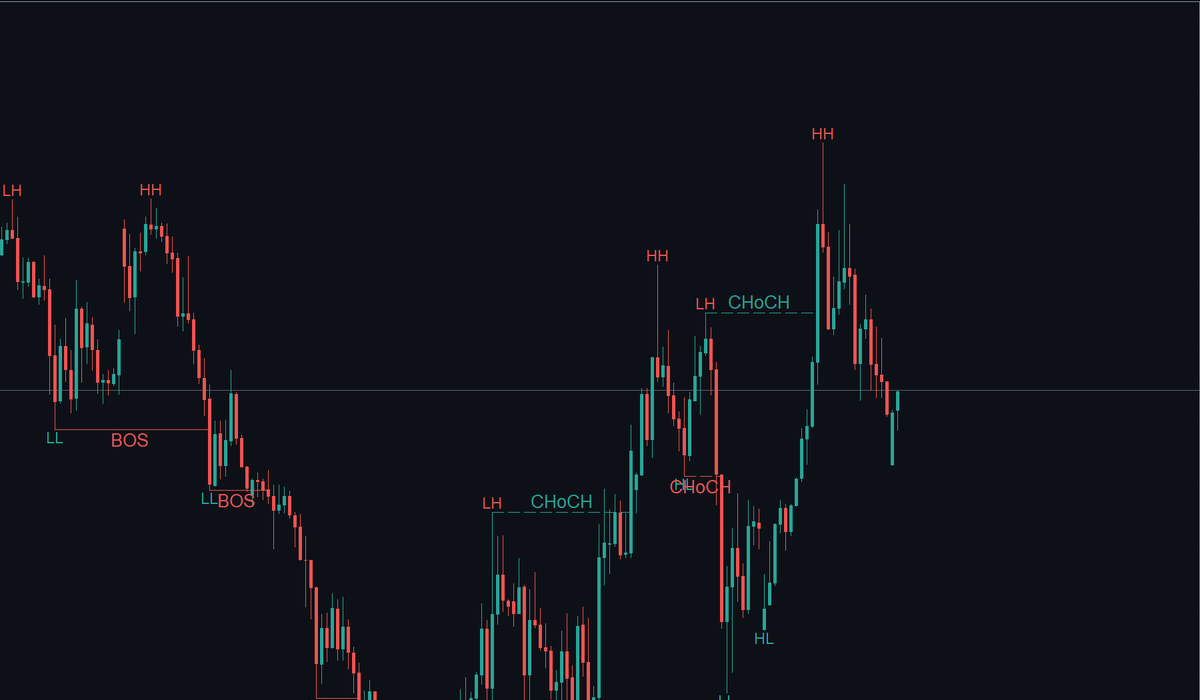
A swing high is a bar whose high is above the highs of the Swing strength bars on each side (default 5); a swing low is the mirror. A swing is therefore confirmed Swing strength bars after it formed.
- When a bar closes above the last swing high, a bullish break is drawn from the swing to the breaking bar; a close below the last swing low draws a bearish break.
- The break is a BOS (solid line) when it follows the current trend and a CHoCH (dashed line) when it reverses it. The first break after loading is a BOS.
- Each swing can be broken only once. Wicks beyond a swing do not count — only closes.
- Only the last Structure breaks kept on chart (default 20) breaks stay on the chart; older ones are removed. Swing labels keep twice that number.
Swing labels (input HH / HL / LH / LL labels, off by default) mark each confirmed swing compared with the previous one of the same side.
A larger Swing strength gives fewer, more significant swings (swing / external structure); a smaller one reacts faster (internal structure).
4. Fair value gaps (FVG)
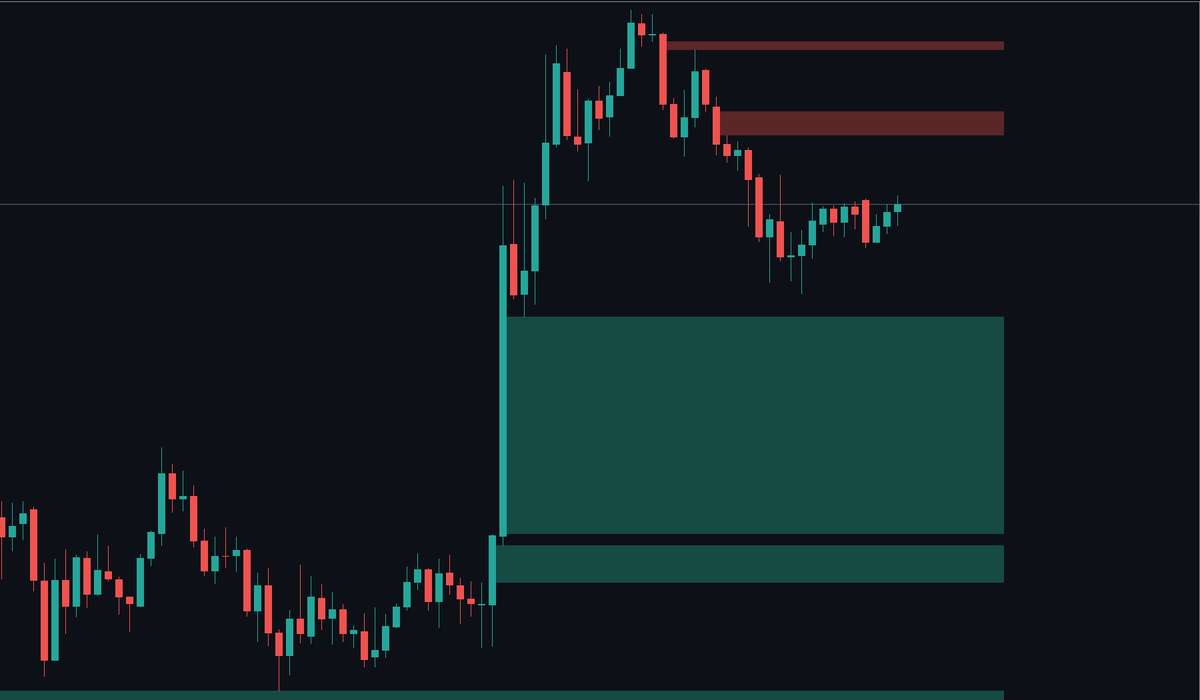
An FVG is a three-candle imbalance: the low of the third candle is above the high of the first (bullish) or the high of the third candle is below the low of the first (bearish). The box is drawn from the middle candle and covers the gap between the two wicks.
- Minimum gap size (default 0.2 × ATR 14): smaller gaps are ignored. Raise it to see only the larger imbalances.
- FVG is mitigated at: Full fill (default — price reaches the far edge of the gap), 50% fill (consequent encroachment) (price reaches the middle) or First touch (price reaches the near edge).
- Shrink to the unfilled part (default on): while price trades into the gap without mitigating it, the box shrinks to the part that is still open.
- Active FVGs per side (default 8): when a new FVG appears and the limit is exceeded, the oldest active FVG of that side is dropped.
Fills are evaluated on closed bars. A mitigated FVG is removed from the chart, or kept in the mitigated colour (section 8).
5. Higher timeframe FVGs
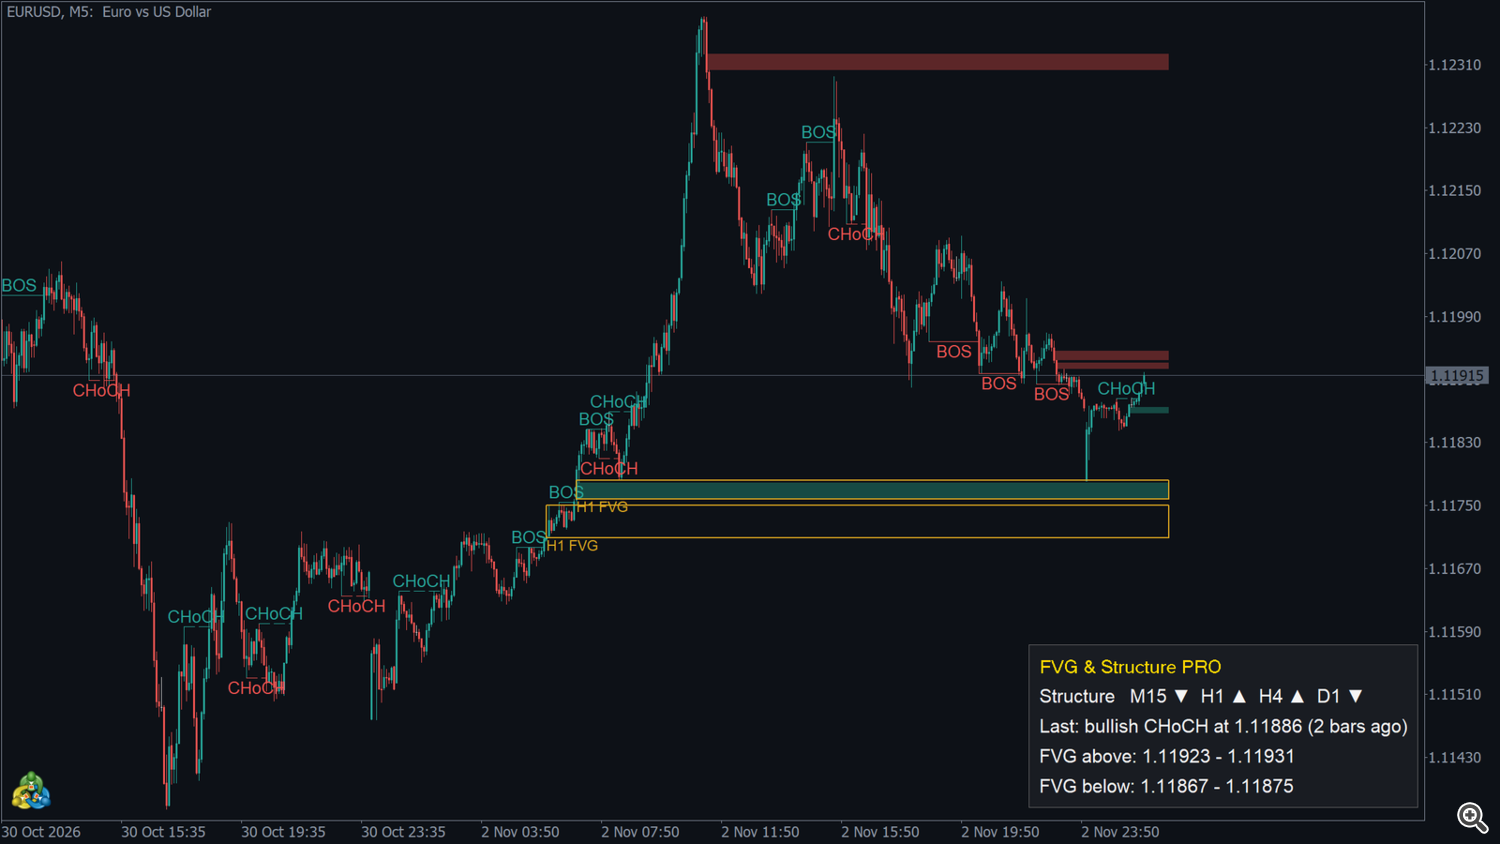
With Show higher timeframe FVGs on, the open FVGs of the selected Higher timeframe (default H1) are drawn as outlined boxes (default goldenrod) with a label such as H1 FVG, over the FVGs of the chart timeframe.
- They use the same minimum size and mitigation rule as the chart FVGs (without shrinking).
- Only closed higher-timeframe bars create gaps; the forming higher-timeframe bar can already fill one.
- Active HTF FVGs per side (default 4) limits the number shown.
- They are drawn only when the selected timeframe is higher than the chart timeframe (for example H1 gaps on an M5 or M15 chart).
- The killzone filter does not apply to them. They are chart objects only (no buffers).
6. Killzone filter (ICT)
With Only FVGs formed inside killzones on, the chart-timeframe FVGs are kept only when their middle candle opened inside one of the selected killzones, in New York time with daylight saving handled automatically:
| Killzone | New York time | Default |
|---|---|---|
| London KZ | 02:00-05:00 | on |
| NY AM KZ | 07:00-10:00 | on |
| NY PM KZ | 13:30-16:00 | off |
The filter is meant for intraday charts (M1 to H1). It also applies to the FVG buffers and the FVG alerts.
Broker time zone — needed to convert the server time of the chart to New York time:
- Auto (live) / GMT+2/+3 in tester (default): the offset is measured from the terminal clock. Brokers on GMT+2 / GMT+3 (New York close) are followed through the history with US daylight saving. In the Strategy Tester GMT+2 / GMT+3 is assumed.
- GMT+2 / GMT+3 (New York close brokers): forces that rule.
- Fixed GMT offset: uses Broker GMT offset (default 2) all year. Use it in the tester for a broker that is not on GMT+2 / GMT+3.
7. Order blocks
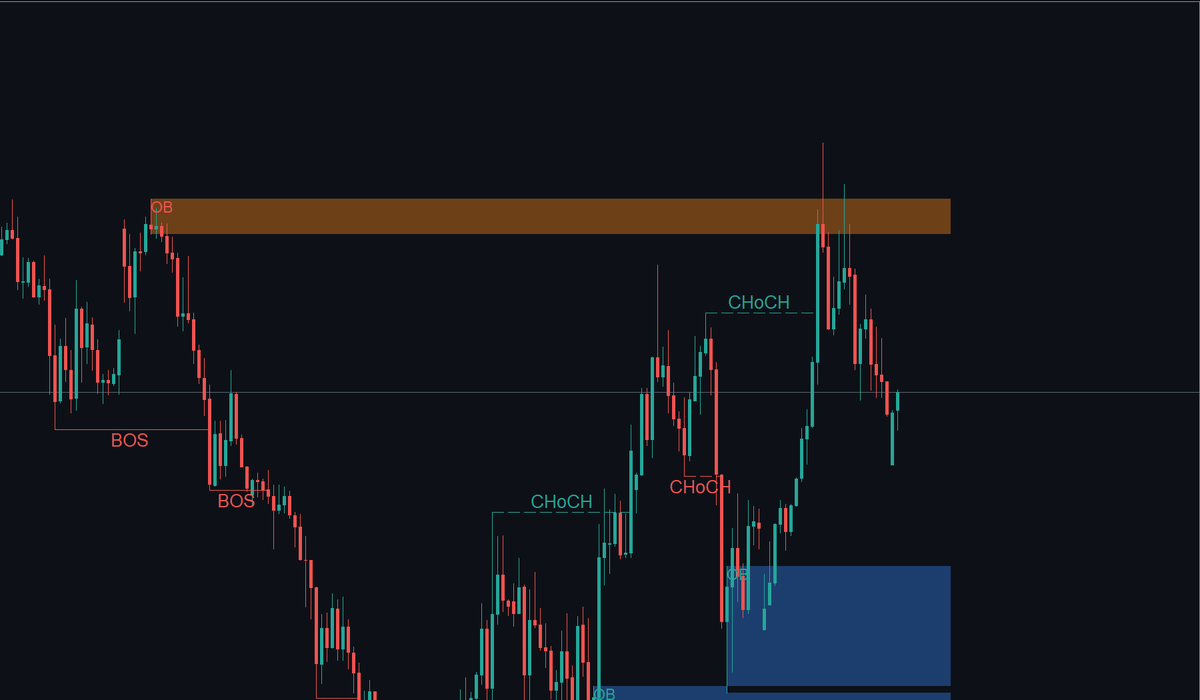
Each structure break (BOS or CHoCH) creates an order block on the candle at the origin of the move that produced the break. The box covers the full range (high to low) of that candle and carries the label OB.
- An order block is broken when a bar closes through it (below a bullish OB, above a bearish OB).
- Active order blocks per side (default 3): the oldest one is dropped when the limit is exceeded.
- With Show order blocks off, order blocks are still calculated for the buffers (section 14) but not drawn and no OB alerts are sent.
8. Mitigated zones
By default (Hide mitigated FVGs and order blocks = true) a mitigated FVG or a broken order block disappears from the chart. Turn the input off to keep them as history: the box returns to its original size, ends at the bar that mitigated it and is painted in the Mitigated zone color (default dark grey); the OB label turns grey. The tooltip then ends with "(mitigated)".
9. Liquidity: equal highs and lows
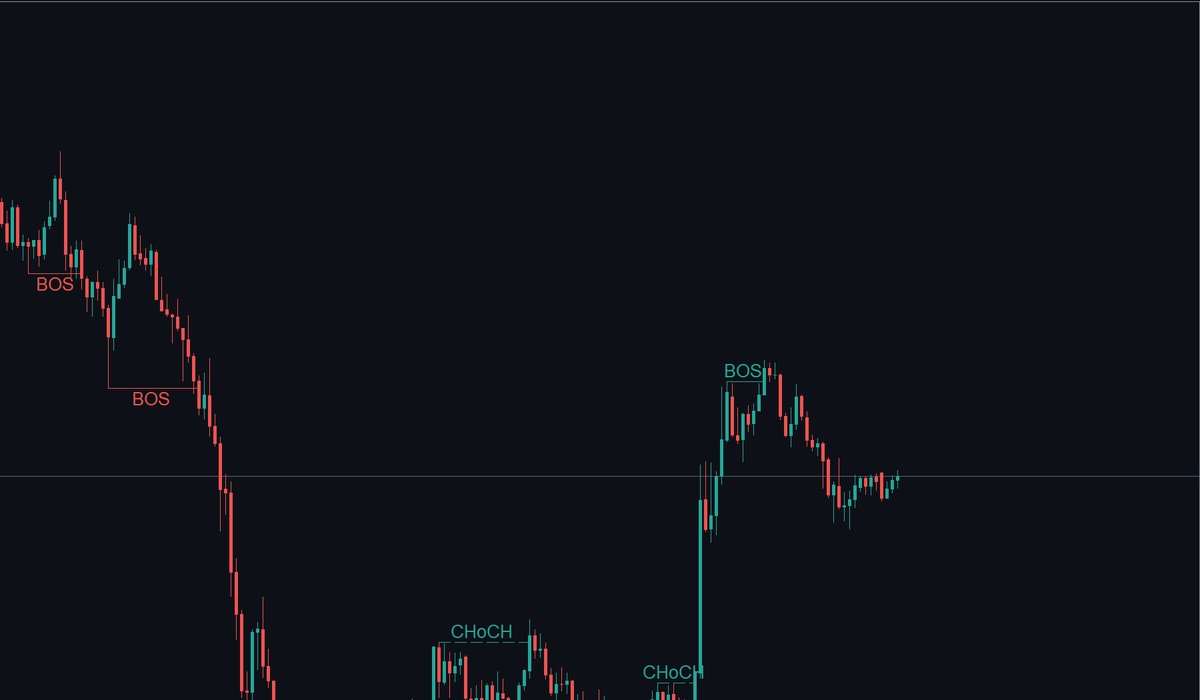
When two consecutive swing highs (or lows) are within the Equal tolerance (default 0.1 × ATR 14) of each other, a gold dotted line is drawn from the first swing to the second and labelled EQH (equal highs) or EQL (equal lows). These levels often hold resting liquidity (stop orders).
- The line extends to the right while the level is intact.
- When a later bar trades beyond the level (wick or close) it is swept: the line stops at that bar and turns grey.
- Levels kept on chart (default 6): older levels are removed.
Raise the tolerance to find more levels; lower it for stricter matches.
10. Premium / discount
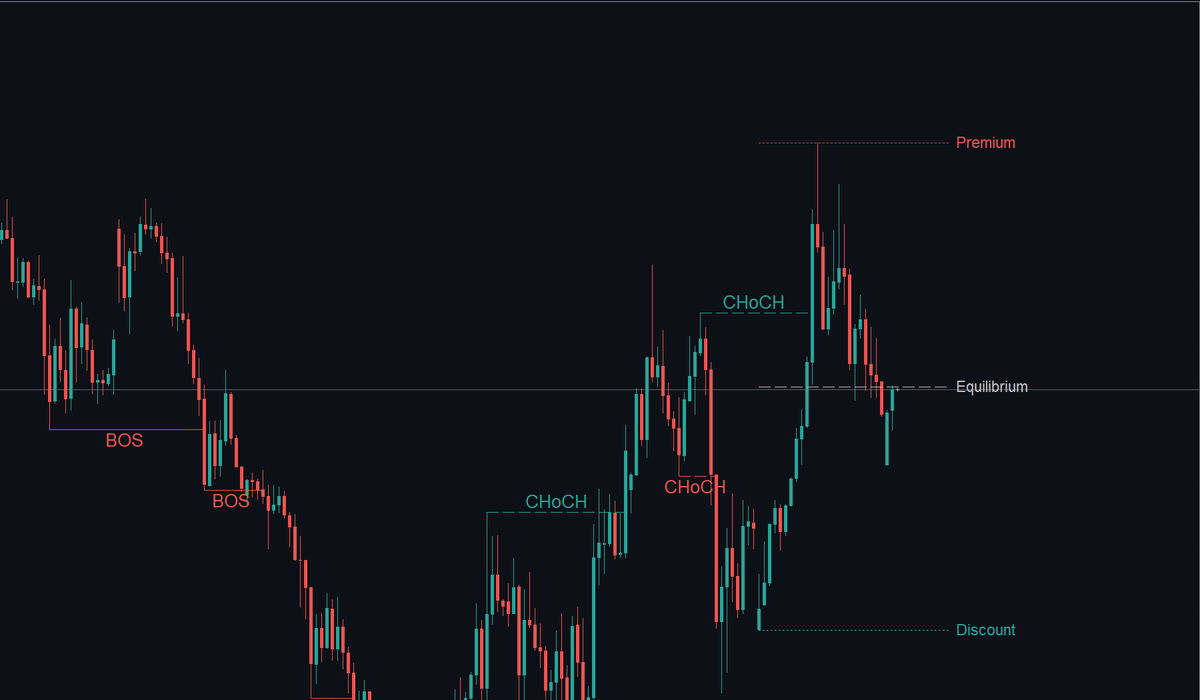
With Equilibrium of the current swing range on, three lines are drawn from the older of the two latest swings to the right edge of the zones:
- Premium (red dotted) at the last swing high;
- Equilibrium (silver dashed) at the midpoint;
- Discount (teal dotted) at the last swing low.
Price above the equilibrium is in the premium half of the range, below it in the discount half. The lines move with each new confirmed swing.
11. The panel
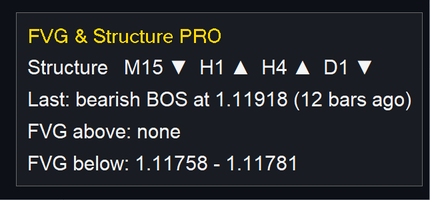
The panel (default lower right corner, input Panel corner) shows:
| Line | Content |
|---|---|
| Title | FVG & Structure PRO |
| Structure | Structure trend of M15, H1, H4 and D1: ▲ bullish, ▼ bearish, – no break yet or history still loading. The timeframe of the chart uses the chart's own result; the others are calculated with the same swing strength and refreshed when they open a new bar. |
| Last | Last structure break of the chart: direction, BOS or CHoCH, price of the broken swing and how many bars ago. Before the first break: "no structure break yet". |
| FVG above | Nearest open FVG entirely above the current price (bottom - top), or "none". |
| FVG below | Nearest open FVG entirely below the current price, or "none". |
An FVG that contains the current price is not listed as above or below. With Show FVGs off the two FVG lines show "none". The panel is refreshed on every new bar and is always kept on top of the zones.
12. Alerts
| Input | Fires when | Message example |
|---|---|---|
| BOS / CHoCH | a bar closes beyond a swing (sent at the open of the next bar) | Bullish CHoCH above 1.08520 |
| New FVG | a new FVG is confirmed on a closed bar (only with Show FVGs on) | New bearish FVG 1.08310 - 1.08365 |
| Price enters an FVG | the forming bar trades into an open FVG — once per FVG (only with Show FVGs on) | Price in bullish FVG 1.08210 - 1.08260 |
| Price enters an order block | the forming bar trades into an active order block — once per OB (only with Show order blocks on) | Price in bearish order block 1.08700 - 1.08780 |
Each alert can be Off, Popup, Sound, Smartphone notification, Popup + Sound, Notification + Sound, Popup + Notification or Popup + Sound + Notification. All alerts are off by default. Sound selects one of the terminal sounds (default "alert"); Also send e-mail adds an e-mail to every enabled alert.
The text includes the product, symbol and timeframe, e.g. FVG & Structure PRO: EURUSD | M15 | Bullish BOS above 1.08520 . Each alert type fires at most once per bar. When the indicator is attached, zones already touched by the current bar are marked silently, so there is no burst of old alerts. Push notifications need the MetaQuotes ID in Tools → Options → Notifications; e-mail needs the e-mail settings of the terminal. The Strategy Tester shows no pop-ups, sounds or notifications.
13. Inputs
MARKET STRUCTURE
| Input | Default | Description |
|---|---|---|
| Swing strength (bars on each side) | 5 | Bars on each side of a swing high / low (1-50). |
| BOS / CHoCH lines | true | Draws the structure breaks. |
| HH / HL / LH / LL labels | false | Labels each swing. |
| Structure breaks kept on chart | 20 | Older breaks are removed. |
| Bullish color | 38,166,154 (teal) | Bullish breaks, labels, OB label, Discount line. |
| Bearish color | 239,83,80 (red) | Bearish breaks, labels, OB label, Premium line. |
FAIR VALUE GAPS
| Input | Default | Description |
|---|---|---|
| Show FVGs | true | Draws the FVGs (they are tracked for the buffers either way). |
| Minimum gap size (x ATR 14) | 0.2 | Smaller gaps are ignored. |
| FVG is mitigated at | Full fill | Full fill / 50% fill (consequent encroachment) / First touch. |
| Shrink to the unfilled part | true | The box shrinks while it is being filled. |
| Active FVGs per side | 8 | Maximum open FVGs per side. |
| Bullish FVG color | 22,74,68 | Fill of bullish FVGs. |
| Bearish FVG color | 92,38,40 | Fill of bearish FVGs. |
HIGHER TIMEFRAME FVGs
| Input | Default | Description |
|---|---|---|
| Show higher timeframe FVGs | false | Draws the FVGs of the timeframe below. |
| Higher timeframe | 1 Hour | Must be higher than the chart timeframe. |
| Active HTF FVGs per side | 4 | Maximum HTF FVGs per side. |
| HTF FVG outline color | Goldenrod | Outline and label colour. |
KILLZONE FILTER (ICT)
| Input | Default | Description |
|---|---|---|
| Only FVGs formed inside killzones | false | Keeps only FVGs whose middle candle is inside a selected killzone. |
| London KZ (NY 02:00-05:00) | true | |
| NY AM KZ (NY 07:00-10:00) | true | |
| NY PM KZ (NY 13:30-16:00) | false | |
| Broker time zone | Auto (live) / GMT+2/+3 in tester | Also: GMT+2 / GMT+3 (New York close brokers), Fixed GMT offset. |
| Broker GMT offset (fixed mode and tester) | 2 | Hours, used by Fixed GMT offset. |
ORDER BLOCKS
| Input | Default | Description |
|---|---|---|
| Show order blocks | true | Draws the order blocks (tracked for the buffers either way). |
| Active order blocks per side | 3 | Maximum active OBs per side. |
| Bullish OB color | 28,62,110 | Fill of bullish OBs. |
| Bearish OB color | 110,64,24 | Fill of bearish OBs. |
MITIGATED ZONES
| Input | Default | Description |
|---|---|---|
| Hide mitigated FVGs and order blocks | true | false keeps them on the chart in the colour below. |
| Mitigated zone color (when shown) | 44,46,52 | Fill of mitigated zones. |
LIQUIDITY
| Input | Default | Description |
|---|---|---|
| Equal highs / lows | true | Draws EQH / EQL levels. |
| Equal tolerance (x ATR 14) | 0.1 | Maximum distance between two swings to count as equal. |
| Levels kept on chart | 6 | Older levels are removed. |
| Equal highs / lows color | Gold | Colour of intact levels (swept levels are grey). |
PREMIUM / DISCOUNT
| Input | Default | Description |
|---|---|---|
| Equilibrium of the current swing range | false | Draws Premium / Equilibrium / Discount. |
HISTORY AND PANEL
| Input | Default | Description |
|---|---|---|
| Bars analysed | 1500 | History processed when the indicator loads (minimum 100). |
| Active zones extend right (bars) | 10 | How far active zones and levels extend past the current bar. |
| Show panel | true | Shows the text panel. |
| Panel corner | Right lower corner | Corner of the chart for the panel. |
ALERTS
| Input | Default | Description |
|---|---|---|
| BOS / CHoCH | Off | Alert mode for structure breaks. |
| New FVG | Off | Alert mode for new FVGs. |
| Price enters an FVG | Off | Alert mode for FVG touches. |
| Price enters an order block | Off | Alert mode for OB touches. |
| Sound | alert | Terminal sound used by the sound modes. |
| Also send e-mail | false | Sends an e-mail with every enabled alert. |
14. Buffers for Expert Advisors / dashboards
The indicator exposes 7 buffers that can be read with iCustom + CopyBuffer . All values are final on closed bars: read shift 1 for the last final value.
| Buffer | Name | Values | When | Empty |
|---|---|---|---|---|
| 0 | Structure trend | +1 bullish, -1 bearish; 0 before the first break | every bar; the forming bar repeats the last closed value | 0 |
| 1 | Structure event | on the bar whose close broke the swing: +1 bullish BOS, +2 bullish CHoCH, -1 bearish BOS, -2 bearish CHoCH | closed bars only; the forming bar is always 0 | 0 |
| 2 | Nearest open bullish FVG - top (2.00) | price; of the open bullish FVGs, the one with the highest top (unfilled part when Shrink is on) | every bar, at its close; the forming bar repeats the last closed value | EMPTY_VALUE |
| 3 | Nearest open bullish FVG - bottom (2.00) | price, same FVG as buffer 2 | as buffer 2 | EMPTY_VALUE |
| 4 | Nearest open bearish FVG - top (2.00) | price; of the open bearish FVGs, the one with the lowest bottom | as buffer 2 | EMPTY_VALUE |
| 5 | Nearest open bearish FVG - bottom (2.00) | price, same FVG as buffer 4 | as buffer 2 | EMPTY_VALUE |
| 6 | Zone event (2.00) | +1 / -1 new bullish / bearish FVG, +2 / -2 FVG mitigated, +3 / -3 new order block, +4 / -4 order block broken. Several on one bar: the first in this order is kept | closed bars only; the forming bar is always 0 | 0 |
"Open" follows the inputs FVG is mitigated at, Minimum gap size, Active FVGs per side and the killzone filter. FVGs and order blocks are tracked even with Show FVGs / Show order blocks off. Equal highs / lows and higher timeframe FVGs are chart objects only.
Loading. The Market version is installed in MQL5\Indicators\Market\ ; check the exact file name in the Navigator. With no parameters after the name the default inputs are used. To change inputs, pass them in the order of section 13. Every input group heading is a parameter too: pass an empty string "" in its place, otherwise every following value shifts. Inputs left out at the end keep their defaults.
```mql5 // "" = group MARKET STRUCTURE, 5 = swing strength, false = no BOS / CHoCH lines int h = iCustom(_Symbol, PERIOD_H1, "Market\FVG and Structure PRO", "", 5, false);
double trend[1], bt[1], bb[1], ze[1]; if (BarsCalculated(h) > 0) { if (CopyBuffer(h, 0, 1, 1, trend) == 1) Print("structure ", (int)trend[0]); // +1 / -1 if (CopyBuffer(h, 2, 1, 1, bt) == 1 && CopyBuffer(h, 3, 1, 1, bb) == 1 && bt[0] != EMPTY_VALUE) Print("nearest bullish FVG ", bb[0], " - ", bt[0]); if (CopyBuffer(h, 6, 1, 1, ze) == 1 && ze[0] != 0.0) Print("zone event ", (int)ze[0]); } ```
Notes: an indicator created by iCustom draws its panel and objects on the chart of the calling program — turn off the drawing inputs and the panel for a clean dashboard. Wait until BarsCalculated(h) > 0 before the first read (history may still be loading). For a multi-symbol dashboard 1000 Bars analysed are enough.
15. Tips
- Intraday: M5 or M15 with Show higher timeframe FVGs on and Higher timeframe = H1 shows the chart gaps inside the larger ones.
- Less clutter: raise Minimum gap size, lower Active FVGs per side / Active order blocks per side, or turn on the killzone filter.
- Structure depth:Swing strength 3 follows internal structure; 8-10 follows only the major swings. The panel bias of the other timeframes uses the same value.
- History of reactions: turn Hide mitigated off to study how price reacted to past zones.
- One instance per chart: two copies on the same chart share their object names and erase each other's drawings. To compare settings, open a second chart of the same symbol.
16. Questions and troubleshooting
- Does it repaint? No. Swings, breaks, FVGs and order blocks are created on closed bars and never moved afterwards. A swing is drawn Swing strength bars after its bar by definition (it needs the bars on its right).
- The panel shows "–" for a timeframe. That timeframe has no structure break yet in its recent history, or its history is still downloading; it updates on its next bar.
- No HTF FVGs appear. The chart timeframe must be lower than Higher timeframe, and there may be no open gaps of that size at the moment.
- The killzone filter removes every FVG. Check Broker time zone. On charts of H4 and above few candles open inside a killzone.
- No alerts. All alerts are Off by default. FVG and OB alerts also need their drawing on. Touch alerts fire once per zone.
- An FVG stays open although price was inside it. With Full fill the gap closes only when price reaches its far edge; with Shrink on the box shows the part still open.
- Strategy Tester. Works in visual and non-visual mode; pop-ups, sounds and notifications are not sent in the tester.
Support: send a private message on MQL5 to the author.




