Balance can rise while the account loses: 5 checks before you buy an EA

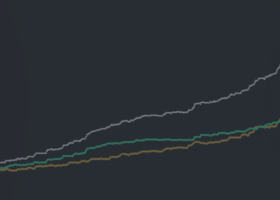
An EA's page shows a big percentage and a curve that climbs from left to right. It may all be true. The question before you pay is a different one: how much of it can you check yourself?
More than the page shows. Five questions do the work, and they work on any EA, ours included. Next to each one is the rule we follow when we publish our own numbers, so you can see what a checkable answer looks like.
The 5 checks, and the rule we follow for each
| Ask the number | Why it matters | Our rule |
|---|---|---|
| 1. Is it a test or a live account? | A test shows what the rule did on past prices. An account shows how it executes. A figure that blends the two answers neither question. | Each number is labeled: real-tick test in the Strategy Tester, or account in operation, demo or real. Never mixed. |
| 2. Was it read from the broker or typed in? | A screenshot or a figure in a description is a picture of a result. A figure read from the broker can be checked. | Read by a reader in the account's own MetaTrader and published automatically. Nothing typed by hand. |
| 3. Balance or equity? | The balance moves only when a trade closes, so it can climb smoothly while the account holds positions at a loss. | Equity curves, with every deposit and withdrawal marked. |
| 4. Is every trade there? | A history that starts on a convenient date, or skips trades, tells only part of the story. | Trades numbered in order; cancelled ones keep their number. Full history, first trade to last. |
| 5. Can the past change? | If old figures can be edited, today's curve may not be the one you saw last month. | Nothing edited or deleted. Corrections go in as new, dated entries; the original stays. |
Why a smooth balance curve proves little
The balance is the account's value after closed trades. Equity is its value right now, open positions included. Any EA that keeps positions open for a while can draw a clean balance line while equity dips underneath it. The balance only shows the drop on the day the losing position closes.
So when you look at a curve, ask which one it is. Then look for the deposits: money added to the account looks like a step up on the curve unless it is marked. On our curves it is always marked, so a deposit never passes for profit.
How to check a number yourself
If it comes from a test, you don't need to trust it: you can rerun it. Paid EAs on the Market come with a free demo that runs in your Strategy Tester. Set the same period, deposit, leverage and modelling the page used, and your result should land close to the page's. Close, not identical: each broker records its own ticks, spread and commission.
If it comes from an account, look for a history read straight from the broker, in equity, with every trade from the first to the last.
Why our public scoreboard runs 24 hours late
Our public scoreboard shows trades that have already closed, 24 hours later. Real time is reserved for those who copy the signal: the delay protects the people copying.
Check ours the same way
Every number on our three EAs' pages says where it comes from. Start with one from each, from the test with real ticks in the Strategy Tester, and rerun 2025 with the free demo and the deposit on the page:
- Pitbull Gold on the Market: +478% in 2025 on the Balanced profile, and 21 of 21 months in profit in 2025 and 2026. Deposit: 10,000 USD.
- Collie Gold on the Market: +586% in 2025 on the Moderate profile. Deposit: 1,000 USD.
- Beagle Gold on the Market: +185% in 2025 on the Moderate profile, and 21 of 22 months in profit in 2025 and 2026. Deposit: 10,000 USD.
The year-by-year table on each page restarts every year with the same deposit, so any single year reruns on its own.
The five rules are written out in full on our site, with how each number there is labeled: the 5 rules behind every number we publish. Found a page of ours that breaks one of them? Tell us in the MQL5 chat.
Lucky Dogs Trading Systems