

ARRAKIS IV 3.00 was reviewed across several market periods to examine profitability, drawdown and sensitivity to the sequence of trading results. This article presents the historical portfolio test, the separate IS, validation and temporal OOS windows, and two Monte Carlo experiments. The purpose is to show how the portfolio behaved under the tested conditions, including the periods in which risk was higher.
Four FX pairs. Four standalone strategies. Defined take profit and stop loss. No DCA. No martingale.
ARRAKIS IV 3.00 introduces four completely new strategies compared with version 2.0, trading AUDUSD, EURGBP, USDCHF and USDJPY from one MetaTrader 5 chart. Each enabled pair can hold one ARRAKIS position per EA instance. Positions are managed individually, without averaging into losses or increasing position size after a losing trade. The portfolio accommodates intraday and swing holding periods; it is not a scalping system.
Test configuration
The historical tests use Darwinex-Live data in MetaTrader 5’s “Every tick based on real ticks” mode, USD 1,000 initial capital, fixed 0.10 lot per pair and 1:500 leverage. All four strategies are enabled. Optional filters, randomisation and account-level equity protection are disabled for this baseline. Results include the recorded commissions, swaps and fees. The delivered EA’s default lot size is 0.01; the research figures below use the 0.10-lot research setup.
2019 stress, 2020–2022 IS, 2023–2024 validation and 2025–2026 temporal OOS
- 2019 — historical stress window: a separate earlier market period.
- 2020–2022 — IS reference window: the reference development-period comparison.
- 2023–2024 — validation window: an intermediate check using the same settings.
- 2025–2026 — temporal OOS window: a later-period check ending on 12 October 2026, exclusive. The 2026 results cover a partial year.
No new parameter optimisation was performed in these tests. The IS label identifies the reference comparison window; these replays do not establish that original strategy development used only 2020–2022. The original selection record shows that 2025–2026 had already been examined during strategy selection. Consequently, the later-period result is a temporal OOS review rather than an untouched independent holdout.
The continuous 2019–2026 portfolio
The continuous run produced USD 11,462.84 net profit, equivalent to +1,146.28% of the initial deposit, and an ending balance of USD 12,462.84. It recorded 994 closed positions and a native profit factor of 1.45. Maximum equity drawdown in money was USD 777.41, corresponding to 18.22% at that event. The largest percentage equity drawdown was a different event: 39.86%, corresponding to USD 687.94.
MT5 reports the largest cash decline and the largest percentage decline separately. Drawdown in USD is the fall from a preceding equity peak to a later trough; drawdown percentage divides that decline by its preceding equity peak, not by the initial deposit or final balance. The two maxima can occur at different times. Daily chart samples can miss intraday peaks and troughs; the native tester’s tick-level equity statistics are the reference.
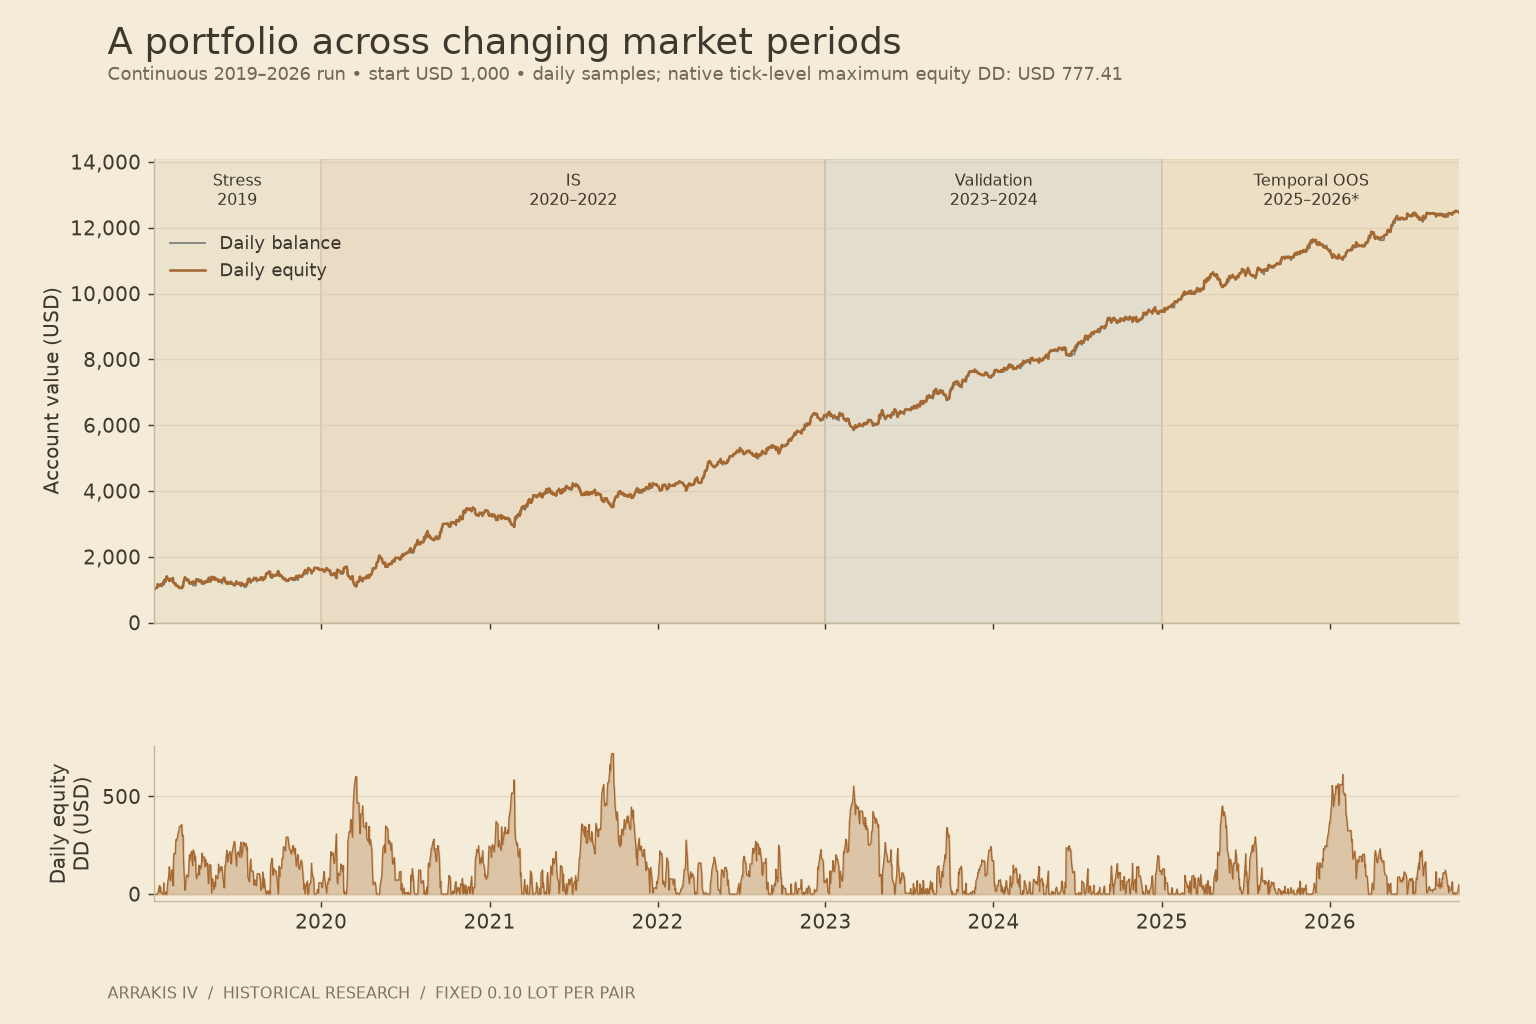
Continuous portfolio equity and balance with period shading; lower panel shows daily sampled equity drawdown in USD.
Fresh-capital IS, validation and OOS results
Each of the following native tests starts again with USD 1,000, using the same fixed 0.10 lot per pair. This reveals the impact of the entry period without carrying forward the capital accumulated in earlier years.
| Period | Net profit | Return | PF | Trades | Max equity DD | Max relative equity DD |
|---|---|---|---|---|---|---|
| Stress | 2019 | USD 608.98 | +60.90% | 1.19 | 110 | USD 410.94 | 28.32% |
| IS | 2020–2022 | USD 4,596.24 | +459.62% | 1.44 | 394 | USD 777.41 | 56.71% |
| Validation | 2023–2024 | USD 3,000.96 | +300.10% | 1.45 | 271 | USD 592.52 | 49.90% |
| Temporal OOS | 2025–2026* | USD 3,070.05 | +307.01% | 1.61 | 208 | USD 635.29 | 21.18% |
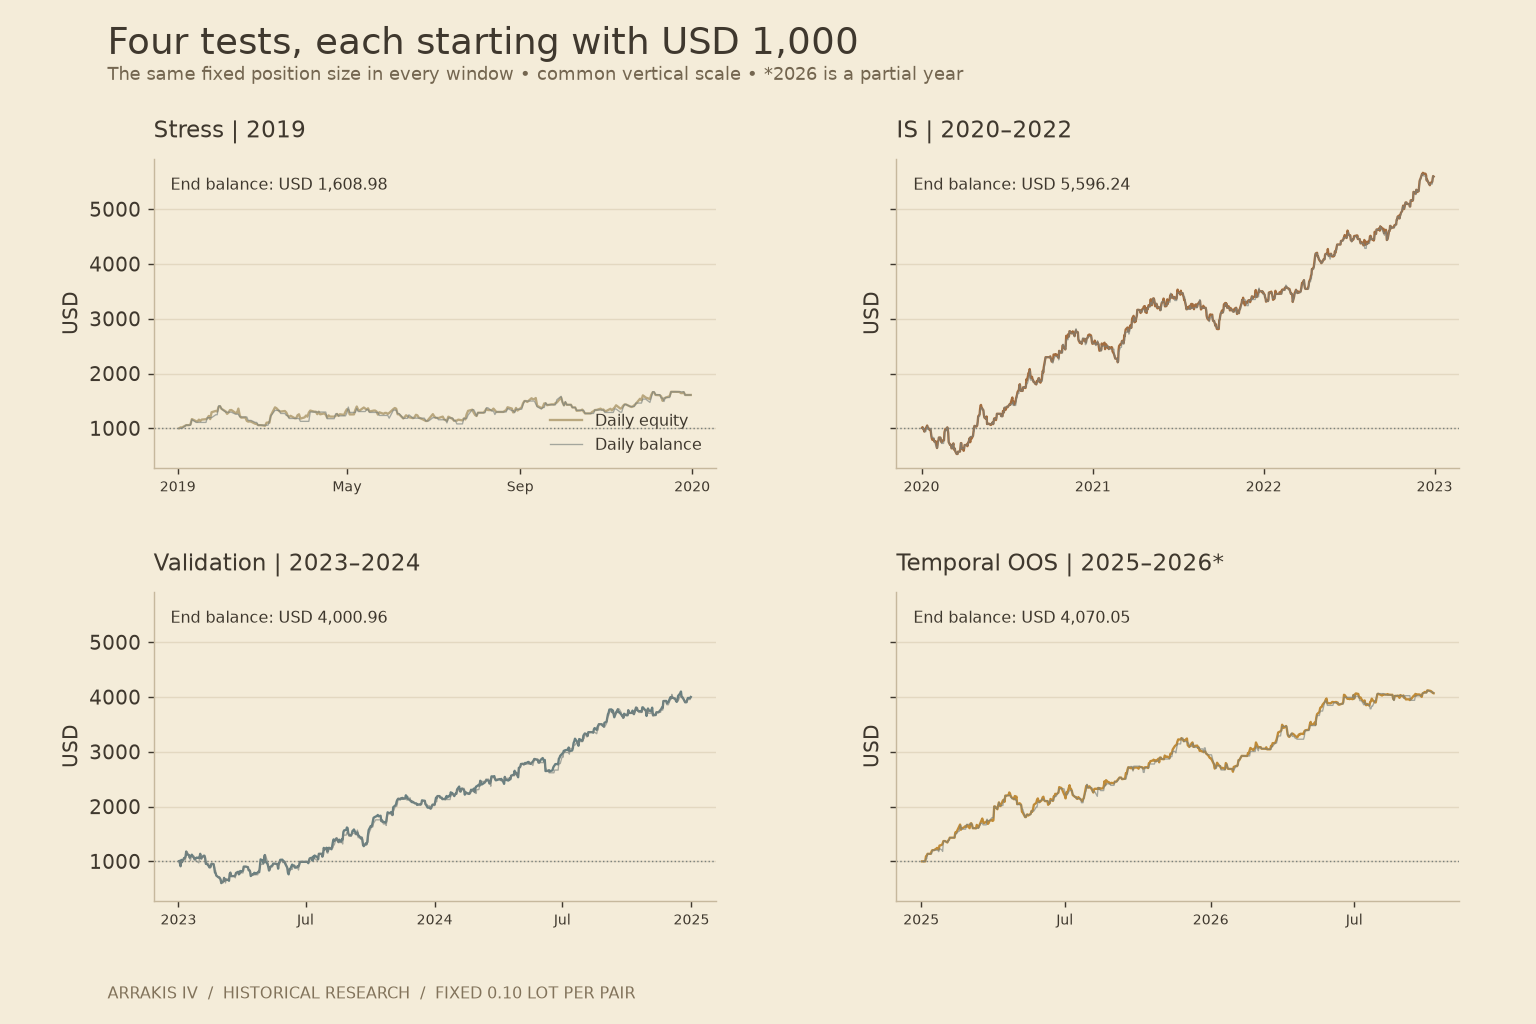
Four separate tests, each starting with USD 1,000. Daily equity and balance share a common vertical scale.
The IS and validation tests remained profitable, but their maximum relative equity drawdowns were 56.71% and 49.90%. The later-period test had a higher profit factor of 1.61 and a lower relative equity drawdown of 21.18%. These differences show that both return and risk depend on the market period and starting capital. The full-run percentage drawdown alone does not describe every fresh-capital experience.
The separate tests cover unequal durations, so their profit percentages are cumulative, not annualised. Their results should not be added together to reconstruct the continuous run: position histories, start conditions and end-of-test closures differ. Holding times also extend beyond a single session: the full-run median holding time was approximately 48.9 hours.
Monte Carlo method
Two Monte Carlo experiments were performed for each historical dataset, with 10,000 paths per experiment and random seed 20261012.
- Trade-order permutation: the net results of closed positions are shuffled. The total ending profit stays unchanged; the experiment measures how a different sequence of wins and losses changes balance drawdown.
- Five-business-day portfolio block bootstrap: blocks of daily portfolio balance changes are sampled with replacement using a circular series. Each simulated path has the original series length. This preserves short clusters of portfolio cash outcomes inside each sampled block, while allowing ending balance to vary.
The blocks contain the combined portfolio cash changes, retaining the contribution of the four pairs within each block. They do not imply that the four strategies are independent. Several pairs share currency exposure, and their positions may overlap.
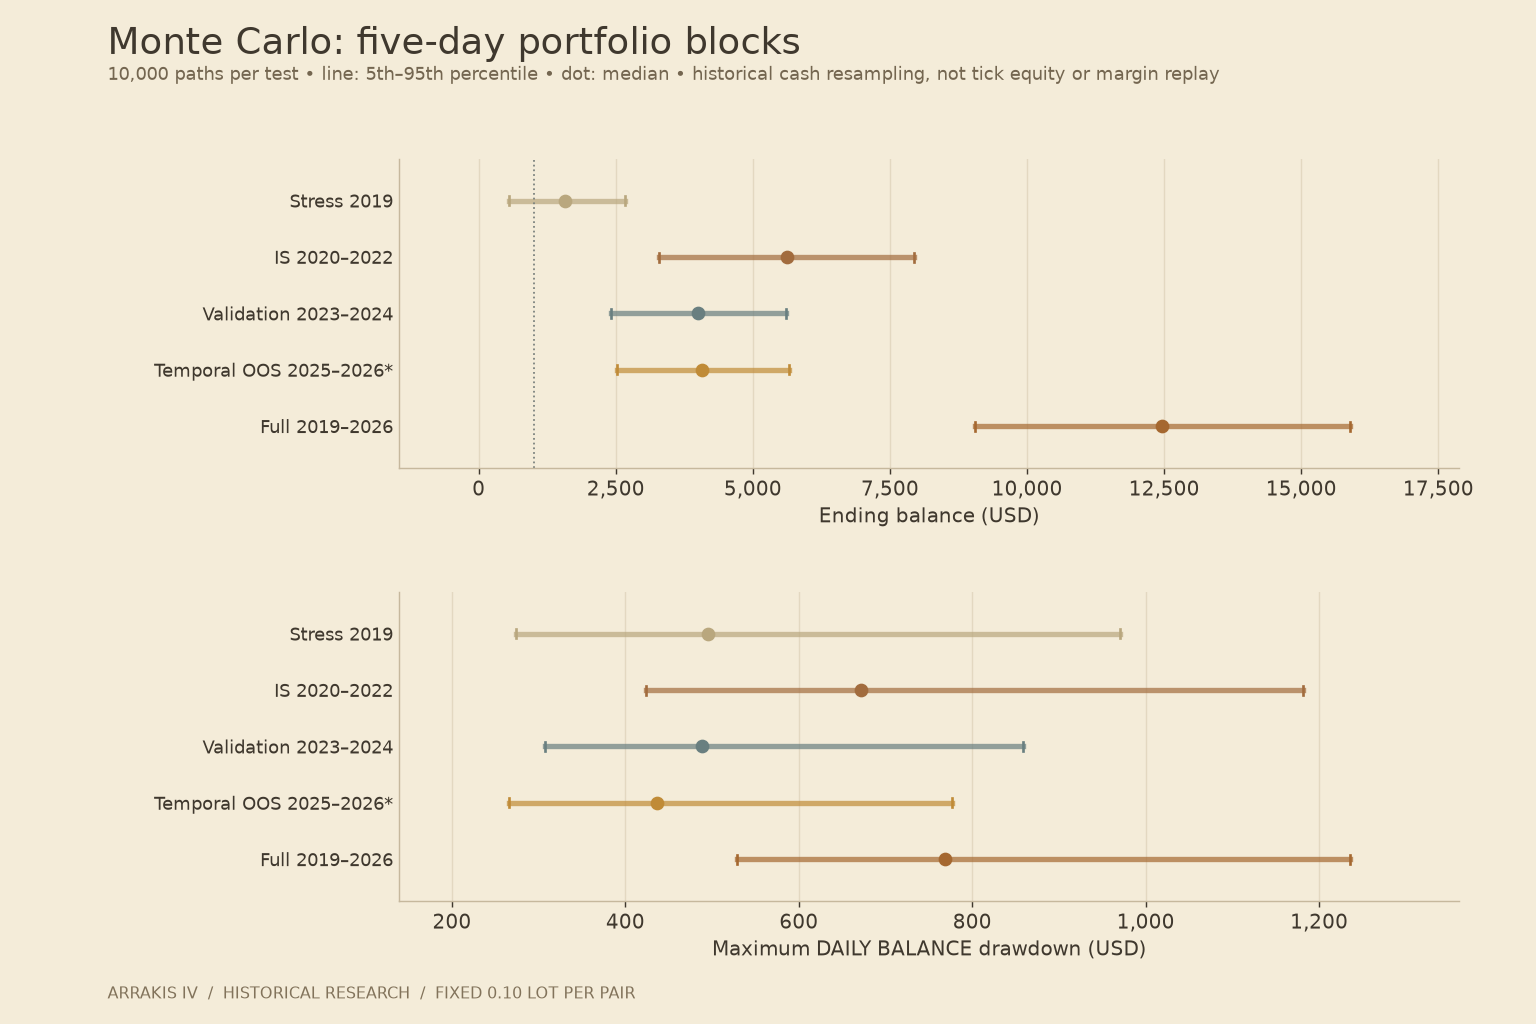
Five-day block bootstrap: simulated ending balance and maximum daily balance drawdown. Lines show the 5th–95th percentiles; dots show medians.
Block-bootstrap results
Ending-balance percentiles are shown in the order 5th / 50th / 95th. Drawdown figures in this table refer to simulated daily balance, not floating equity.
| Period | Ending balance P5 / P50 / P95 (USD) | Median DD (USD) | P95 DD (USD) | P95 DD (%) |
|---|---|---|---|---|
| Stress 2019 | 547.48 / 1,579.19 / 2,673.91 | 495.53 | 970.05 | 78.20% |
| IS 2020–2022 | 3,290.44 / 5,628.68 / 7,941.80 | 671.97 | 1,181.42 | 66.09% |
| Validation 2023–2024 | 2,412.69 / 4,007.97 / 5,606.35 | 488.41 | 858.45 | 53.78% |
| Temporal OOS 2025–2026* | 2,522.32 / 4,077.09 / 5,667.15 | 436.59 | 776.41 | 47.94% |
| Full 2019–2026 | 9,041.86 / 12,457.45 / 15,886.02 | 768.07 | 1,235.43 | 60.83% |
For the complete 2019–2026 dataset, the median simulated ending balance was USD 12,457.45, with a 5th–95th percentile range of USD 9,041.86–15,886.02. Median maximum daily balance drawdown was USD 768.07; its 95th-percentile monetary value was USD 1,235.43. The corresponding distribution of percentage drawdown had a median of 26.73% and a 95th percentile of 60.83%.
The earlier stress window is less resilient in the block model: 17.57% of its resampled paths ended below the initial deposit. This is an outcome of this historical resampling experiment, not an estimated probability of future trading losses.
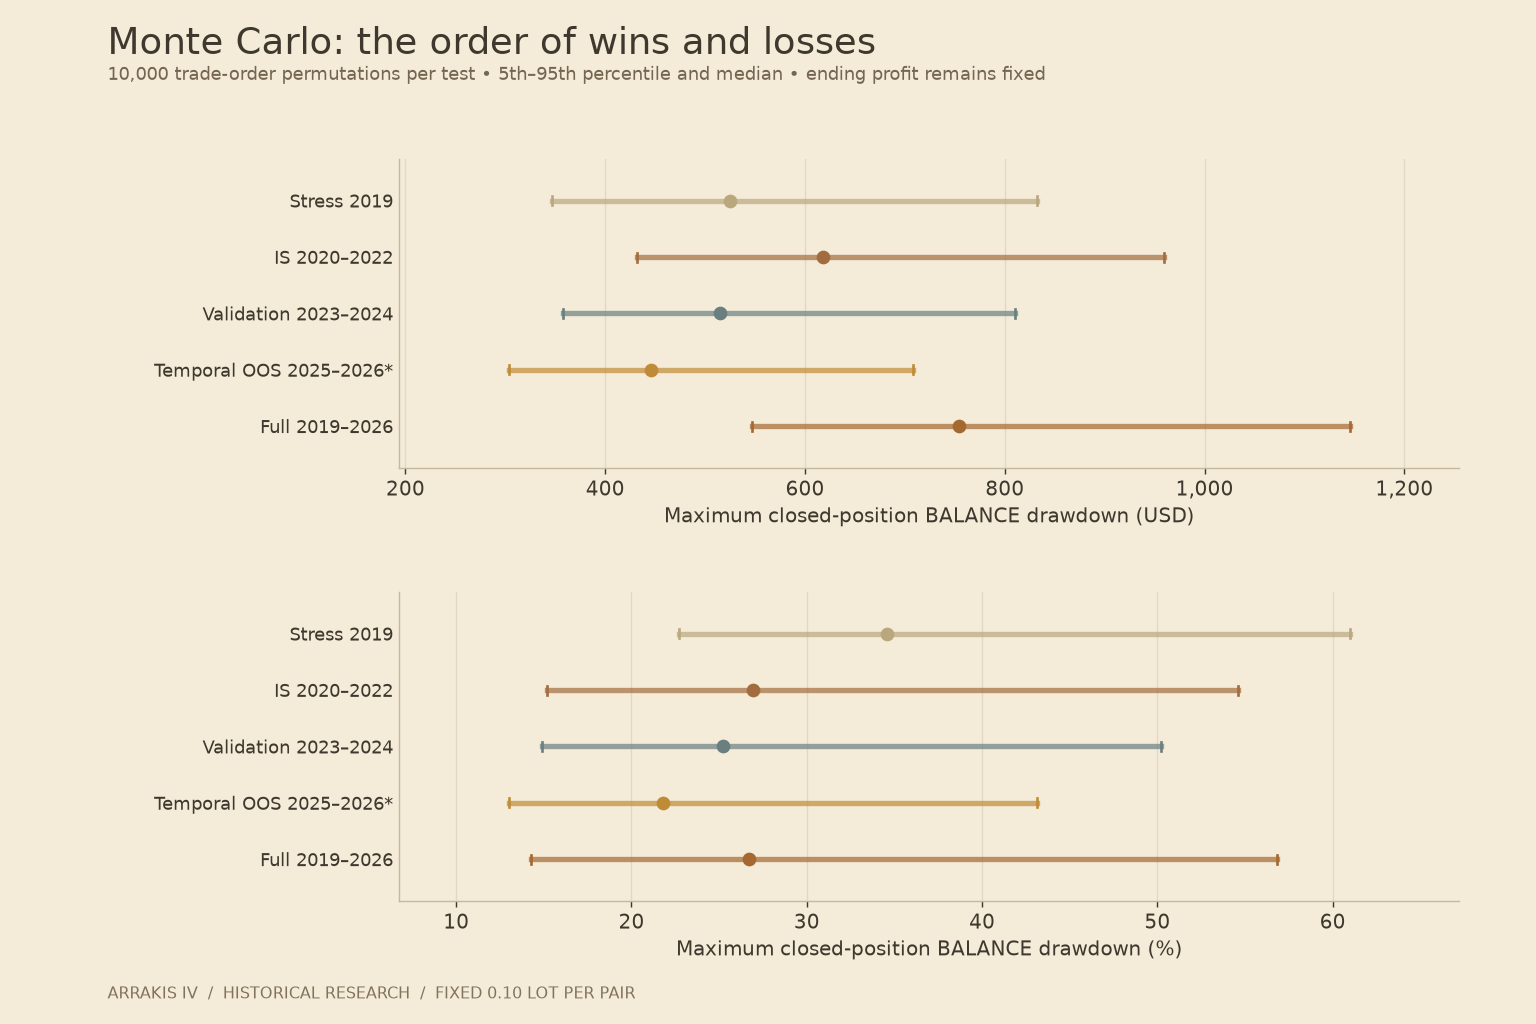
Trade-order permutations: monetary and percentage balance drawdown ranges. Final profit is fixed by construction.
Reading the Monte Carlo results
The Monte Carlo results show sensitivity to the order and clustering of historical cash outcomes. They do not regenerate prices, trading signals, floating positions, margin eligibility, rejected orders or broker stopout. Their percentile bands are empirical summaries under the chosen model, not forecasts or guaranteed ranges. They cannot remove earlier selection exposure to the later-period data.
Data and release notes
The deal exports were reconciled to the native tester’s net profit and closed-position counts. The journals report some minutes without real ticks, so real-tick mode should not be read as a claim of perfect tick coverage. Test cutoffs include the tester’s end-of-test closures.
These figures belong to the completed research builds. The latest compatibility update repairs history initialisation and checks broker sessions before new entries. It has separate local execution checks; the full real-tick research periods have not been repeated on that exact updated EX5. The statistics above therefore describe the tested research builds.
The next observation
The historical review recorded positive results in each tested window, alongside substantial drawdowns in the fresh-capital IS and validation tests. Monte Carlo resampling showed that the clustering of historical losses can materially change the balance path. A new forward period with settings frozen would provide the next independent observation. Historical results and these simulations do not guarantee future performance.


