Don't trust my screenshots. Test Twin Ignition Gold yourself in 5 minutes

Backtest screenshots are easy to make look good. You pick the dates, you pick the broker, you crop the ugly part. That is why the most useful button on the Twin Ignition Gold page is not "Buy". It is "Free Demo".
Here is the exact setup I use, so you can check every number yourself on your own broker's data, including the bad ones.
Step 1. Get the demo
Open the product page and click "Free Demo". MetaTrader 5 opens and downloads it. You will find it in the Navigator under Expert Advisors > Market. The demo runs only in the Strategy Tester, which is all you need here.
Step 2. Set up the tester
Press Ctrl+R and fill in the fields like this:
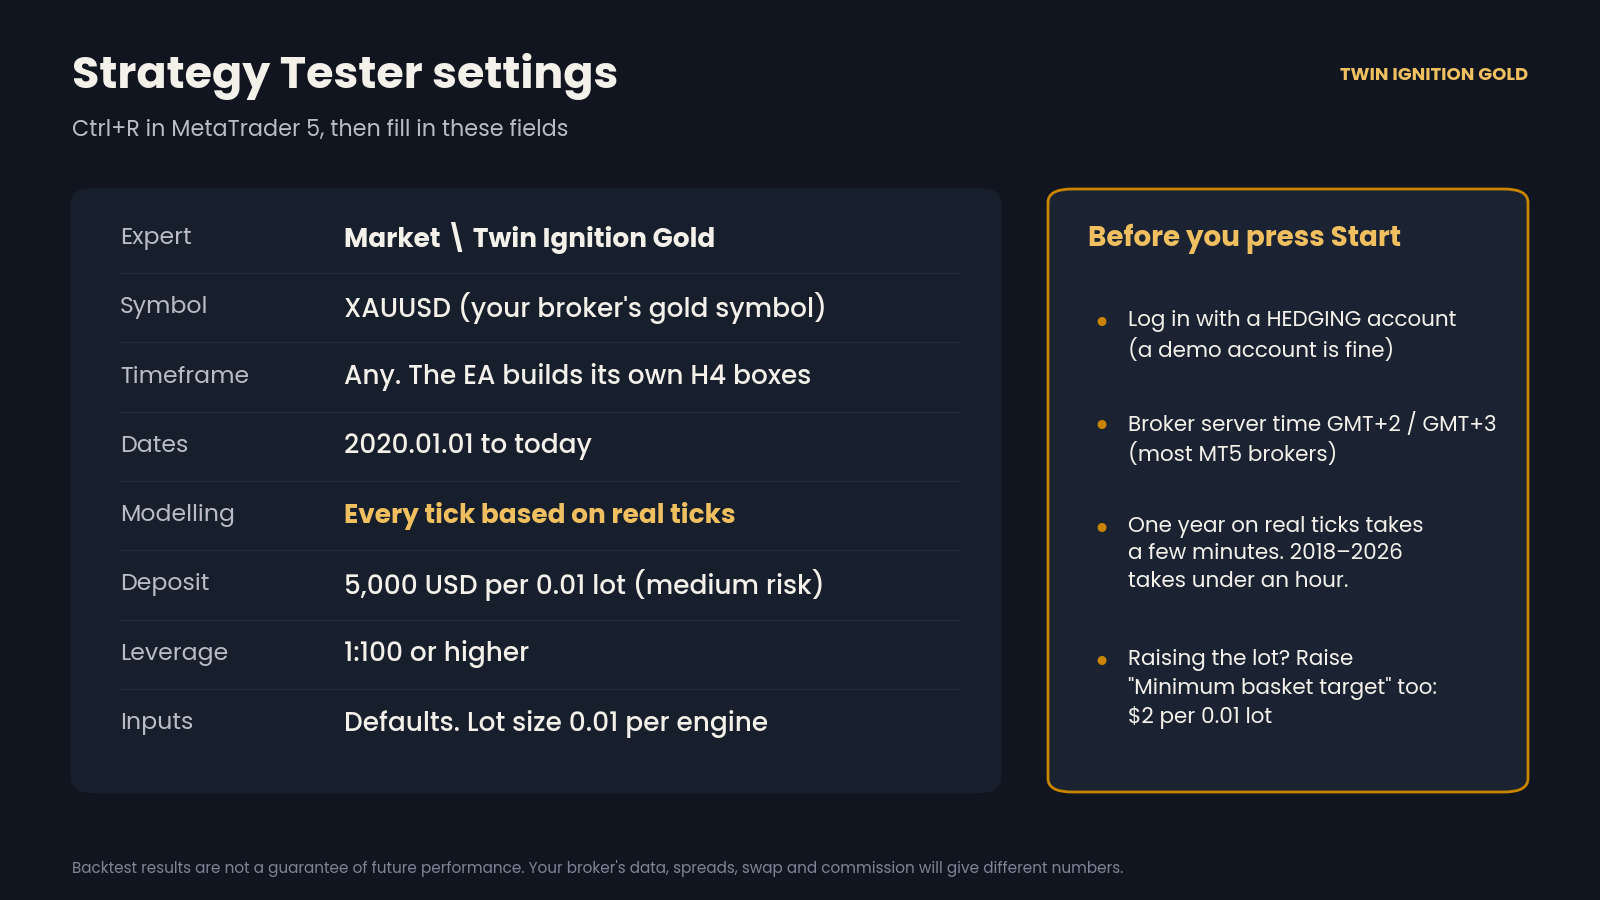
Two things matter most. Use "Every tick based on real ticks", because a range breakout lives and dies on exact prices. And log in with a hedging account, because the EA can hold a buy and a sell at the same time. A free demo account works fine.
Step 3. Run these three tests
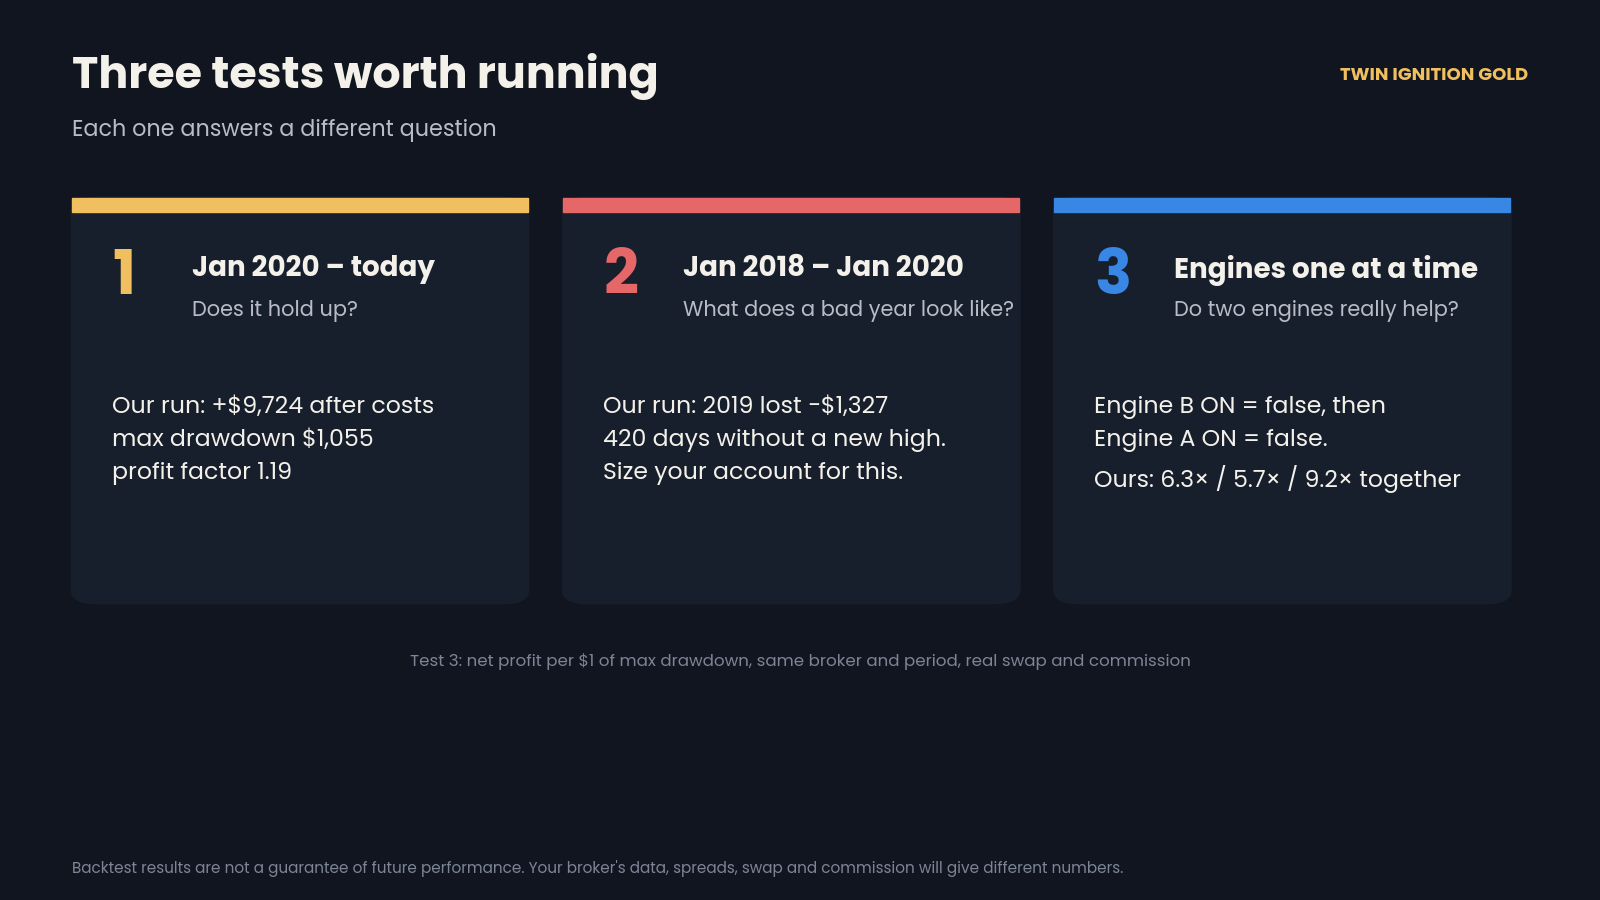
Test 1, Jan 2020 to today. This is the period on the product page. On my broker it made +$9,724 at 0.01 lot per engine after $2,358 of swap and commission, with a $1,055 max drawdown. Your number will be different. Spreads, swap and commission differ between brokers, so look at the shape of the curve as much as the final profit.
Test 2, Jan 2018 to Jan 2020. This is the hard part, and I want you to see it. 2019 lost $1,327 on my data, and the account went 420 days without a new high. If your test shows a losing stretch here, the demo is behaving as expected. Size your account so you could sit through it.
Test 3, one engine at a time. Set "Engine B ON" to false and run it. Then turn B back on, set "Engine A ON" to false and run again. Compare both with the normal run. On my data, net profit per dollar of drawdown was 6.3 for Engine A alone, 5.7 for Engine B alone and 9.2 for both together. That gap is the whole reason the EA has two engines.
Step 4. Read the report the right way
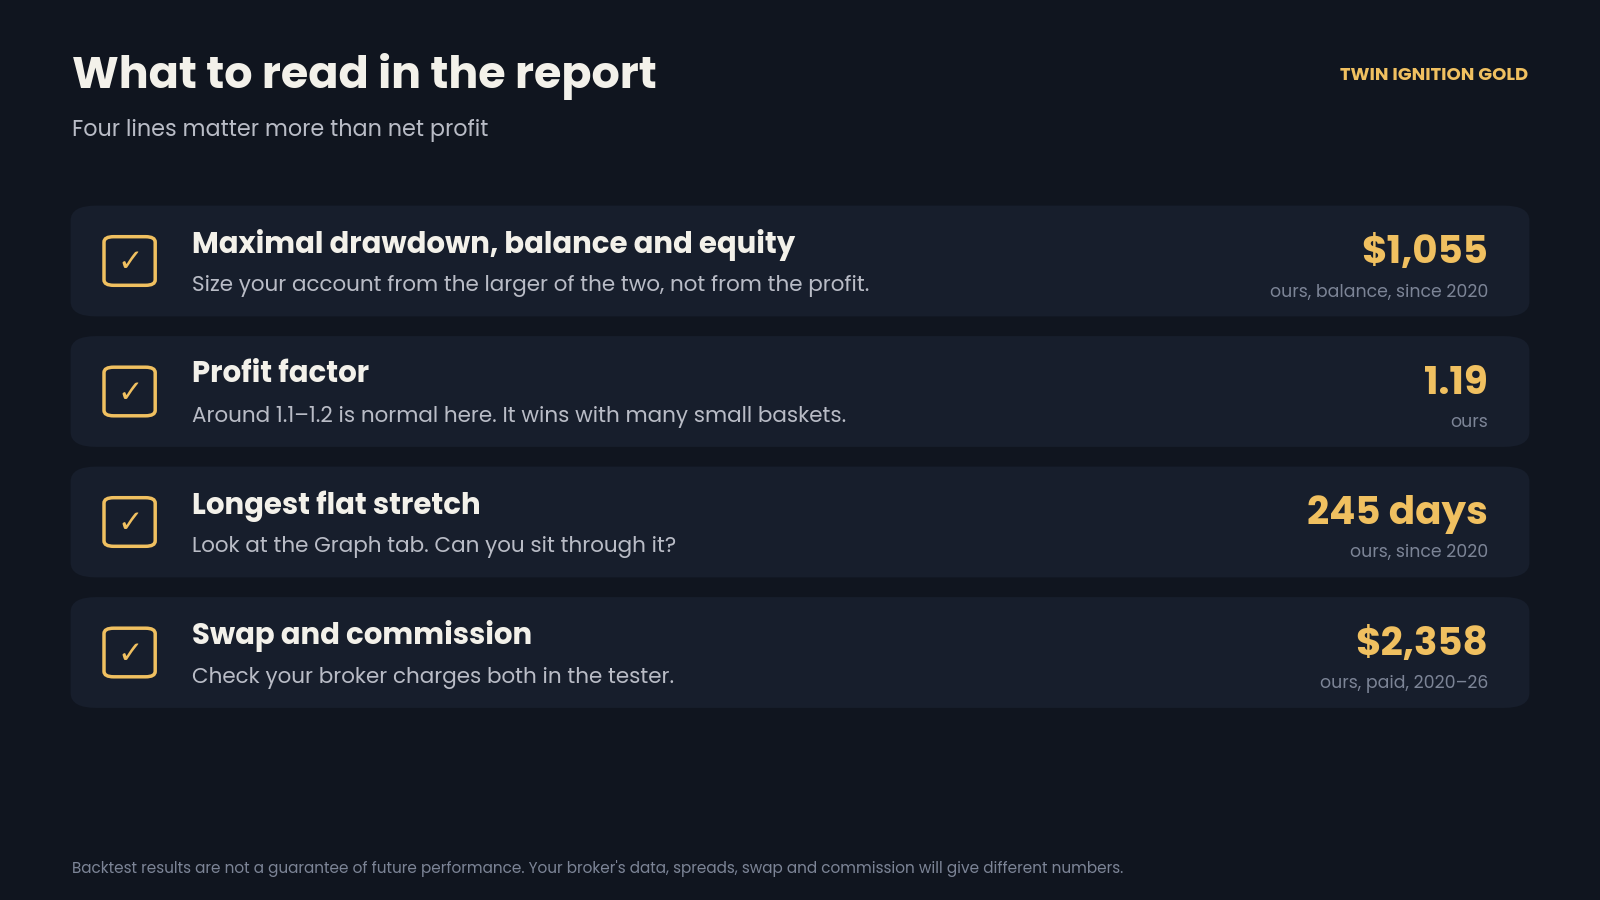
Net profit is the least useful line. Look at these four instead:
- Maximal drawdown (balance and equity). Size your account from the larger one. I use about $5,000 per 0.01 lot for medium risk.
- Profit factor. Around 1.1 to 1.2 is normal for this system. It wins with many small baskets, not a few big trades.
- The longest flat stretch on the Graph tab. Since 2020 it was 245 days on my data. Ask yourself if you would keep it running that long.
- Swap and commission. Check that your broker charges both in the tester, or the result will look better than real trading.
One setting to watch
If you test a bigger lot, raise "Minimum basket target" by the same factor. It is $2 per 0.01 lot, so 0.05 lot needs $10. If you leave it at $2, the results will not match the tested settings.
Tell me what you get
If your results look very different from mine, post them in the product comments with your broker and settings. I will reply to every one, good or bad.
Free demo: https://www.mql5.com/en/market/product/200517
84-second video overview: https://www.mql5.com/en/blogs/post/777302
Backtest results are not a guarantee of future performance. Trading gold with leverage carries a high level of risk. Only trade money you can afford to lose.