
This guide explains how to install the indicator, use its chart controls, understand where reference prices come from, customize their appearance and interpret nearby levels.
The goal is straightforward: keep useful price references accessible without repeatedly drawing horizontal lines or switching between timeframes to check previous highs, lows and opening prices.

Figure 1 — Chart Reference Levels displaying daily, weekly and monthly references on a GBPUSD chart.
1. Installation and first launch
After downloading Chart Reference Levels from the MQL5 Market:
-
Open MetaTrader 5 and locate Chart Reference Levels in the Navigator.
-
Open a standard price chart for the symbol you want to analyze.
-
Drag the indicator onto the chart.
-
Review the input parameters and click OK.
The indicator will initialize and request the daily, weekly and monthly price series available for the selected symbol.
By default, four references are displayed:
-
PDH — Previous Day High
-
PDL — Previous Day Low
-
PWH — Previous Week High
-
PWL — Previous Week Low
Monthly references and current period opening prices are initially hidden to keep the chart uncluttered.

Figure 2 — Initial display with the previous daily and weekly highs and lows enabled.
The small toolbar in the upper-left corner provides access to the remaining references without reopening the indicator settings.
If the required history is already available, the levels may appear immediately. Otherwise, the indicator automatically retries while MetaTrader 5 prepares the relevant price series.
2. Understanding the chart controls
Chart Reference Levels uses five on-chart controls.
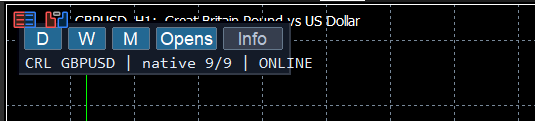
Figure 3 — The D, W, M, Opens and Info controls.
| Control | Function |
|---|---|
| D | Show or hide daily references |
| W | Show or hide weekly references |
| M | Show or hide monthly references |
| Opens | Show or hide current opening prices for the enabled period groups |
| Info | Open or close the reference information panel |
For example, to display all nine references:
-
Keep D and W enabled.
-
Click M to activate monthly references.
-
Click Opens to display the current daily, weekly and monthly opening prices.
-
Click Info to inspect their values and source periods.
You can return to a simpler view by disabling Opens or any timeframe group.
These controls affect visibility only. They do not change the underlying reference prices.
Your visibility selections are stored locally and can be restored when changing chart timeframes or restarting the same chart in the terminal.
3. Where do the reference prices come from?
This is one of the most important details to understand.
Chart Reference Levels does not calculate custom New York trading sessions or rebuild daily candles using an arbitrary timezone.
Instead, it uses the native D1, W1 and MN1 series provided by MetaTrader 5 through your broker.
Previous period highs and lows
The indicator reads the High and Low of the previous available candle for the relevant timeframe.
For example:
-
PDH and PDL come from the previous D1 candle.
-
PWH and PWL come from the previous W1 candle.
-
PMH and PML come from the previous MN1 candle.
Current period opening prices
The three opening references use the Open of the latest available candle:
-
DO — Current Daily Open
-
WO — Current Weekly Open
-
MO — Current Monthly Open
These prices are displayed as horizontal references across the chart.
Why broker differences matter
Two brokers may build their daily candles differently.
One broker may include a short Sunday candle, while another may begin its next daily session at a different time.
Consequently, the previous daily High and Low can differ even when both brokers display the same instrument.
This is expected when the source candles differ.
Chart Reference Levels follows the broker's native candles rather than forcing all brokers to use the same trading-day definition.
A period changes when the corresponding new native candle becomes available, not simply because the user's local clock reaches midnight.
4. Using the Info panel
The Info panel makes it possible to inspect the references without manually switching to D1, W1 or MN1.

Figure 4 — The Info panel showing reference values and broker-native source periods.
The panel identifies the current symbol and the price basis used by the chart, such as Bid or Last.
It also displays the available reference values and their associated timestamps.
Two timestamps are particularly useful:
S — Source period
The start time of the native candle from which the reference price was obtained.
A — Application period
The start time of the current native period to which that reference belongs.
For a previous daily High, the source is the previous D1 candle, while the application period is the latest available D1 candle.
For the current Daily Open, both timestamps correspond to the latest available D1 candle.
The same principle applies to the weekly and monthly references.
Understanding the status line
The toolbar also provides a short data status, such as:
CRL EURUSD | native 9/9 | ONLINE
The value 9/9 means all nine native reference values are available.
It does not mean all nine lines are currently enabled. You may have nine available references but choose to display only four.
The ONLINE or OFFLINE status refers to the terminal connection. Cached native price history may still be available while offline.
Important historical limitation
The horizontal lines represent the current reference set.
They extend across the entire visible chart for convenience, including over older candles.
However, this does not mean the displayed reference values were already known at every historical candle.
Chart Reference Levels is not a historical level-reconstruction or replay system. Its purpose is to display the references applicable to the latest available native periods.
5. Customizing the indicator
Different chart backgrounds and trading setups require different visual preferences.
Chart Reference Levels allows users to choose an individual color for each of its nine references.
To modify the appearance:
-
Open the chart's Indicators List using Ctrl+I.
-
Select Chart Reference Levels.
-
Open its Properties and select the Inputs tab.
-
Find the Daily, Weekly and Monthly reference color sections.
-
Choose the desired colors and apply the changes.
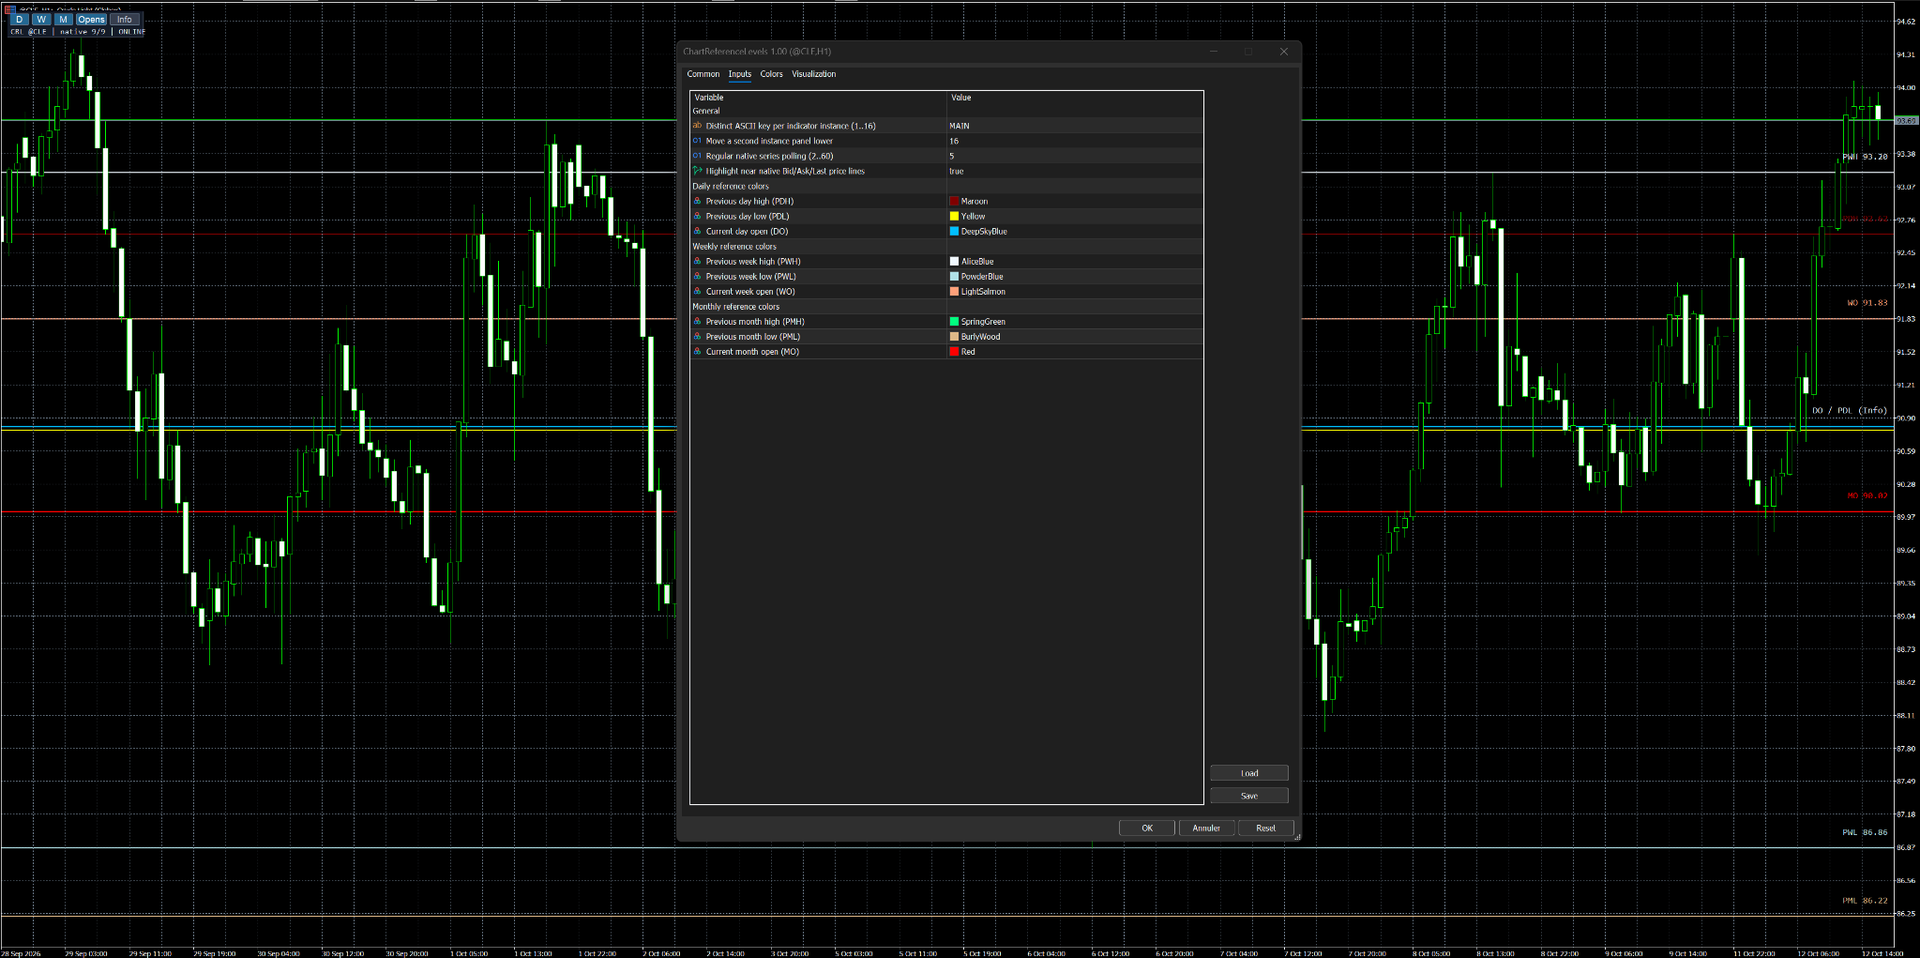
Figure 5 — Individual color settings for all nine reference levels.
The default color organization is designed to distinguish period groups:
-
Daily references use blue tones.
-
Weekly references use yellow/gold tones.
-
Monthly references use green tones.
You can replace these colors with any suitable combination.
For example, a dark background may benefit from brighter colors, while a light background may require darker tones for improved contrast.
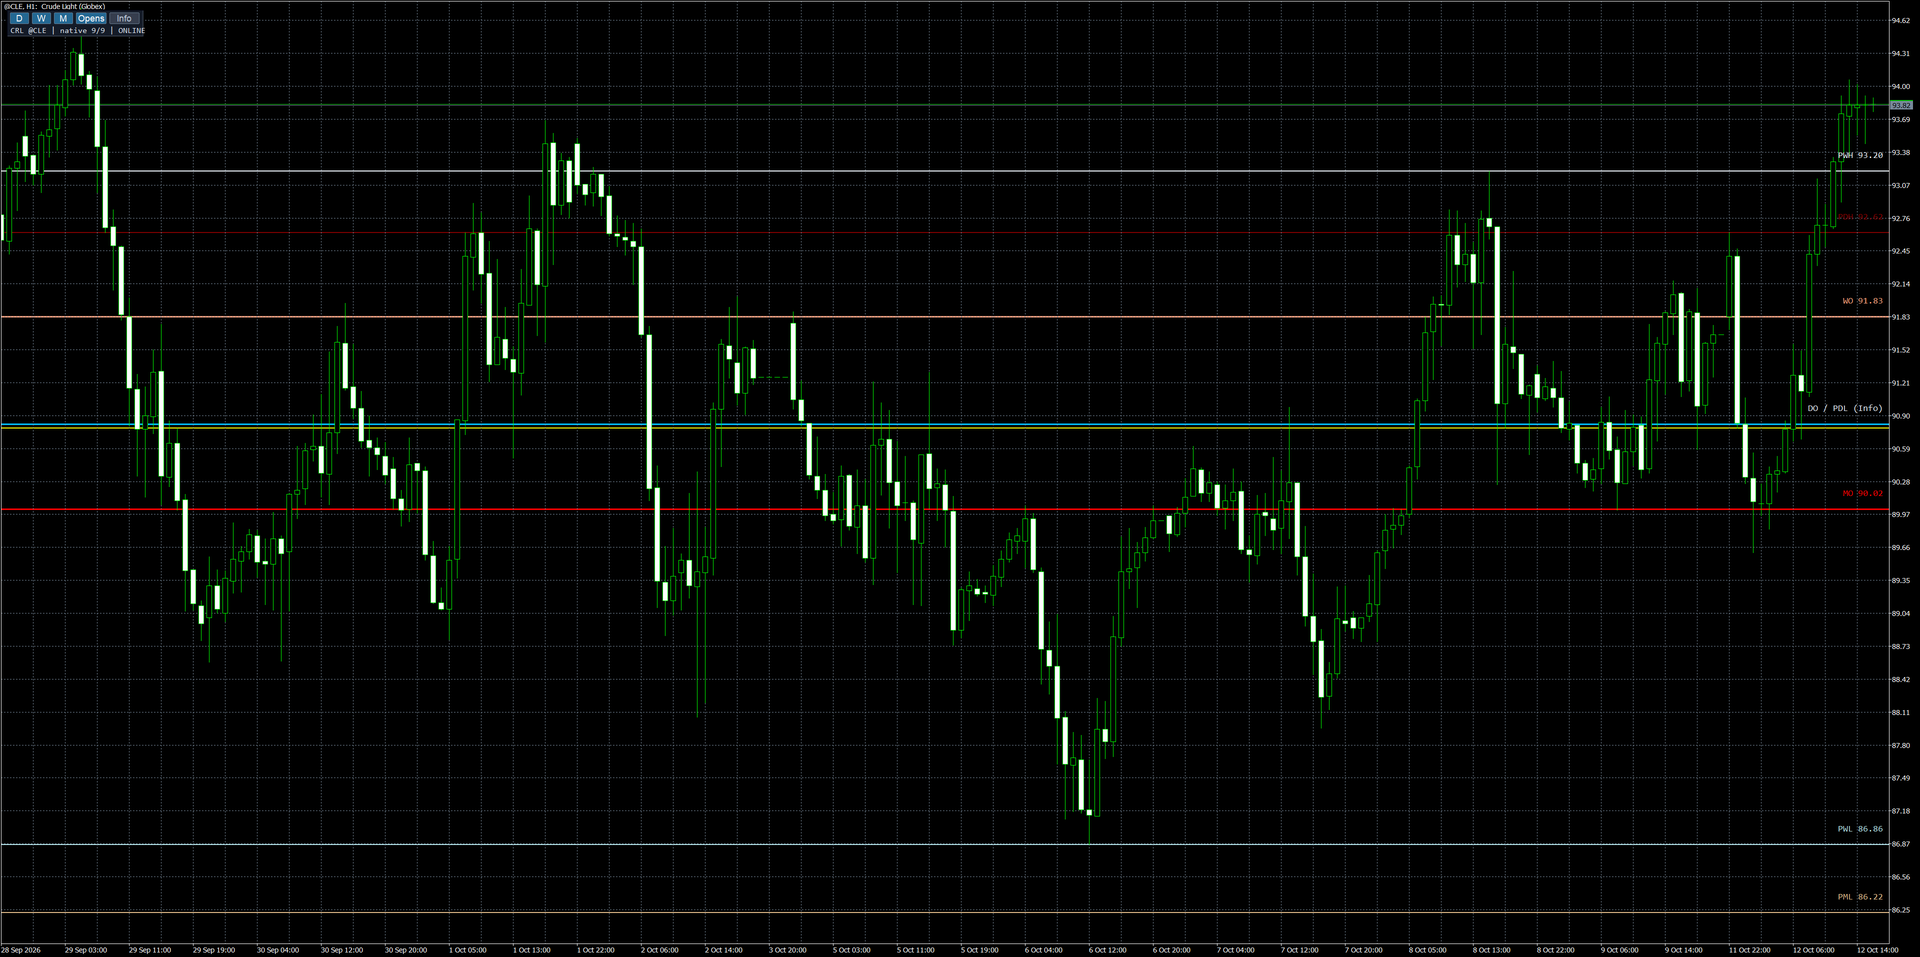
Figure 6 — An example of customized reference colors on a price chart.
Color changes affect the visual presentation only.
The reference prices, source candles and calculation logic remain unchanged.
Additional settings
The Inputs tab also contains several operational options:
Instance Key
Identifies an indicator instance. The default is MAIN.
If you intentionally use multiple copies on the same chart, assign a different key to each copy, such as MAIN and ALT.
Panel Position
Adjusts the vertical location of the toolbar. This can help organize multiple indicator instances.
Polling Interval
Controls regular checks of the native price series. The default setting is suitable for normal use.
Price Line Accent
Temporarily emphasizes a reference line when it is very close to a visible native Bid, Ask or Last price line.
This helps maintain visibility when MetaTrader's own market-price line overlaps a reference.
The feature never changes the reference price or the platform's market-price settings.
6. What happens when several levels are close together?
Daily, weekly and monthly reference prices can sometimes be very close or even identical.
Displaying a separate label for every reference at nearly the same vertical position can make a chart difficult to read.
Chart Reference Levels addresses this by grouping nearby labels.
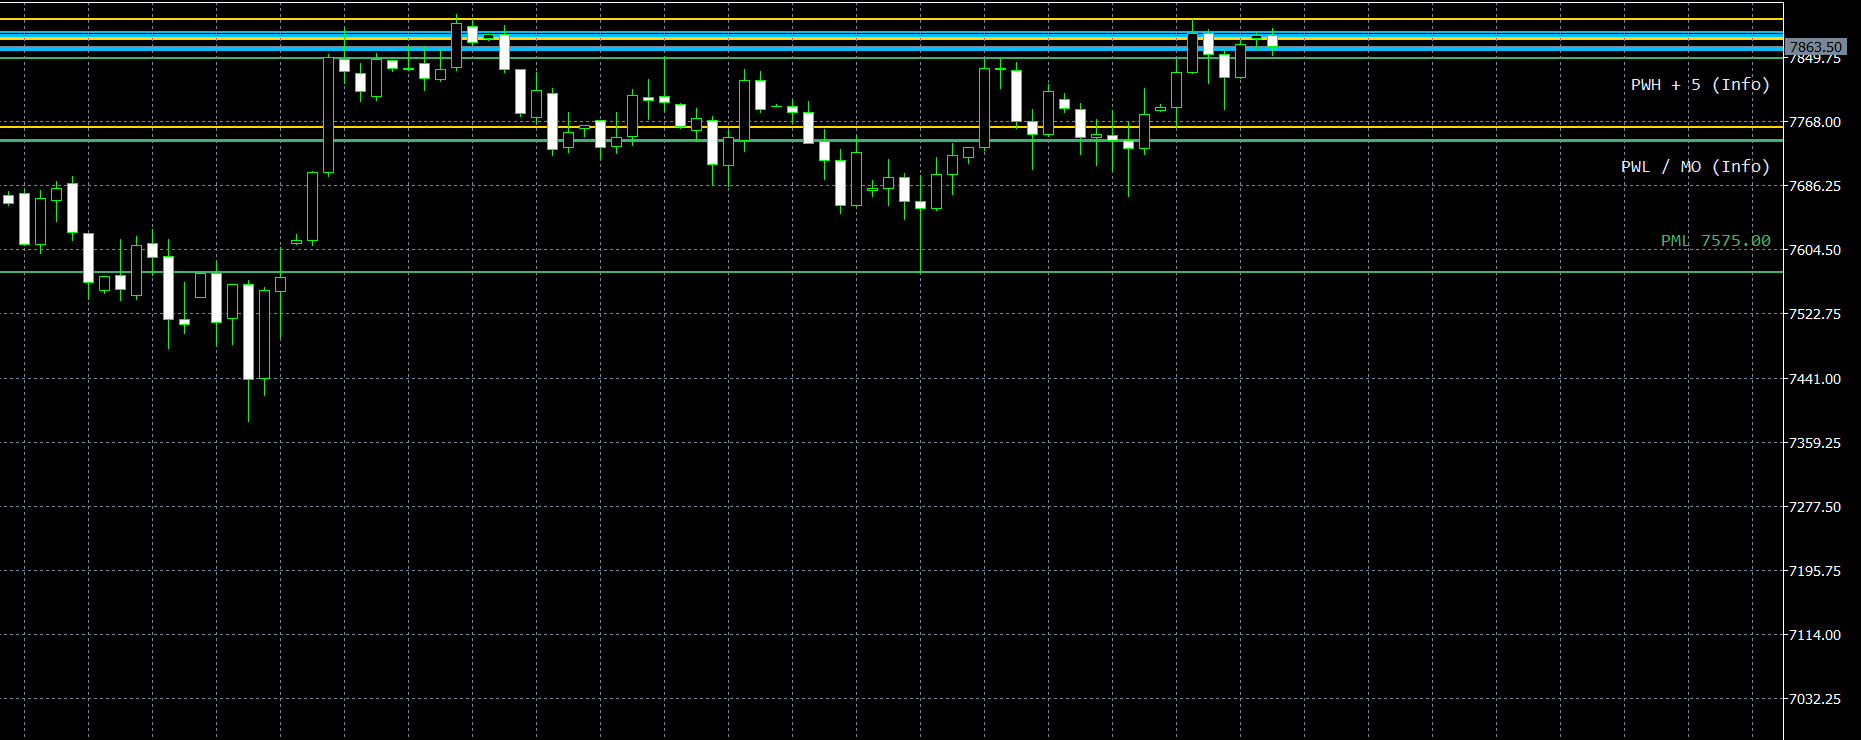
Figure 7 — Nearby reference levels organized into compact labels.
A combined label may display something similar to:
PDH + 3 (Info)
This indicates that several references are grouped in that area.
The individual horizontal lines remain at their exact prices.
Grouping does not move the levels, average their values or change their calculations.
To inspect the individual references, open Info. Each available price and its corresponding source period remain accessible.
The purpose of the grouping system is visual organization, not the identification of trading signals or statistically significant support and resistance zones.
7. Practical example: observing price around a reference level
Consider a trader monitoring an intraday chart while the market approaches the previous daily High.
Without reference levels, the trader may need to switch to D1, locate the relevant candle and manually transfer its High onto the working chart.
With Chart Reference Levels, PDH is already available on the intraday chart.
The trader can observe several possibilities:
Price approaches PDH
The level provides a fixed reference against which the current price movement can be observed.
Price trades through PDH
The trader can compare subsequent price action with the previous daily range boundary.
Price moves back below PDH
The reference remains unchanged during the same native period, allowing the trader to continue observing the interaction.
These are examples of chart reading, not trading instructions.
A previous High or Low does not automatically represent reliable support, resistance or a reversal point. No particular reaction is guaranteed.
Likewise, a current period Open is a price reference, not a directional prediction.
The indicator supplies context; interpreting that context remains the trader's responsibility.
8. Using Chart Reference Levels on different instruments
The indicator is not limited to Forex symbols.
It can also display the same native references on other standard MetaTrader 5 charts, provided the broker supplies the required price history.
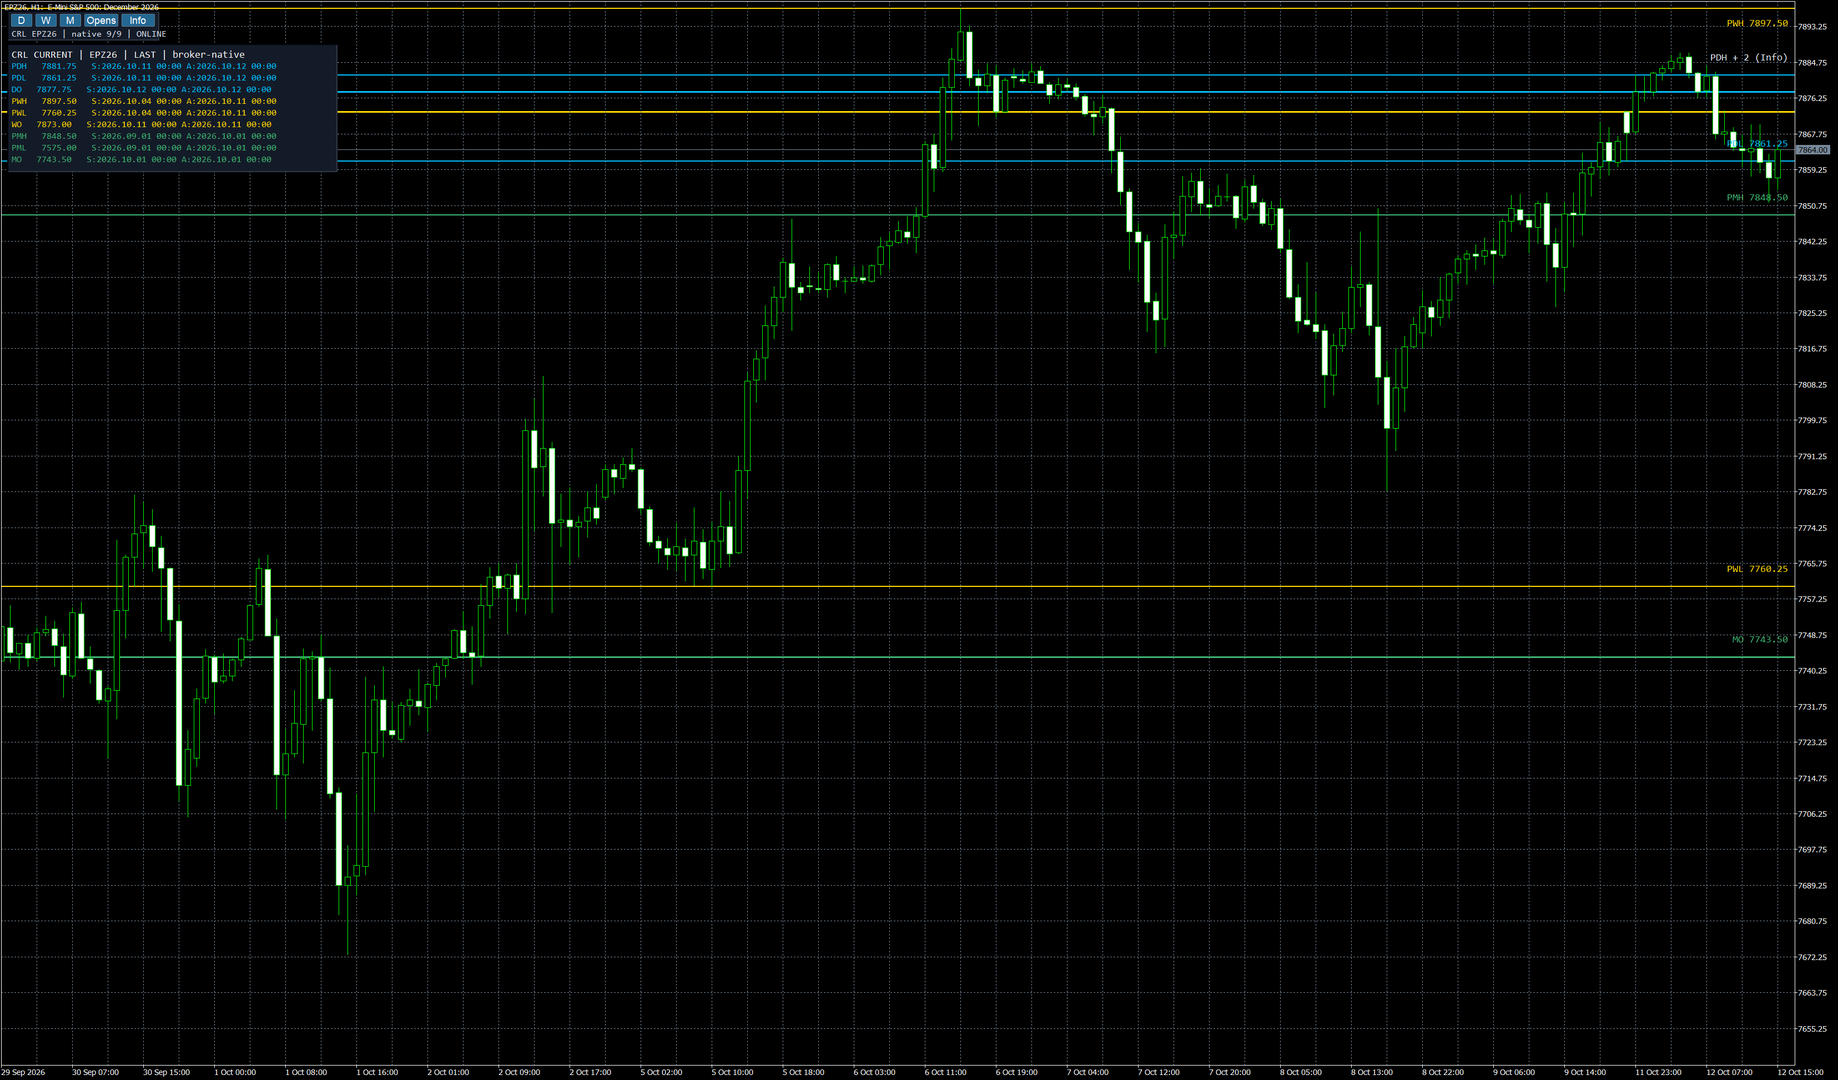
Figure 8 — Chart Reference Levels applied to a futures contract, using broker-provided price history.
The underlying logic remains the same regardless of the instrument:
-
Previous native-period highs and lows
-
Current native-period opening prices
-
Exact price coordinates
-
Symbol-specific price precision
However, session structures, available history and price formatting may differ across instruments and brokers.
The indicator follows the symbol's available native price series rather than assuming every instrument uses Forex market hours.
This is particularly important when working with exchange-traded contracts or instruments with limited trading sessions.
9. Troubleshooting and common questions
Some levels are not displayed. Why?
First, check whether their period group is enabled.
If the relevant group is active, the necessary historical candles may not yet be available.
Open Info to inspect the current data status.
MetaTrader 5 may need additional time to load or build the D1, W1 or MN1 series.
You can also open the corresponding native timeframe to inspect the broker's available candles.
Why are some levels outside my chart?
Reference levels retain their actual market prices.
When a level is outside the currently visible vertical price range, the indicator does not artificially move it onto the screen.
Adjusting the chart's price scale may reveal the level.
Its value remains available in Info.
Why do my levels differ from another trader's levels?
Compare the broker, exact symbol and source candles.
Different daily boundaries, short Sunday candles or differences in broker history can produce different references.
Chart Reference Levels does not enforce a universal daily or weekly session definition.
Why do multiple references share one label?
Their screen positions are too close for independent labels to remain readable.
Open Info to see the complete list of values.
The references themselves remain separate and are not merged.
Does changing the chart timeframe change the references?
Normally, switching between M1, M15, H1 or H4 does not change the native D1/W1/MN1 reference prices.
The references may still update when new native periods become available or when the broker corrects historical data.
Zooming or resizing can also change label positions without changing their underlying prices.
Can I use the indicator together with an Expert Advisor?
Chart Reference Levels is a read-only indicator, not an Expert Advisor.
It can be attached to a standard chart alongside an EA, subject to sufficient space for their respective interfaces.
It does not send trading orders or manage positions.
Does it require an external account or subscription?
No separate cloud account, API key, DLL or paid data subscription is required by the indicator.
Price-history availability still depends on MetaTrader 5 and the connected broker.
10. Final notes
Chart Reference Levels focuses on a narrow, practical task: keeping previous period highs and lows and current opening prices accessible during chart analysis.
The combination of quick visibility controls, individually customizable colors, organized labels and inspectable broker-native data makes it possible to work with those references without repeatedly rebuilding the chart.
It deliberately does not include automated trading, trading signals, alerts, custom session reconstruction or predictive calculations.
The current release is version 1.00 for MetaTrader 5, available free of charge on the MQL5 Market.
Chart Reference Levels — MQL5 Market product page
For product-specific questions, feedback or reproducible issues, please use the product's Comments section on MQL5.
Thank you for reading.


