Screen broadly with 1 Minute OHLC, compare and make sure with Real Tick + Fast or Normal speed.
When you first start using PNG, you may wonder which markets to enable and how much DD Target to assign to each one.
Instead of changing everything at once, test one market at a time under consistent conditions. Review its trade frequency, losing periods, position sizing, and drawdown before deciding which markets should be combined.
A practical PNG testing workflow is:
1 Minut OHLC → broad screening
Real Tick + Fast or normal → market and configuration comparison
1. Understand Backtest Mode and Backtest Speed
PNG separates two different concepts.
Backtest Mode determines the price-data model and test execution path.
Backtest Speed determines how PNG processes the test internally.
| Setting | Option | Main Use |
|---|---|---|
| Backtest Mode | 1 Minute OHLC | Quickly screen periods and configurations |
| Backtest Mode | Every tick based on real ticks | Validate results using real tick data |
| Backtest Speed | Fast | Compare markets and risk settings more quickly |
| Backtest Speed | Normal | Final DD validation and Custom reference measurement |
1 Minute OHLC
The MT5 1 Minute OHLC model represents each minute using its Open, High, Low, and Close prices.
Because the exact intraminute price path is simplified, entries, stop-losses, take-profits, and trailing-stop behavior can differ from Real Tick results.
PNG includes a dedicated OHLC backtesting path designed to reduce some of these differences.
However:
1 Minute OHLC should not be expected to reproduce every Real Tick trade or result.
The PNG setting and the MT5 Strategy Tester model must also match.
| PNG Backtest Mode | MT5 Strategy Tester Model |
|---|---|
| Every tick based on real ticks | Every tick based on real ticks |
| 1 Minute OHLC | 1 minute OHLC |
Changing the PNG input does not automatically change the MT5 Strategy Tester model.
2. How Close Was 1 Minute OHLC in an Actual Comparison?
PNG sales version 2.163 was compared under the following conditions:
-
Period: October 1, 2025 – October 1, 2026
-
USDJPY H1 host chart
-
One Chart Mode
-
All six markets enabled
-
DD Target: 3% per market
-
Backtest Speed: Normal
-
Initial deposit: $100,000
-
Leverage: 1:200
-
Execution delay: 400 ms
-
Commission and swap included
-
Entry / Exit Time Randomization: OFF
-
SL Randomization: 0%
The results were:
| Metric | Real Tick Normal | 1 Minute OHLC Normal | Difference vs. Real Tick |
|---|---|---|---|
| Net Profit | $68,290.47 | $69,331.33 | +1.52% |
| Max Balance DD | $9,389.78 | $9,498.65 | +1.16% |
| Max Equity DD | $10,908.38 | $10,877.10 | −0.29% |
| Trades | 3,540 | 3,433 | −107 |
In this particular test, the portfolio-level profit and drawdown were relatively close.
This makes 1 Minute OHLC useful for initial screening and configuration comparison.
However, similar portfolio totals do not mean that every market behaves similarly.
A market that appears particularly strong under OHLC should be checked again with Real Tick data before it is given more risk.
These figures also come from one period and one configuration. They do not mean that OHLC differences will remain within the same range across other brokers, periods, or settings.
3. (backtest speed mode)- Fast and Normal Can Also Produce Different Results
Fast mode can still use Real Tick data.
The difference is that PNG reduces some internal processing frequency to shorten the test time.
Because some processing occurs at different points, entry, exit, trailing-stop behavior, and drawdown can differ from Normal mode.
In an earlier internal long-term development comparison covering:
January 1, 2018 – September 4, 2026
the Fast processing approach produced the following results:
| Metric | Normal | Fast |
|---|---|---|
| Test Time | ~2h 7m 26s | ~56m 52s |
| Net Profit | $546,809.12 | $566,783.34 |
| Max Balance DD | $29,710.07 | $30,625.29 |
In this case, the test time was reduced by approximately 55.4%.
The results were not identical. Maximum Balance DD was approximately 3.08% higher, and net profit also differed.
If your computer specifications are low or you are short on time, you can use the "fast" verification method; however, you should not treat the results as highly accurate.
4. Recommended Backtesting Workflow
Step 1 — Match Your Broker and Account Conditions
Start with the environment you actually plan to trade.
Check:
-
broker symbol names,
-
initial balance,
-
account currency,
-
leverage,
-
commission,
-
swap,
-
minimum lot,
-
lot step,
-
contract size,
-
and broker server time.
The same DD Target can produce different position sizes and results under different broker specifications.
When comparing tests, keep the conditions consistent.
Step 2 — Use 1 Minute OHLC for Broad Screening
If you want to compare many periods, markets, or configurations quickly, 1 Minute OHLC can be used as an initial screening tool.
At this stage, focus on:
-
approximate trade frequency,
-
major losing periods,
-
broad profit characteristics,
-
and approximate drawdown behavior.
When using PNG's dedicated OHLC execution path, keep:
Randomize Entry / Exit Time = OFF
When comparing OHLC with Real Tick results, also keep SL Randomization and other execution settings identical.
PNG's OHLC-specific execution path is used only in the Strategy Tester. Demo and live trading continue to use the normal real-time execution path.
Step 3 — Use Real Tick + Fast / Normal to Compare Markets
Next, test markets individually using:
Every tick based on real ticks + Fast
In One Chart Mode, enable one market and disable the others.
Use the same account size, period, and settings when moving from one market to another.
Check:
-
whether enough trades occurred,
-
Balance DD,
-
Equity DD,
-
actual executed lot size,
-
whether the broker's minimum lot is limiting risk reduction,
-
and whether losses are concentrated in particular periods.
Remember:
DD Target is a position-sizing reference based on historical drawdown.
Setting DD Target to 3% does not mean every backtest will produce exactly 3% DD.
It also does not mean future losses will stop at 3%.
Step 4 — Test the Full Portfolio
After reviewing the individual markets, enable the markets and strategies you actually plan to trade.
Then run the final portfolio test using: Real Tick
for example:
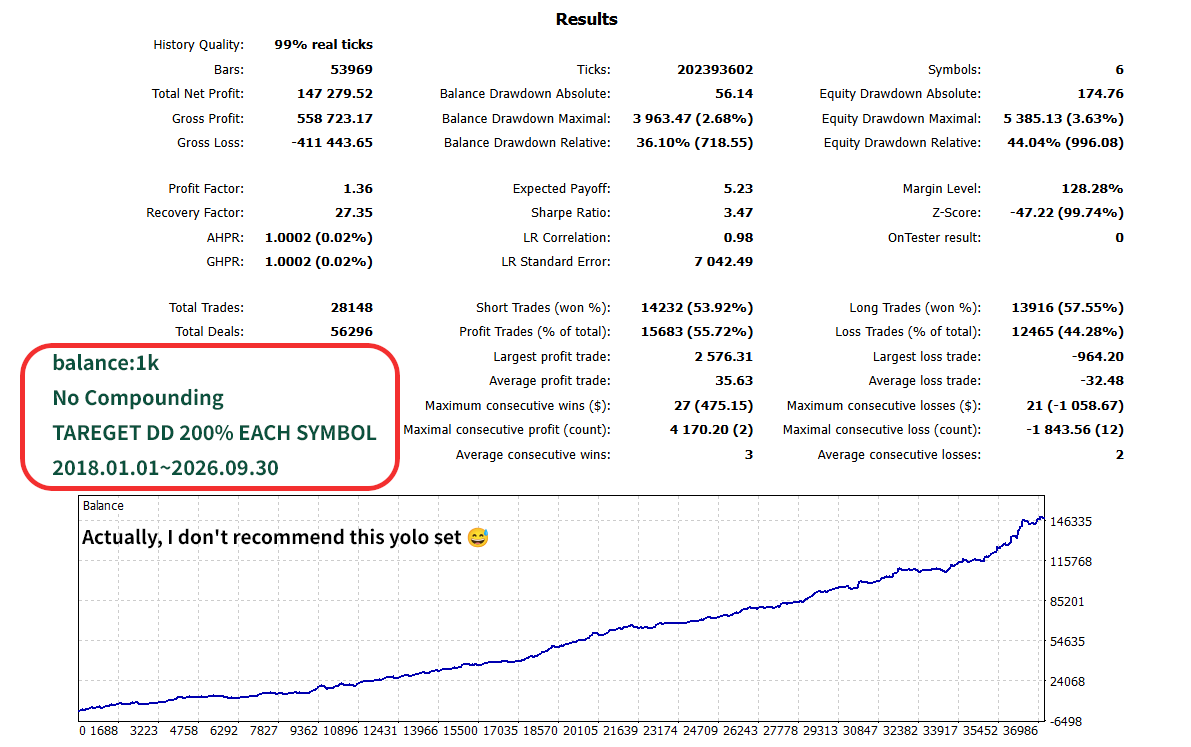
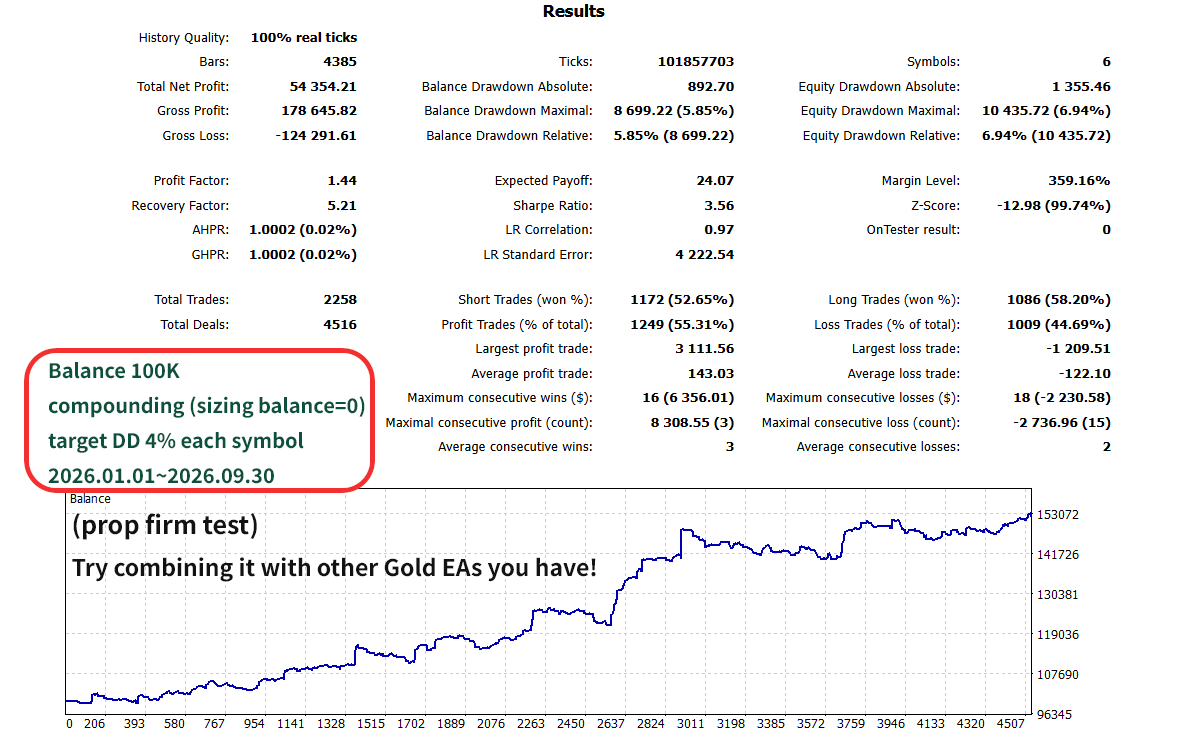
At this stage, the focus moves from individual markets to account-level risk.
Check:
-
whether losses overlap across markets,
-
combined Balance DD,
-
combined Equity DD,
-
simultaneous open positions,
-
margin usage,
-
and periods of concentrated portfolio stress.
If you plan to use Entry / Exit Time Randomization or SL Randomization in live trading, apply those intended settings during the final portfolio validation.
One important point:
Adding the DD Targets of individual markets does not give you the maximum DD of the combined portfolio.
Likewise, adding drawdowns from separate symbol tests does not reproduce the result of trading those markets together.
Portfolio risk should be evaluated using the combined test.
5. Mode Differences Are Not Fixed DD Correction Factors
In the PNG 2.163 comparison above, OHLC Balance DD was 1.16% higher than Real Tick.
In the separate Fast comparison, Balance DD was 3.08% higher than Normal.
These numbers should not be used as universal correction factors.
For example, you should not automatically reduce every DD Target by 1.16% or 3.08%.
The differences can change with:
-
broker conditions,
-
symbol,
-
market regime,
-
test period,
-
account size,
-
and strategy configuration.
Instead, compare modes under the same market, period, and settings in your own environment.
Pay particular attention to:
-
cases where DD becomes larger,
-
periods where losses cluster,
-
and markets whose behavior changes significantly between modes.
Your final risk allowance should be based primarily on Real Tick results and the amount of loss you are actually prepared to tolerate.
If the target DD doesn't align with your broker, you can, of course, configure the target DD to suit your broker! Please refer to the following post.
6. Account Size, Small Accounts, and Prop Firm Use
PNG contains many strategies, and those strategies do not all use the same internal sizing coefficient.
Because of this, PNG generally has more sizing flexibility on a larger account.
With more available capital, the system has more room to preserve the intended relative sizing between strategies while remaining above the broker's minimum-lot and lot-step restrictions.
On smaller accounts, some strategies may reach the minimum lot before the intended risk can be reduced further.
If this happens, consider:
-
using Fixed Lot to inspect the expected exposure,
-
reducing the number of enabled markets,
-
or using a larger account.
Fixed Lot is still only a sizing method. It does not guarantee a maximum future loss.
Prop Firm Accounts
Prop firm accounts can be a practical environment for PNG, especially when several markets and strategies are operated together.
Personal trading accounts are also fully suitable.
The important question is not whether the account is personal or funded.
The important question is whether:
-
the account size,
-
broker specifications,
-
minimum lot,
-
margin conditions,
-
and intended portfolio risk
allow PNG's sizing structure to operate reasonably.
Before using any prop firm, always check its current rules for:
-
Expert Advisors,
-
copy trading,
-
news trading,
-
weekend holding,
-
position management,
-
and execution restrictions.
Randomization for Prop Firm and Live Trading
PNG includes:
-
Randomize Entry / Exit Time
-
Maximum Entry / Exit Delay
-
SL Randomization
For live prop firm operation, I recommend enabling the intended randomization features where they are permitted by the firm's rules.
This helps reduce unnecessary execution overlap between users operating the same strategy configuration and helps protect both the strategy implementation and the trading interests of other PNG users.
However, randomization should be treated differently during controlled testing.
Turn randomization OFF when you are:
-
comparing OHLC and Real Tick,
-
comparing Fast and Normal,
-
measuring Custom DD references,
-
adjusting relative market risk,
-
comparing broker environments,
-
or investigating an unexpected result.
-
Randomization adds another variable and makes controlled comparisons less reproducible.
A simple rule is:
Calibration and risk measurement → Randomization OFF
Final live configuration → Apply your intended randomization settings
The Purpose of PNG Backtesting
PNG backtesting is not only about finding an attractive equity curve.
It is also about answering a more important question:
How much risk will this configuration actually create in my account?
The recommended workflow is:
1 Minute OHLC → broad screening
Real Tick + Fast → market and configuration comparison
Real Tick + Normal → final DD and portfolio-risk validation
During calibration and strategy-level risk adjustment, keep randomization disabled so that comparisons remain reproducible.
Once the final portfolio, DD Targets, and relative risk allocation have been selected, apply the execution and randomization settings you intend to use in live trading and perform one final portfolio test.
PNG generally has more sizing flexibility on larger accounts because many strategies operate together with different sizing coefficients.
Prop firm accounts can therefore be useful for multi-market deployment, while personal accounts remain fully suitable when the available capital and broker minimum-lot conditions are appropriate.
Start broadly.
Narrow down the markets and settings.
Measure risk under controlled conditions.
Then validate the configuration you actually intend to trade.
In the next article, INPUT guide. I will explain what to check when DD does not match expectations, when Custom calibration is appropriate, and how to measure and validate a Custom DD reference correctly.