

Array Breakout X Gold — backtest results, year by year (version 1.08)
This page shows the long test of the current version, then the same run cut into calendar years. Every year is shown, not a selection of the good ones. More capital sizes and risk levels will be added as their runs finish.
---
1. How it was tested
- MetaTrader 5 Strategy Tester, "Every tick based on real ticks", spread included
- Gold, H1 chart, 1:500
- One continuous run from 1 January 2016, no restart between years
---
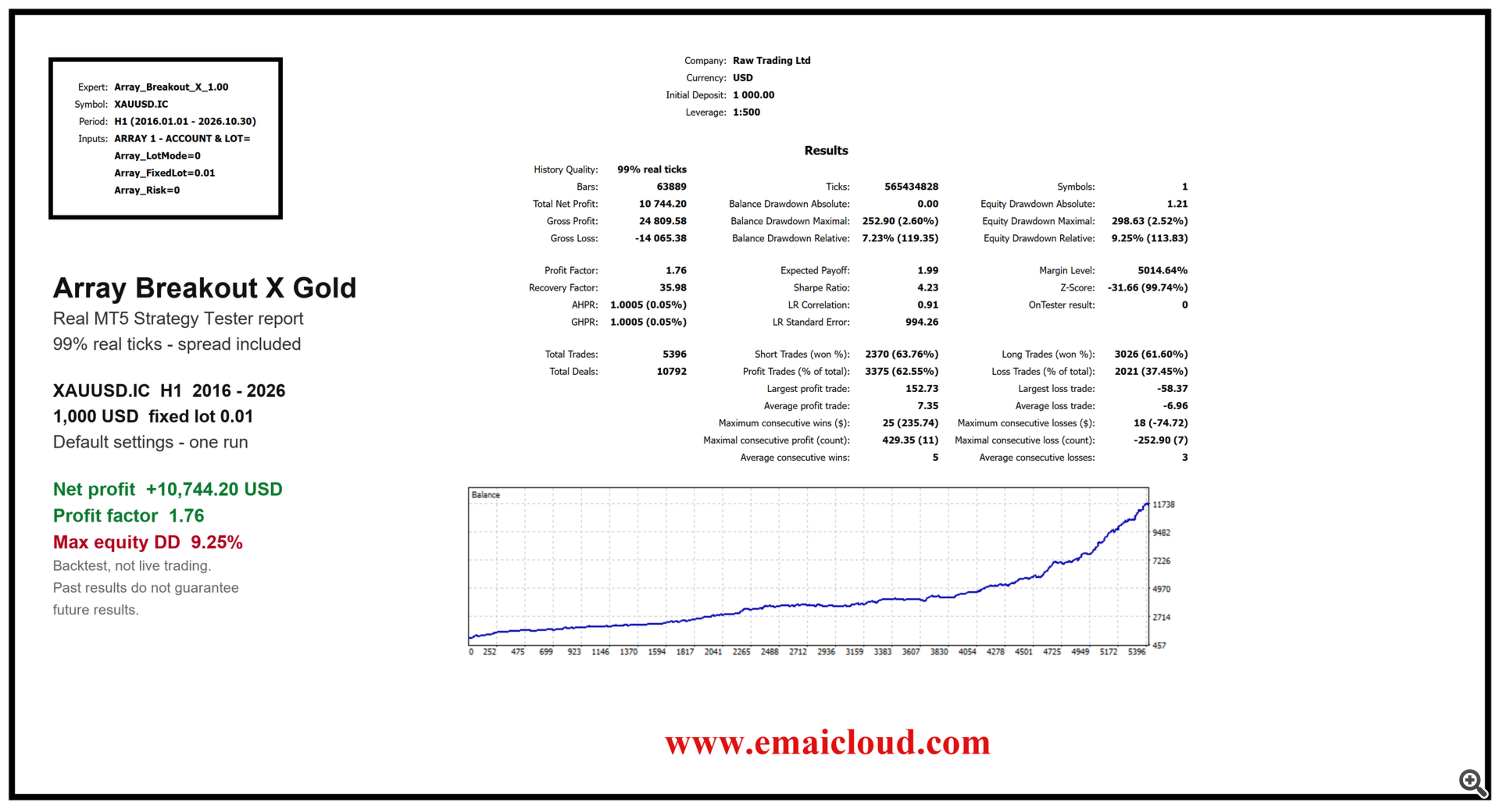
2. 1,000 USD · risk level Low, the default (1 January 2016 – 30 October 2026)
Fixed 0.01 lot
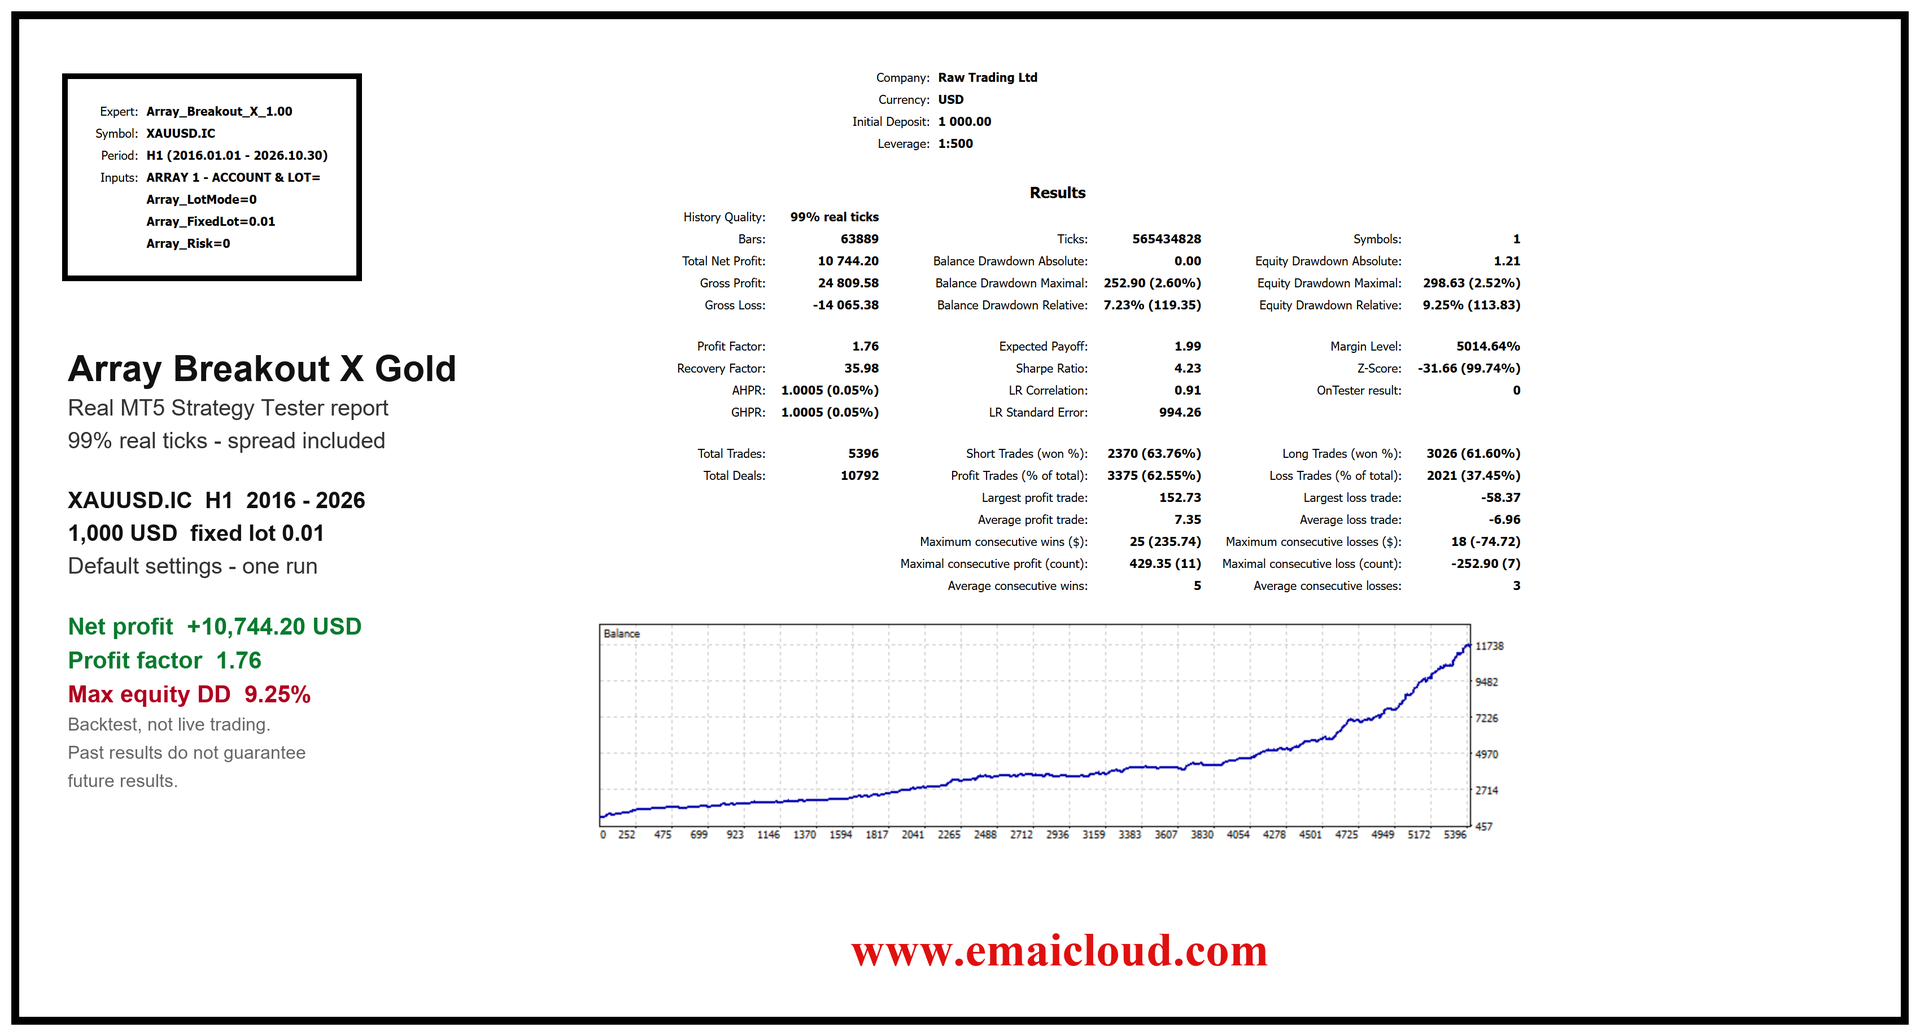
Net profit +10,744 USD · Maximum equity drawdown 9.25% · Profit factor 1.76 · 5,396 trades
[ ]
 ]
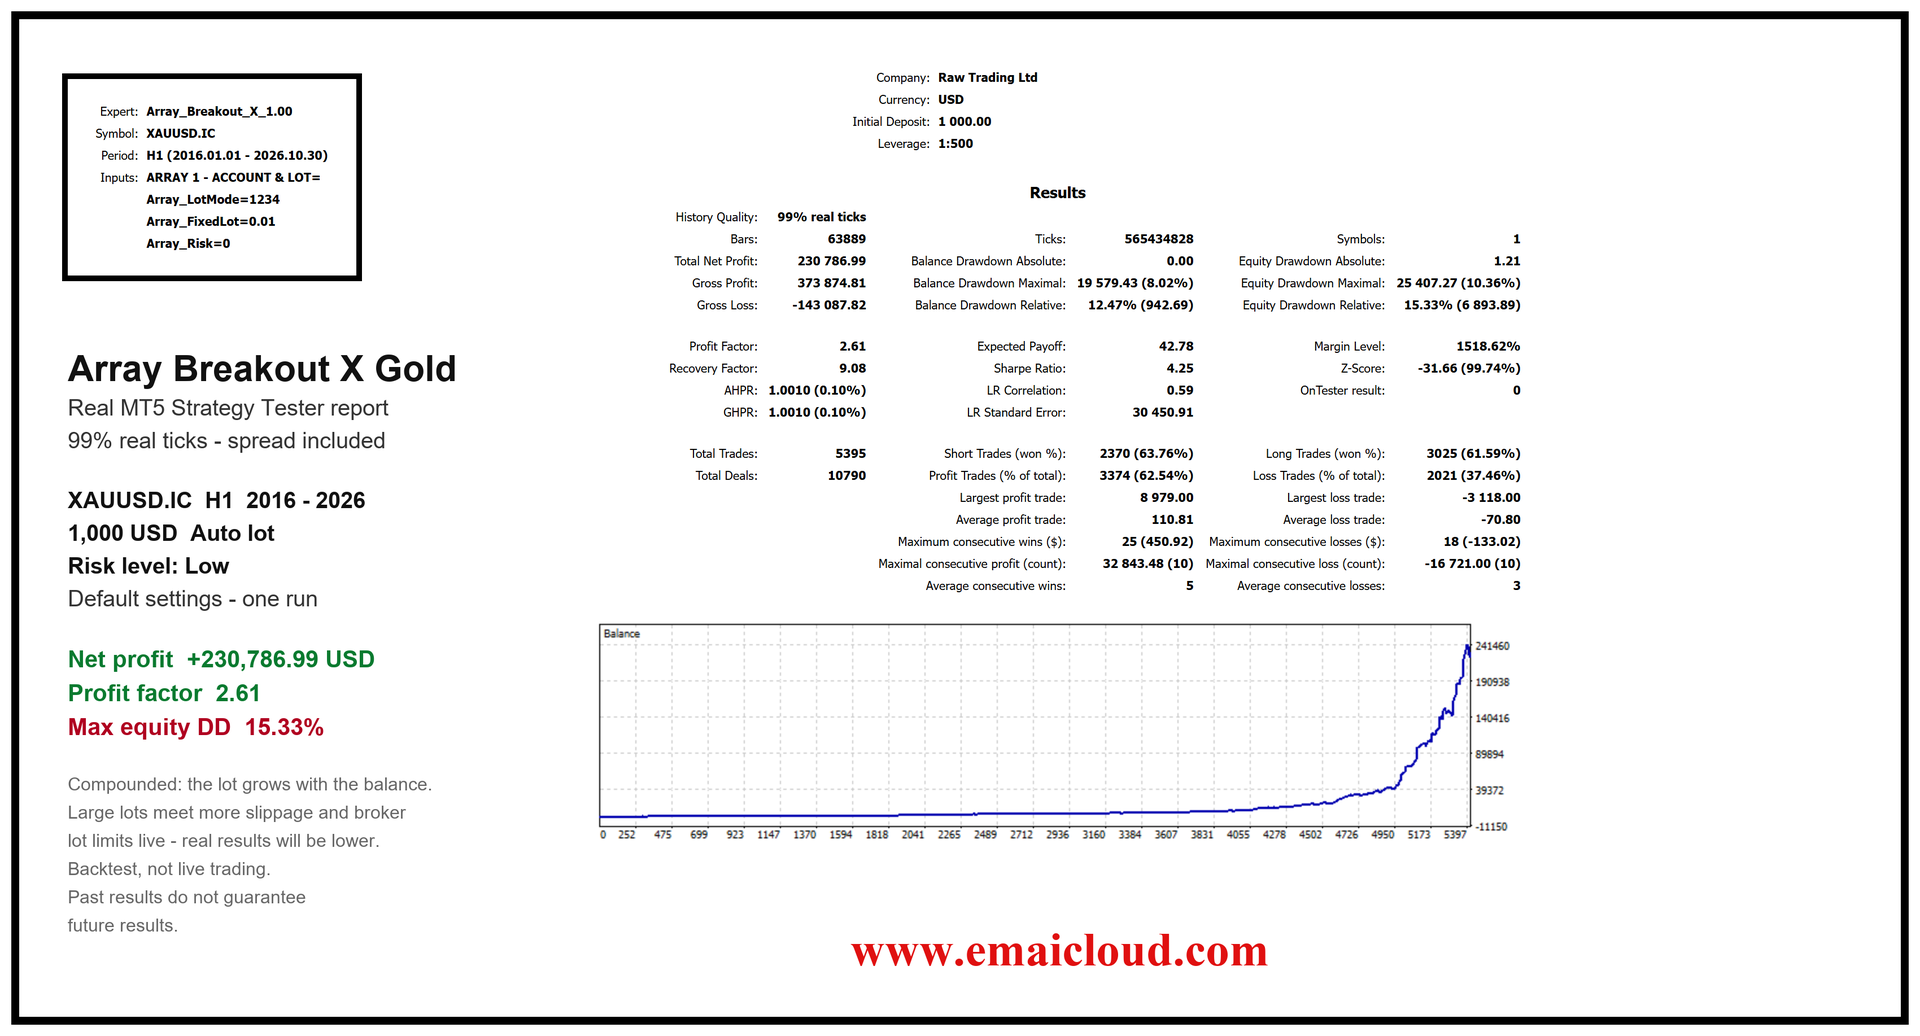
Auto lot
Profit factor 2.61 · Maximum equity drawdown 15.33% · 5,395 trades. The lot grows with the account, so the result is compounded; we do not quote it as an expected return.
 ]
At a fixed 0.01 lot the trades are almost the same as in the 500 USD run below, so the profit in USD is almost the same; the drawdown in percent is smaller because the account is twice the size.
---
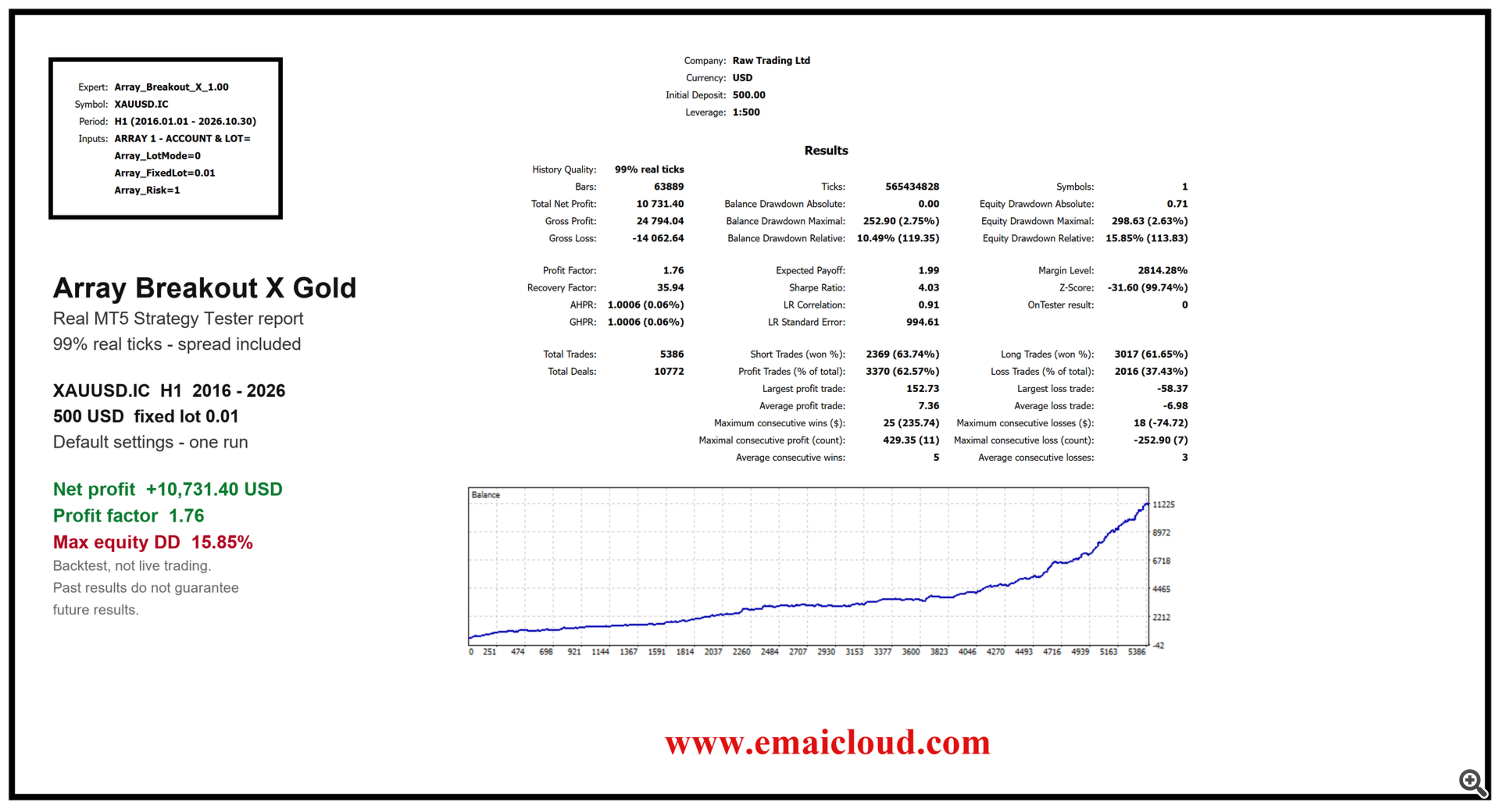
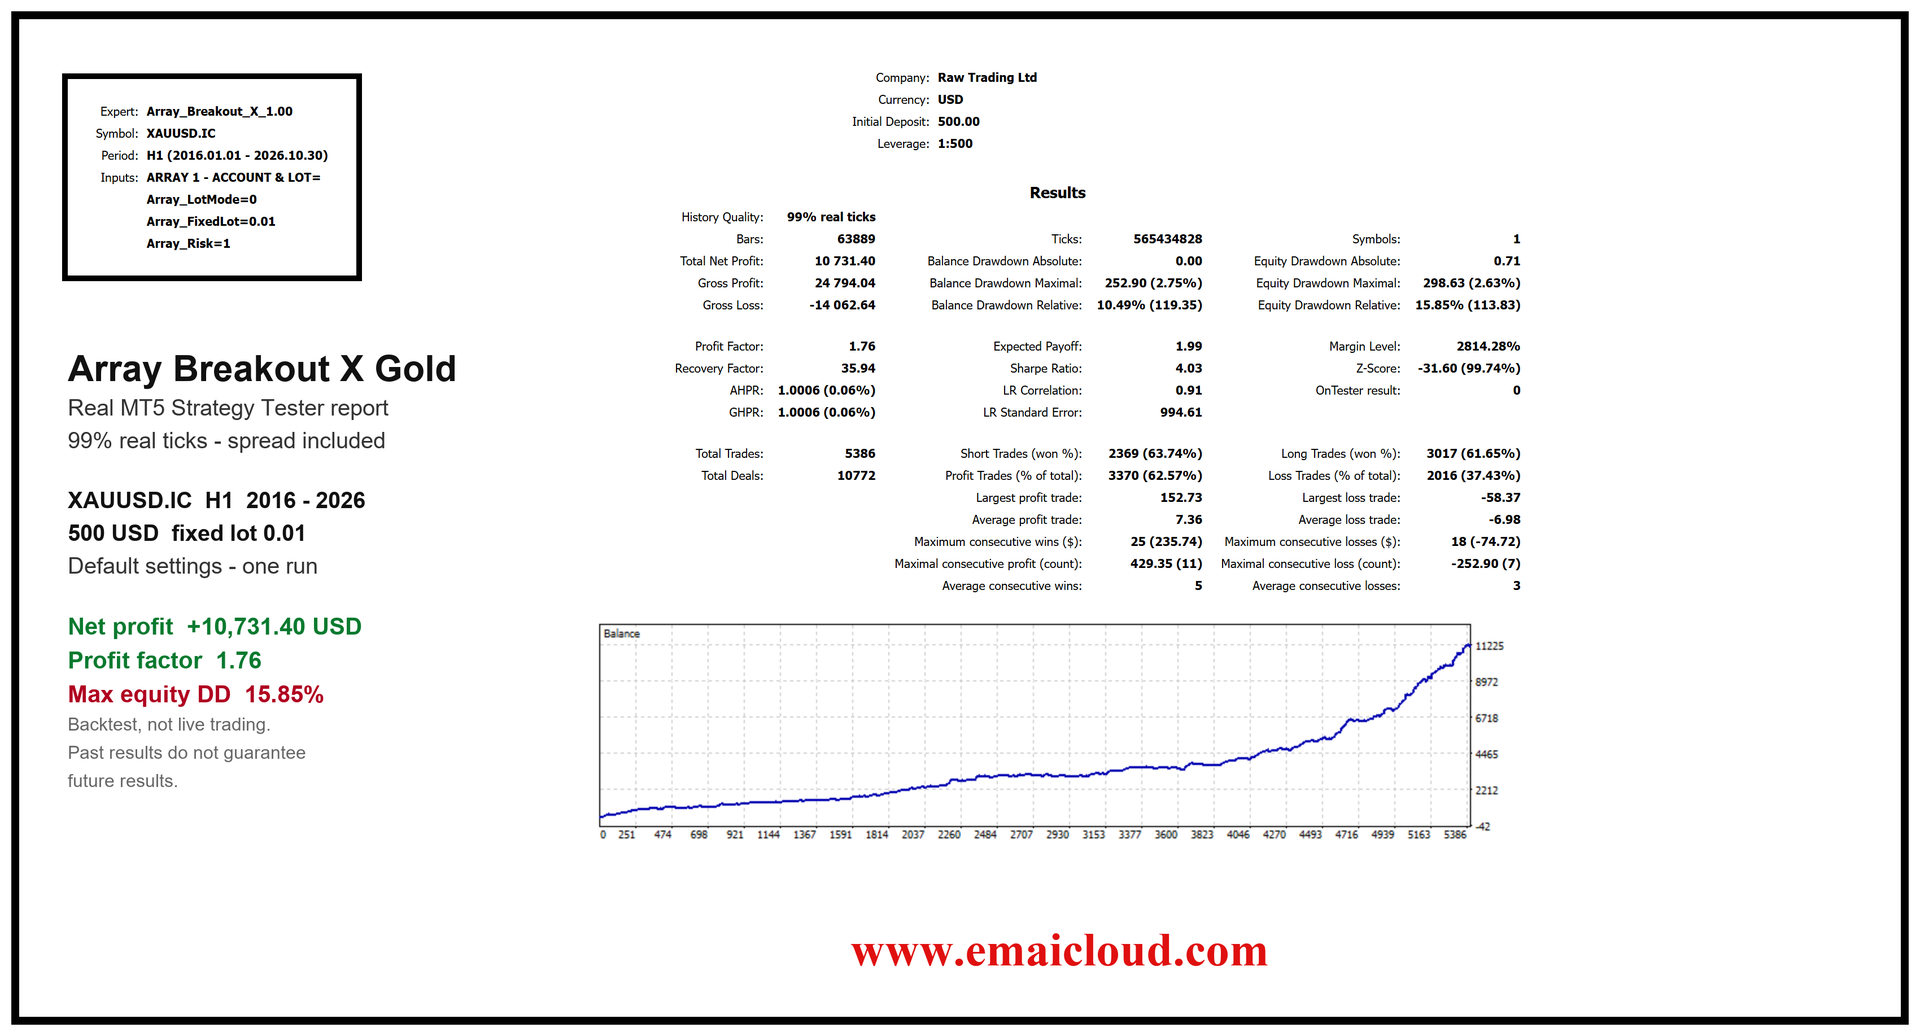
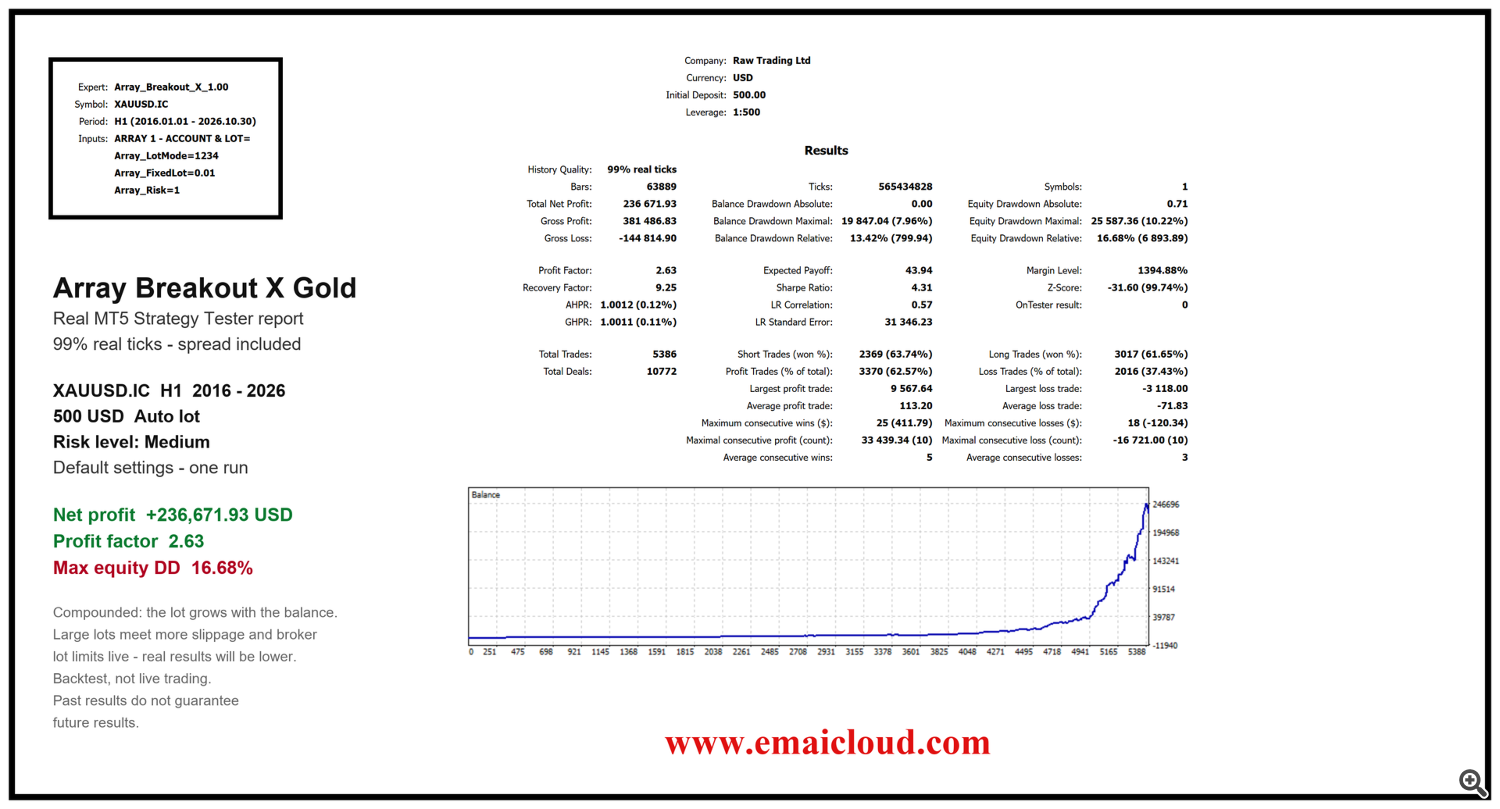
3. 500 USD · risk level Medium (1 January 2016 – 30 October 2026)
Fixed 0.01 lot
Net profit +10,731 USD · Maximum equity drawdown 15.85% · Profit factor 1.76 · 5,386 trades (about 42 a month)
[ ]
 ]
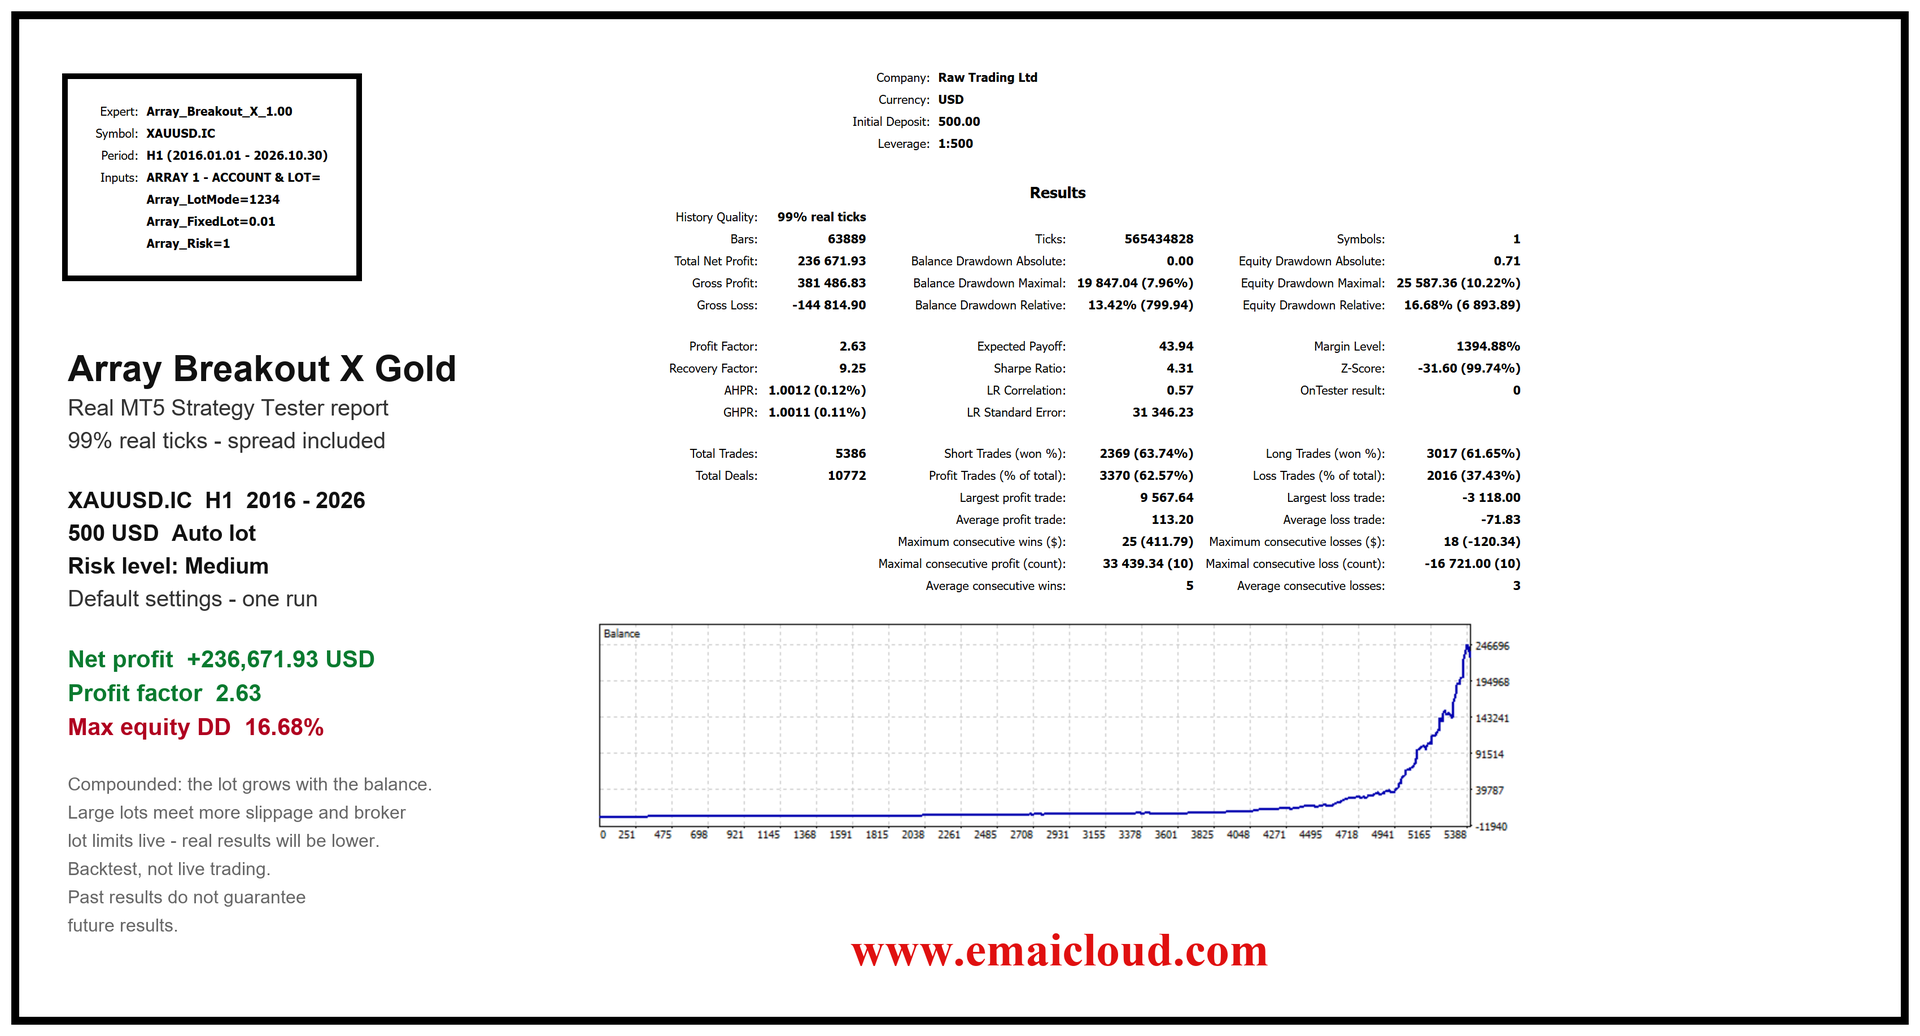
Auto lot
Profit factor 2.63 · Maximum equity drawdown 16.68% · the same 5,386 trades. The lot grows with the account, so the result is compounded; we do not quote it as an expected return.
[ ]
 ]
---
4. Year by year
Cut from the 500 USD fixed-lot run above. The lot stays at 0.01 all the way, so the USD figures compare directly from year to year. Each year starts where the previous one ended.
Year — Trades — Net profit — Profit factor — Deepest balance fall inside the year
2016 — 443 — +637 USD — 1.89 — 107 USD
2017 — 438 — +208 USD — 1.34 — 119 USD
2018 — 481 — +194 USD — 1.25 — 96 USD
2019 — 477 — +573 USD — 1.77 — 84 USD
2020 — 522 — +895 USD — 1.68 — 118 USD
2021 — 566 — +27 USD — 1.02 — 206 USD
2022 — 563 — +520 USD — 1.40 — 131 USD
2023 — 460 — +598 USD — 1.59 — 193 USD
2024 — 450 — +1,140 USD — 2.03 — 211 USD
2025 — 548 — +2,288 USD — 2.02 — 223 USD
2026 (to 30 October) — 438 — +3,651 USD — 2.38 — 253 USD
Every year ended in profit. Read the thin years too: 2021 earned 27 USD in a whole year, and 2017 and 2018 earned about 200 USD each. The recent years are much stronger than the early ones; do not take them as the normal year.
---
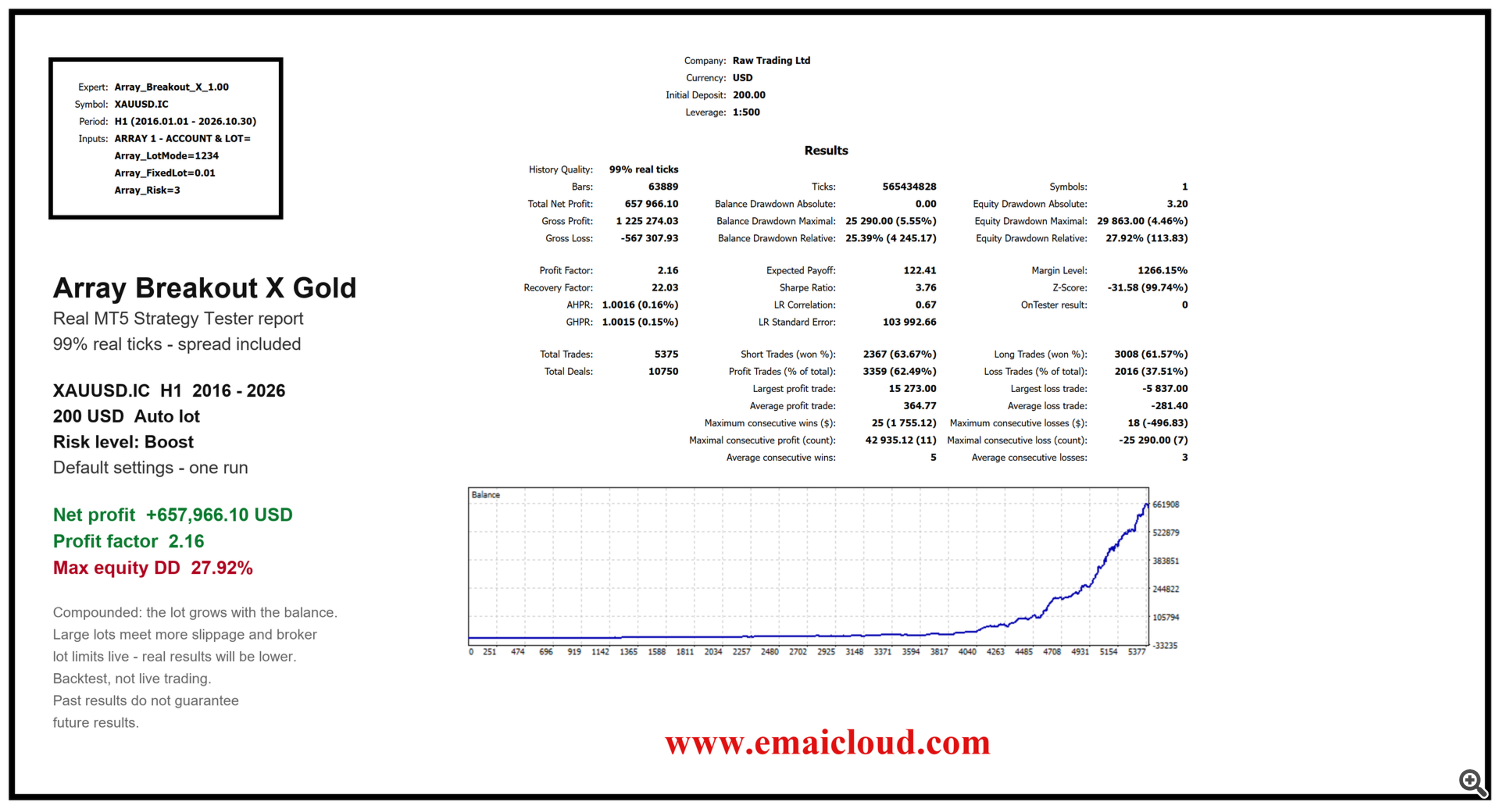
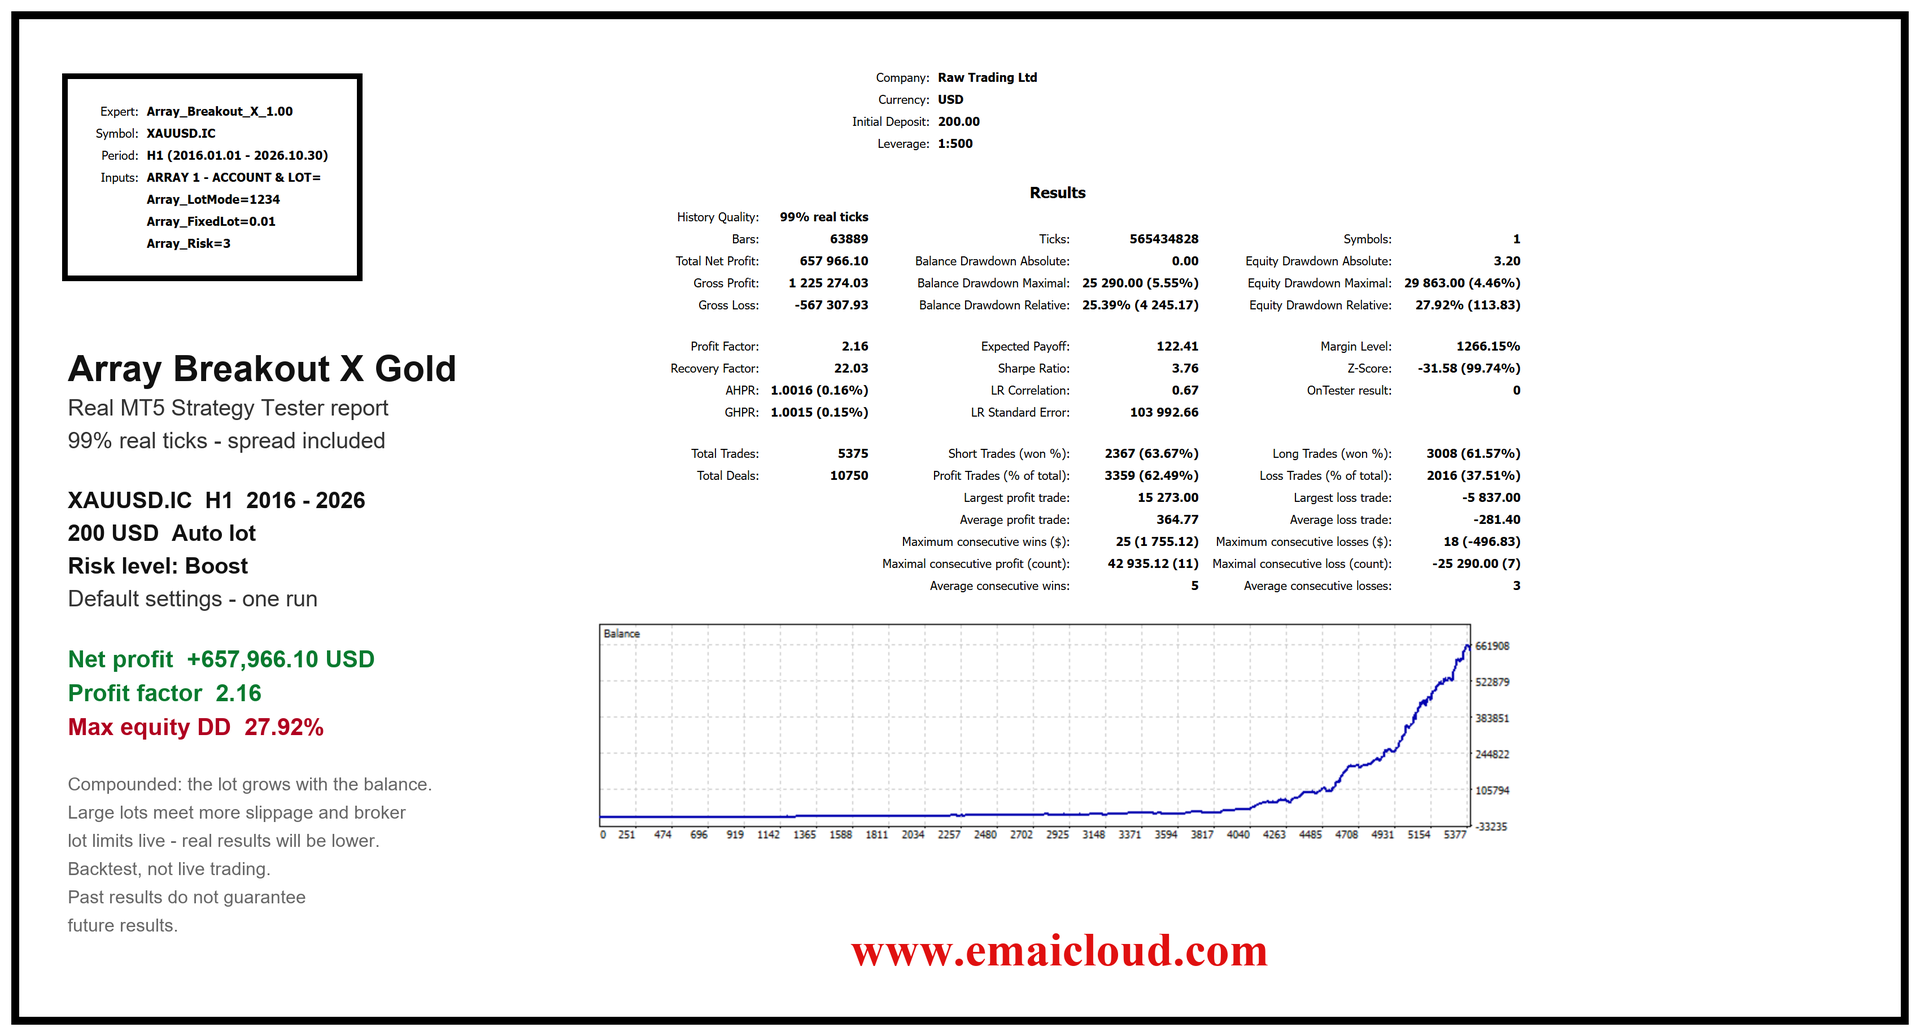
5. 200 USD · risk level Boost · Auto lot (1 January 2016 – 30 October 2026)
Profit factor 2.16 · Maximum equity drawdown 27.92% · 5,375 trades.
Boost is the fastest and the deepest of the four levels. This run started in a good year; a start in a poor stretch looks different. The result is compounded, and most of the growth came in the last three years.
[ ]
 ]
---
6. What this does not tell you
A backtest is evidence, not a promise. The market ahead need not look like the last ten years, and live trading has slippage, commission and server response time that the tester does not, so live results differ from test results. Large lots meet more slippage in a real market than in the tester.
Buyers receive every Strategy Tester report file in full, to open in their own MetaTrader 5 and check trade by trade.
Start here: https://www.mql5.com/en/blogs/post/776650
Broker, account and VPS: https://www.mql5.com/en/blogs/post/776651
Public chat: https://www.mql5.com/en/messages/039ba4cf484bdd01
---
*Trading gold on margin carries a high level of risk and is not suitable for everyone. Past performance does not guarantee future results. Array Breakout X Gold is a software product, not investment advice.*




