![[VISTmany + AI]: Accelerating Research into Time in Financial Markets](https://c.mql5.com/6/1033/splash-776742.png "[VISTmany + AI]: Accelerating Research into Time in Financial Markets")
[VISTmany + AI]: Accelerating Research into Time in Financial Markets

From calculated LAPs to a new generation of temporal research
VISTmany is a research project focused on studying the influence of time on financial-market behaviour.
Its practical foundation already exists. The iVISTscalp5 MT5 indicator calculates Liquidity Activation Points (LAPs) and related parameters for financial instruments. LAPs can be calculated for different timing intervals, and the MT5 system provides forecasts one full week ahead.
This has already become part of the practical workflow of the project.
Future timing forecasts have been published in advance through the VISTmany Telegram channels, followed by subsequent market observation and documented trading videos on YouTube. The archive contains 800+ videos based on advance timing forecasts.
For the trader, the practical value is simple: future temporal points reduce the need to spend hours searching charts for possible entry moments. Instead of continuously searching for when the market may become active, the trader already has a calculated temporal framework and can concentrate on market context, price behaviour and the final trading decision.
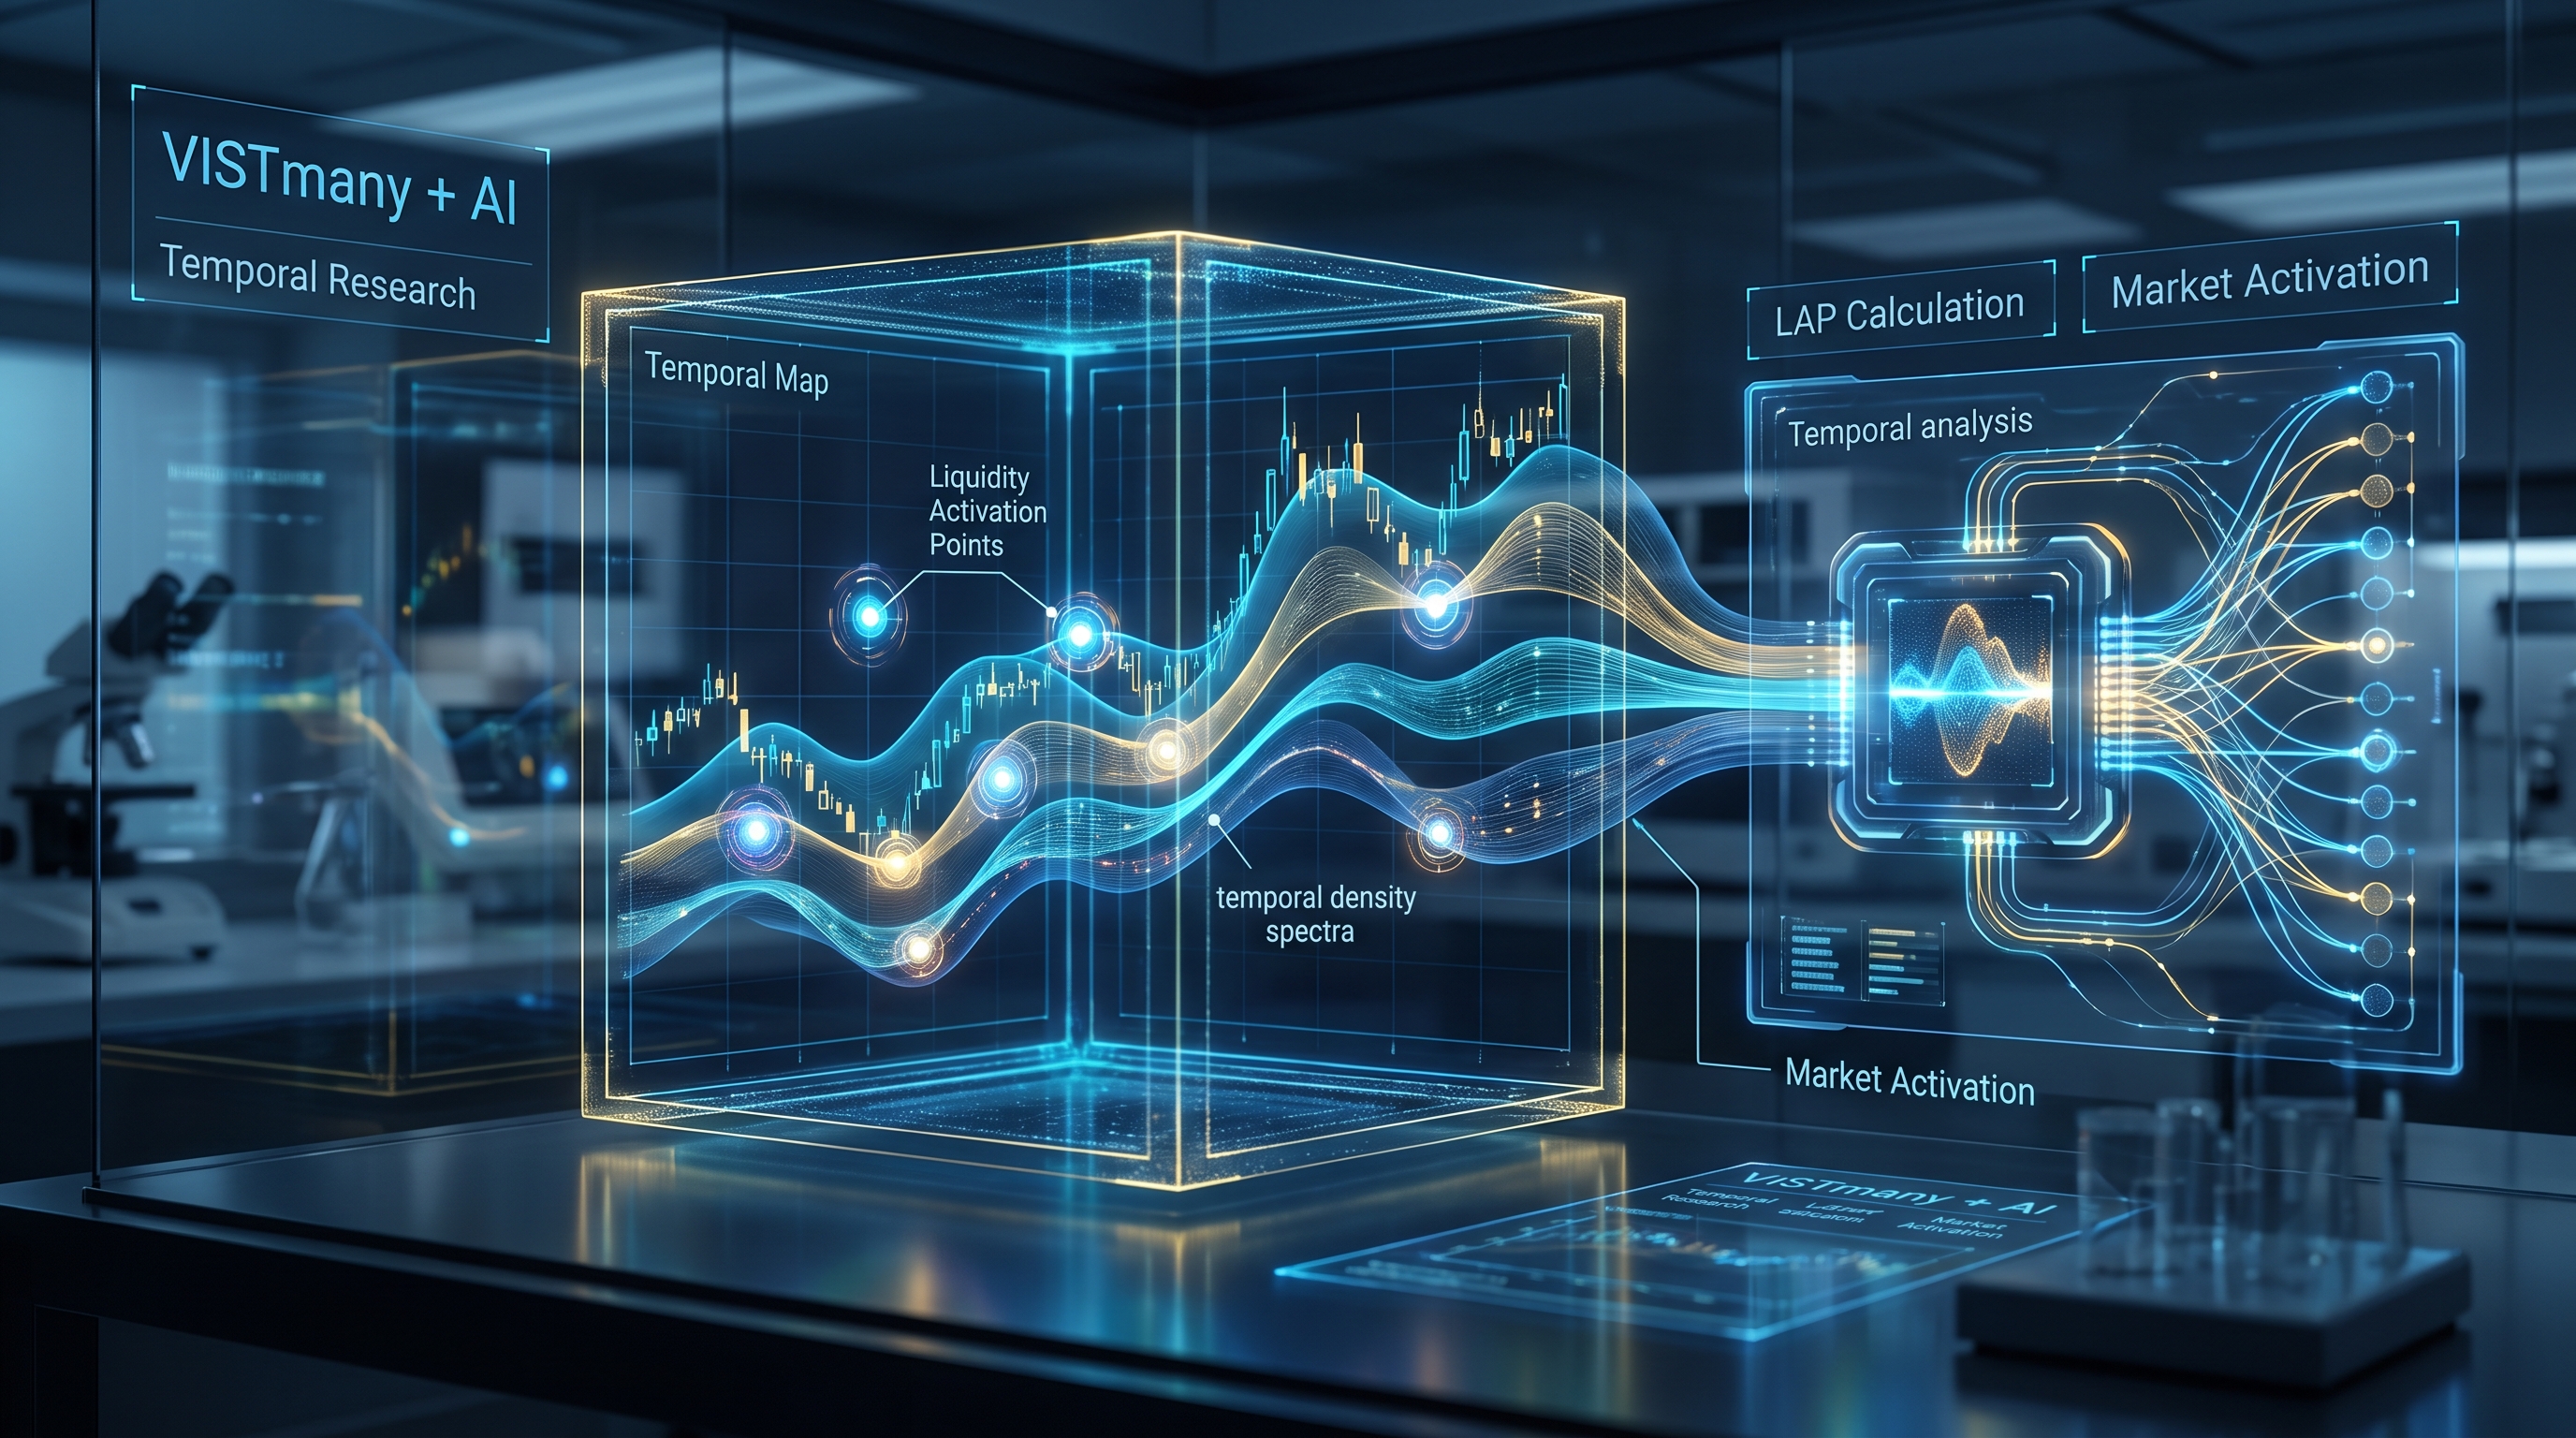
AI changes the speed of research
The next stage of VISTmany development is not about creating the temporal calculation itself.
It is about making the research cycle much faster.
The project already produces a large amount of structured temporal data. Every calculated LAP can become a research observation containing:
• time;
• timing interval;
• direction;
• expected movement;
• TimeLife;
• position within a temporal spectrum;
• interaction with other timing intervals;
• subsequent market reaction.
AI can process such datasets much faster than traditional manual analysis.
It can automatically:
• group and classify LAPs;
• calculate large numbers of statistical samples;
• compare timing intervals;
• detect recurring temporal structures;
• analyse horizontal and vertical spectra;
• measure Temporal Density;
• study Energy and Expected Points;
• compare Alignment and Divergence;
• analyse TimeLife and its stages;
• identify candidate patterns for further research;
• generate statistical tables and visualizations;
• accelerate development of research software.
The key principle is:
VISTmany calculates the temporal structure. AI accelerates the analysis of that structure.
From one indicator to a research ecosystem
This approach makes it possible to develop new research instruments without changing the underlying LAP calculation.
For example, iVISTscalp5 combines Time + Price, allowing future LAPs to be studied together with price structure.
A separate VISTmany research indicator already uses the same LAP calculations with a different visualization approach, focusing on temporal structure rather than price levels.
The next logical step is to bring such visualization directly to the VISTmany website.
A future web-based system could automatically calculate and display a Temporal Map for any supported financial instrument:
LAP calculation → data processing → statistical analysis → temporal map → visual research.
The map could show future LAPs, timing intervals, direction, Expected Points, TimeLife, Energy, temporal density, spectra and areas where different temporal structures converge.
This would turn complex internal calculations into a simple visual representation of the future temporal space of the market.
AI as an accelerator of new VISTmany research
The existing research already provides a foundation for new questions.
For example:
Temporal Compression — does the distance between consecutive LAPs decrease before faster price realization?
Energy Dynamics — does the evolution of Energy provide more information than its absolute value?
Temporal Density — how does the concentration of temporal structures relate to market activation?
Alignment / Divergence — what happens when previously aligned temporal scales begin to diverge?
TimeLife Age — does the behaviour of a temporal structure depend on how much of its TimeLife has already elapsed?
Start Price Clusters — do different timing intervals repeatedly activate from similar price regions?
These are not separate ideas disconnected from the existing system. They can be studied directly from the temporal data already generated by VISTmany.
AI makes it possible to move through these research questions faster:
calculate → collect → process → compare → analyse → visualize → formulate the next question.
Time as a research coordinate
Independent financial research also continues to investigate the temporal dimension of markets.
Recent studies examine topics such as:
• when machine-learning signals are realized in market returns;
• intraday return anomalies across different time horizons;
• time-of-day effects in Bitcoin options;
• intraday volatility and liquidity patterns;
• temporal seasonality in exchange-rate markets;
• time-of-day structures across global cryptocurrency markets.
These studies use different datasets and methodologies and address different research questions. They form a broader scientific context for studying the role of time in financial markets.
VISTmany develops its own research direction within this broader field, using future calculated LAPs as a temporal coordinate and studying their interaction with subsequent market behaviour.
The next stage of VISTmany
The major opportunity created by AI is therefore not another trading feature.
It is research acceleration.
The existing VISTmany infrastructure can generate future temporal structures one full week ahead. AI can help process the resulting data, perform statistical analysis, develop new research modules and transform complex temporal relationships into simple visual maps.
This creates a new research cycle:
Future LAP → Data → Statistics → Temporal Structure → Analysis → Visualization → New Research
The foundation already exists.
AI makes it possible to develop the next layers of VISTmany faster, deeper and more systematically.
Selected parallel research
• When Do Machine-Learning Equity Signals Realize? Evidence from the S&P 500 and KOSPI — Finance Research Letters, 2026.
ScienceDirect
• Intraday and overnight return anomalies: Evidence from 11.6 million price observations — Finance Research Letters, 2025.
ScienceDirect
• Time-of-day effects in the Bitcoin options market — Finance Research Letters, 2026.
ScienceDirect
• The crypto world trades at tea time: intraday evidence from centralized exchanges across the globe.
Springer Nature



