The drawdown on a product page is a floor: why we tell you to plan Index Cadence for 25 to 35 percent

Most EA listings print a drawdown and leave you to read it as the worst case. The Index Cadence listing prints 16.9%, and two sentences later tells you to plan for 25 to 35 percent. This post is about why, and about what to do with that number when you decide how much money to put behind a robot, ours or anyone else's.
What the 16.9% actually is
It is the worst equity drawdown in one Strategy Tester run: the default Balanced package, 1.00% risk per trade, a 3000 USD account, January 2020 to June 2026. Over that window the robot made about 57% a year, on about 275 trades a year, flat before the close every day.
That window is not a quiet one. It includes the COVID crash of March 2020 and the 2022 rate shock. Even so, 16.9% is one number from one path through one stretch of history. A different stretch would have produced a different number, and nothing says it would have been smaller.
Why one path is not the worst case
A drawdown is the deepest hole the account happened to fall into. It depends on which losing streaks arrived together and on what the market was doing while they did. Fewer than half of these trades make money, by design, so runs of losses are part of the system and the order they arrive in is luck. The figure on the page is a floor for what you should expect, not a ceiling.
The better question is what happened when the same rules met prices they were not built on. On an out-of-sample window the same mechanism drew down roughly twice as deep. That is where the 25 to 35 percent comes from.
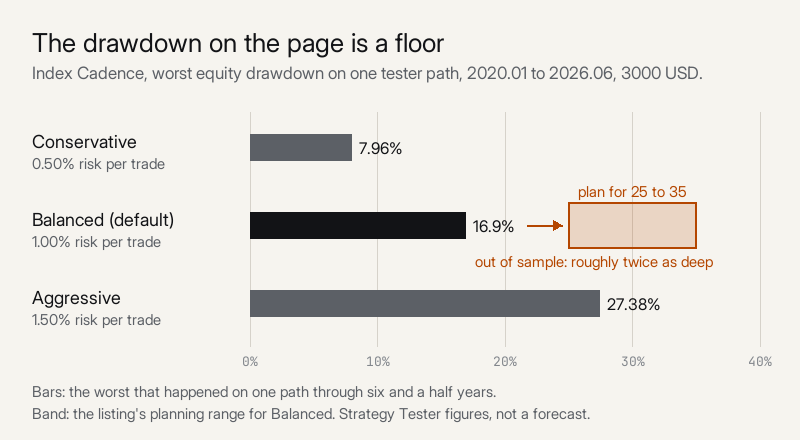
The chart shows the three risk packages as they measured on the same path, and the one planning range the listing gives, which is for Balanced. The other packages carry the same caution. If you choose Conservative because 7.96% looks comfortable, do not treat 7.96% as the most it can lose either.
The out-of-sample test, including the part that looks bad
Our index CFD history starts in 2020, so the only earlier test available was on the S and P 500 for 2017 to 2019. It is a different index, and it is not a flattering result.
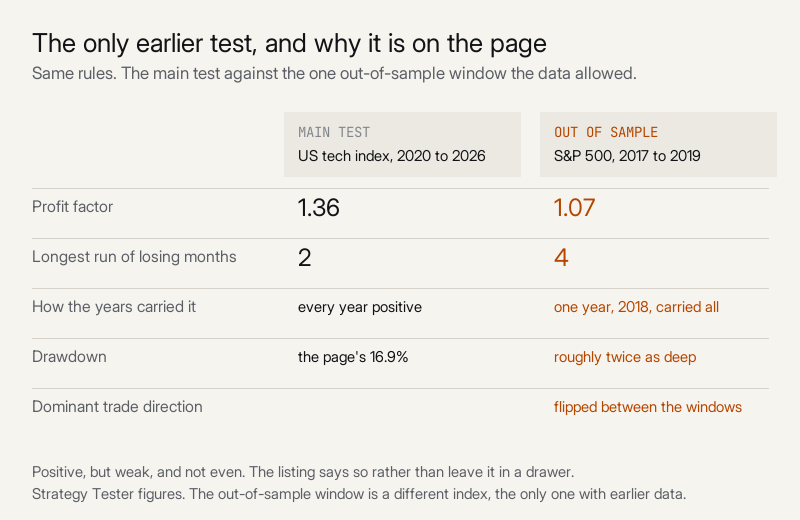
The profit factor was 1.07: positive, but weak. One year, 2018, carried all of it, while 2017 and 2019 were flat to slightly negative. The longest run of losing months was four, against two in the main test. And the dominant trade direction flipped between the two windows.
We could have left that test out. It is on the listing because it is the most useful warning we have: the mechanism survived a different market, but only just, and not evenly. A buyer should know that before paying, not after the first bad quarter.
How to use this when you size an account
Take the planning range, not the tester's number. On a 3000 USD account at the Balanced default, 25 to 35 percent is 750 to 1050, measured from the account's last high. If you would switch the robot off somewhere inside that range, you would most likely switch it off in the stretch just before a recovery, which is the worst moment to stop.
If that range is more than you can sit through, you have three honest choices: the Conservative package, a smaller share of your capital, or a different robot. Turning it off halfway down is not one of them.
One more thing on account size. Below about 2000 USD the broker's minimum lot starts to decide the position size instead of your risk setting. The listing measures that on 500 USD, and the drawdown there is deeper. Read that section before you go small.
What no test here can tell you
Two thirds of the profit comes from the first 45 minutes after the US cash open. A broker whose spread widens sharply there will cost you more than any of the five brokers we measured, where the result ran from 9.9% worse to 5.9% better than our primary feed. The news filter cannot be tested at all, because the economic calendar is not available inside the MetaTrader strategy tester. And no backtest shows a live fill.
That last part is what a real account is for. TechnoTrader EA Showcase runs Index Cadence at factory defaults, alongside Gold Tempo and Bitcoin Interval, on one small real account. Three robots share it and its curve belongs to the three together, so read it for the plumbing and not for a verdict.
The short version
A drawdown figure answers one question: how bad did it get, once, on one path. The question you need answered before you buy is how bad it can get while you still keep it running. We would rather you sized for the second one.
The listing, with the risk packages, the losing streaks and the full out-of-sample note, is Index Cadence TechnoTrader.




