Execution Caliper is live: a free meter for what your account charges an EA

Today I published a free utility on the Market called Execution Caliper. This post is the record of what it measures, what it deliberately refuses to do, and how it ended up with a different name and a different job from the one I started with. If you follow this blog for the gold EA diary, this is the instrument that grew out of the same measurements.
What it measures
It sits on one chart and measures what your account charges on that symbol: spread by hour of day from up to sixty days of tick history, commission read from your own fills, swap for the position the EA would hold overnight, and the weekend gaps of the last fifty-two weeks. Then it divides that cost by the stop width of the EA you are thinking of running. The output is one ratio, cost as a share of your stop. I call it the execution tax, and the panel writes it as the Greek letter tau.
The ratio is split into two factors, because the two things it mixes have different owners. The first factor is the environment, the cost per unit of typical range on your account, which only your broker and your account type can change. The second factor is the design, how many units of typical range the EA's stop covers, which only the EA's author can change. When the ratio is high you can see at a glance whether your account is expensive or the stop is simply thin.
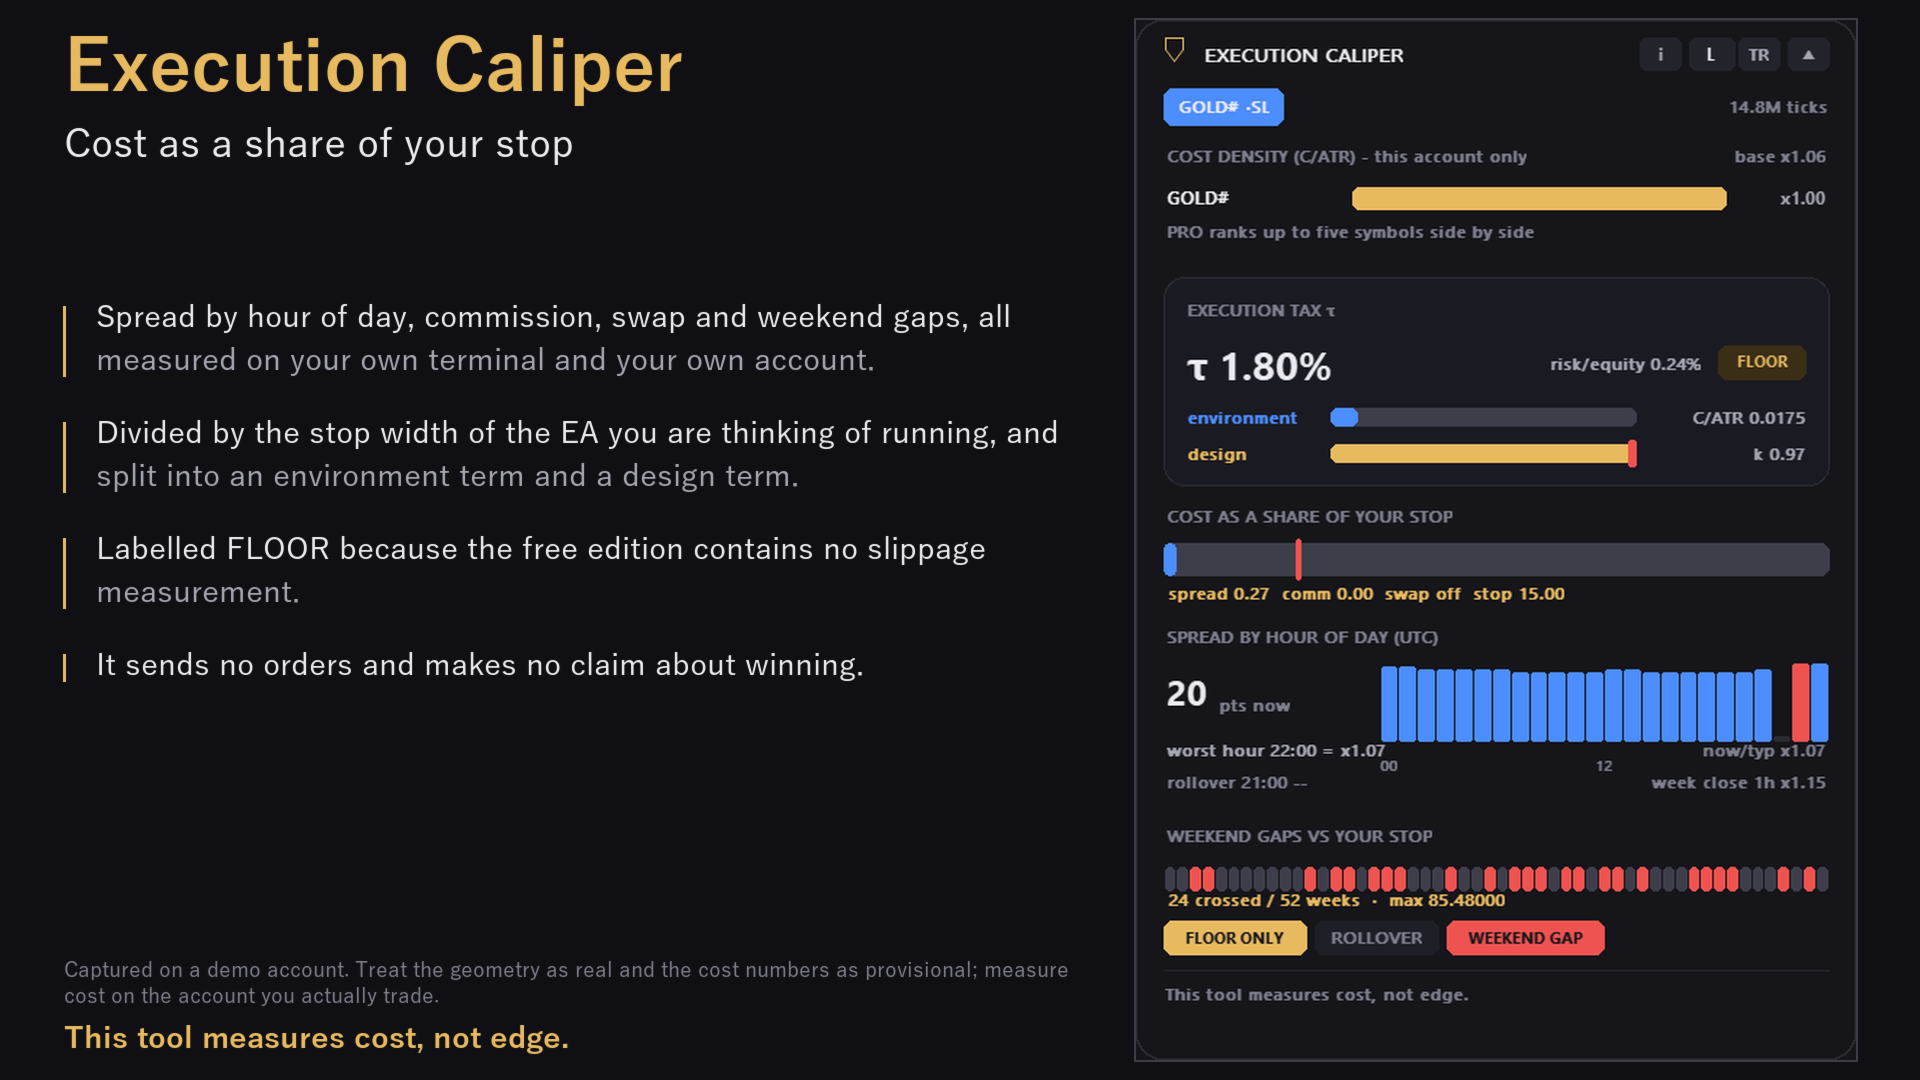
The screenshot is a demo account on GOLD#: a spread of 0.27 against a stop of 15.00 gives 1.80 percent before slippage. On US100Cash# on the same demo the ratio was 6.56 percent, and most of it was not spread. It was swap, 4.61 against a spread of 1.95. On this account, an EA that holds this index CFD even one night pays more in interest than in spread, and the panel makes that visible without anyone having to read a contract specification.
Why it exists
The figures in this paragraph are not mine. They come from public signal statistics for someone else's EA, which I re-measured; the signal identifiers, the recomputation and the three corrections to my own earlier tables will follow in a separate post on this blog, so the claim can be checked rather than taken on trust. The same program, over the same period, run on three different accounts, produced profit factors of 1.08, 1.79 and 2.39. The win rate was the same on all three. The only difference was the price at which orders were filled. When you buy an EA you are entering two lotteries, the EA and the account, and the second one is rarely measured before the money is at risk. The free edition measures the part of it that can be measured without sending an order.
What it refuses to do
It sends no orders and opens no positions. It does not touch anything that belongs to other EAs on the terminal. It makes no claim about winning: it does not say an EA is profitable, safe, or better, and it does not score your broker against other brokers. The footer of the panel carries the same sentence at all times, expanded or collapsed: this tool measures cost, not edge.
There is exactly one mark on the panel that carries any judgment. On the cost bar there is a red line at about twenty percent of the stop width. That is the band where my own EAs died of execution cost in live measurement. It is a fact about my EAs, not a law about yours, and the panel does not claim that nothing survives above it. It only marks where I did not.
Why the name changed
The working name for most of the summer was Broker Fitness Gate, and the first design had a three-colour verdict: green, amber, red. The verdict did not survive contact with the data. When I recomputed the reference distribution symbol by symbol instead of pooling everything, the boundaries moved. Then I found that the same EA, on the same account, can carry an execution tax that differs by an order of magnitude between the symbols it trades, because the stop width an EA uses, measured in pips, differs enormously between symbols while the cost of a round trip does not shrink to match. A verdict that changes with the aggregation unit is not a verdict. So the gate was removed and the instrument kept. A caliper measures a gap and hands you the number; it does not tell you whether the gap is good. That is the honest scope of what I can measure on your account, and the name now says so.
Along the way I found and corrected three errors in my own published statistics: mixing symbols in one distribution, choosing thresholds after seeing the data, and pooling different periods and brokers into one number. The tool is built so that those specific mistakes cannot recur inside it. One stop width per symbol. Measurements taken on your account only. Numbers refused rather than estimated when the data is insufficient; the panel prints not measured instead of a guess.
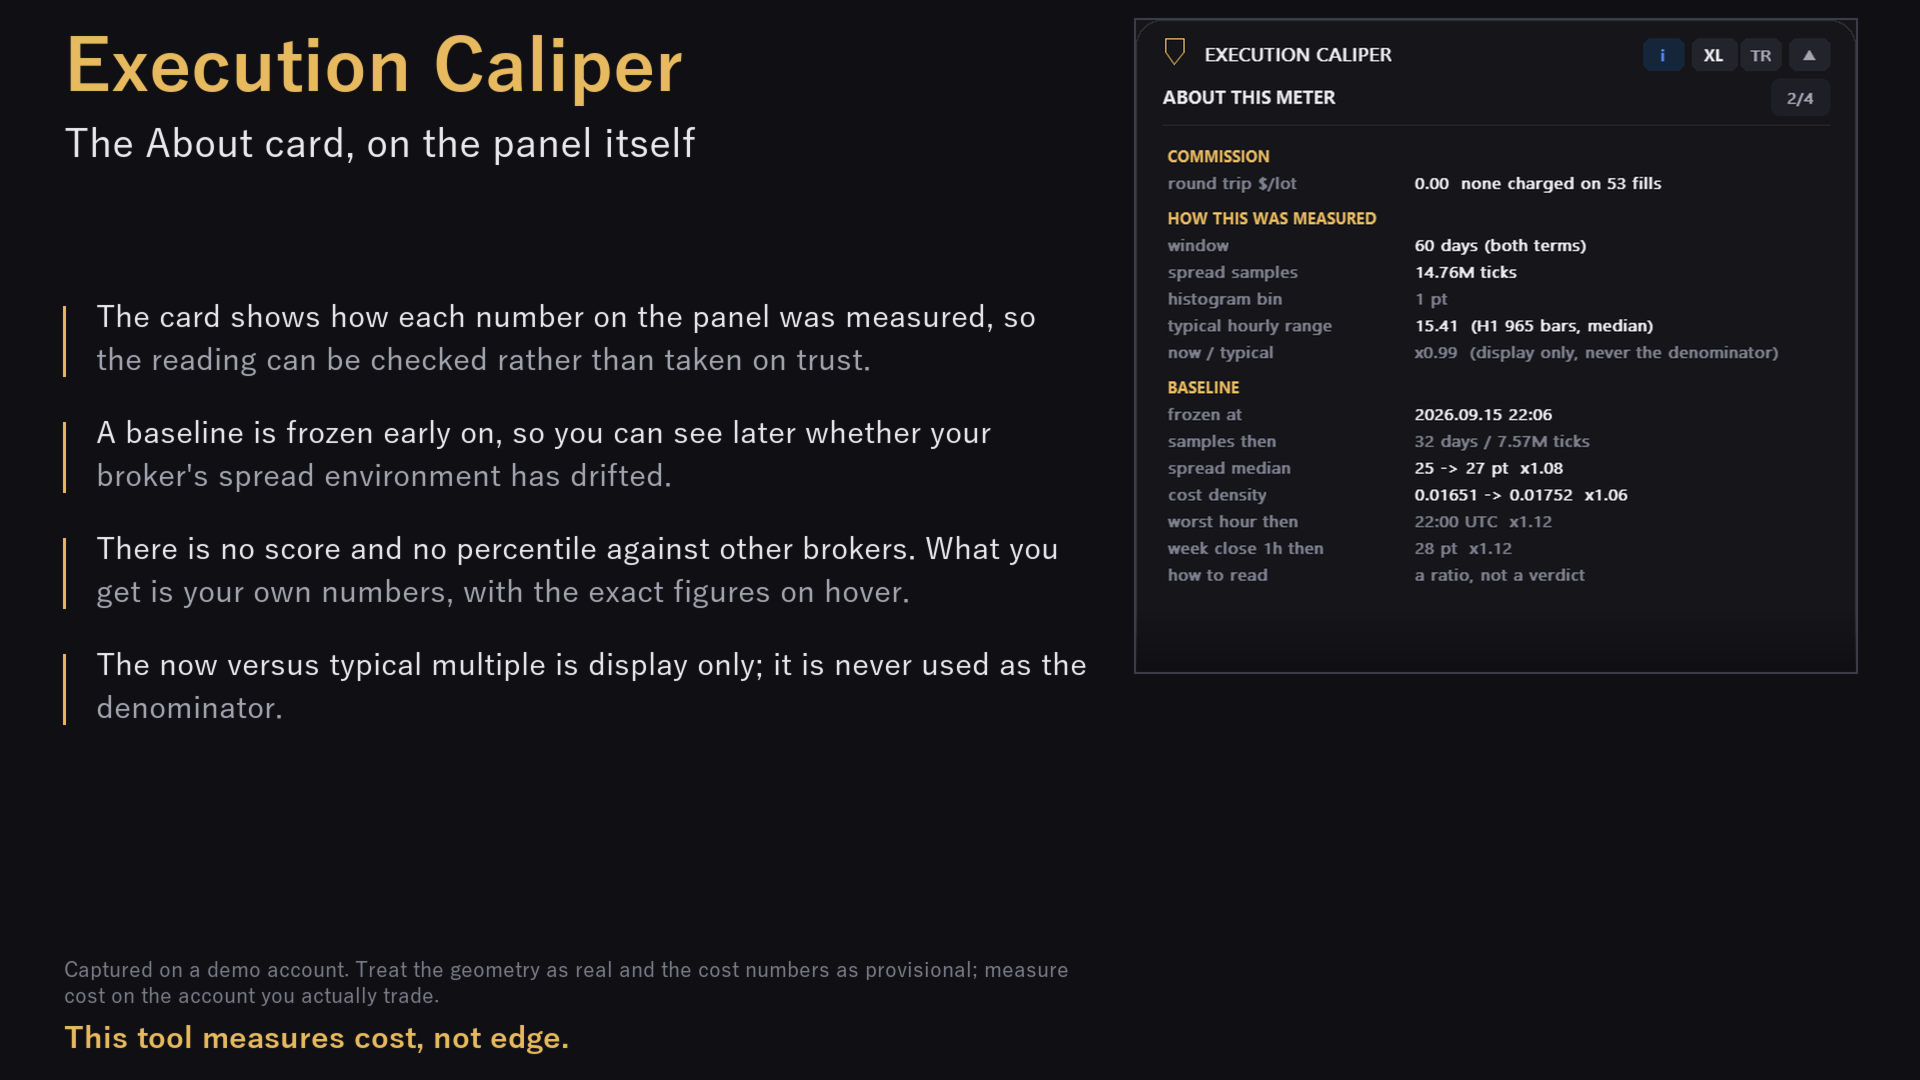
How to check it rather than trust it
The About card on the panel shows how each number was measured: the window, the number of ticks, the histogram bin, the typical hourly range and the bars behind it. A baseline is frozen early on, so weeks later you can see whether your broker's spread environment has drifted from what you first measured. The panel is captured on a demo account in the screenshots, so treat the geometry (stops level, contract size, gap history) as real and the cost numbers as provisional; demo pricing is not guaranteed to match live pricing, and the whole point of the tool is to measure on the account you actually trade.
What is next
A Pro edition is being built. The plan is to compare up to five symbols side by side and to add the part that needs your own account history: forensics per magic number and symbol from your real fills, a reconstruction of the unrealised drawdown that published equity curves do not show, and an alert when the spread regime drifts away from the frozen baseline. The active slippage probe that sends test orders is deliberately not in the first Pro release, because a tool that places orders on a buyer's account needs its own safety design and its own testing before I am willing to ship it.
The free edition is on the Market now: Execution Caliper Broker Cost Meter. If you run it and the numbers surprise you, that is the point. This tool measures cost, not edge.