

A trendline break looks like one event. Price reaches the line, something happens, a trade opens. But "something happens" is not one rule. It is six different rules, and each one answers the same question differently: at what exact moment does a touch become a trade?
Get that moment wrong and the setup itself stops mattering. A perfectly drawn trendline still loses money if the trigger fires too early, too late, or on a wick that never meant anything. This post walks through the six ways a single line can break, what each one is actually built to catch, and when to reach for it.
Why the trigger matters more than the line
Draw the same trendline on the same chart and hand it to five traders, and you get five different entries. One buys the first touch. One waits for a closed candle. One wants distance before committing. One waits for a pullback after the break. One waits to see if the break holds before trusting it.
None of them are wrong. They are answering different questions. Fast entry or confirmed entry. React to the first sign, or wait for proof. The trigger type is the actual strategy decision. The line is just where you're watching.
The six ways a trendline can break
1. Touch. The simplest trigger. The moment price crosses the line, the trade opens. No candle to wait for, no confirmation, just the tick that crosses. It's the fastest possible entry, and the most exposed to noise. A single wide tick through the line is enough, whether or not price keeps going.
2. Breakout. Waits for a full candle. The candle has to open on one side of the line and close on the other. A wick that pokes through and comes back changes nothing, because the trigger only looks at where the candle opened and closed. An optional minimum distance in pips can require the close to clear the line by a margin, not just barely cross it.
3. Full-bar breakout. The stricter version of a breakout. Instead of just the close, both the open and the close of the candle have to sit on the breakout side of the line. A candle that straddles the line, opening on one side and closing on the other, is ignored. This filters out the messy candles a standard breakout would still accept.
4. Distance breakout. Drops the close requirement entirely. Price has to travel a set distance past the line, and the trade opens the instant that distance is covered, mid-candle. It's the fastest of the confirmed triggers. There's no waiting for a candle to finish, just proof that price kept moving after the cross.
5. Pullback. A two-step trigger. First, a candle has to close beyond the line, confirming the break. Then, within the next few candles, price has to wick back to the line before the trade opens. The idea is to catch the retest instead of chasing the initial break, so the entry lands closer to the level instead of further into the move.
6. False breakout. Built for the opposite situation, where the break doesn't hold. The candle's wick pierces through the line, but its open and close both stay on the original side. That's read as a failed break, and the trade opens at the close, in the direction the line held, not the direction the wick pointed.
Six triggers, six different relationships to the same event. Touch reacts fastest and filters least. False breakout waits for the opposite of a break to happen before it acts. Everything else sits somewhere between those two extremes.
Buy and sell, side by side
Each of the six triggers works the same way on both sides of the line, just mirrored: above the line for a sell, below it for a buy. The table below shows all twelve variants next to each other, plus one extra setup at the bottom that isn't a trigger type on its own, but a way of pairing two of them.
| On the chart | Trigger | What opens the trade |
|---|---|---|
| Buy lines | ||
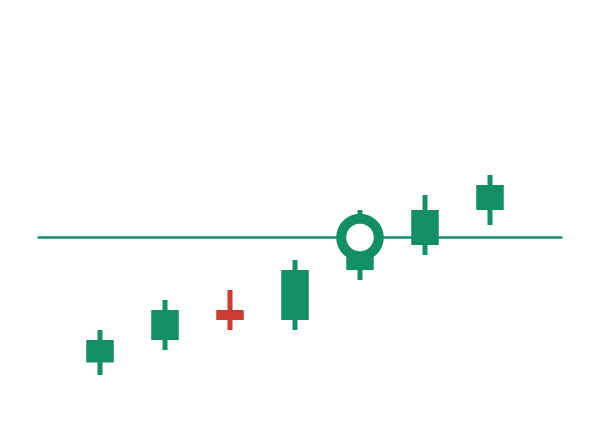 | Buy on touch | Mid-price crosses the line upward and the buy opens. Tick-based, no waiting for the candle to finish. |
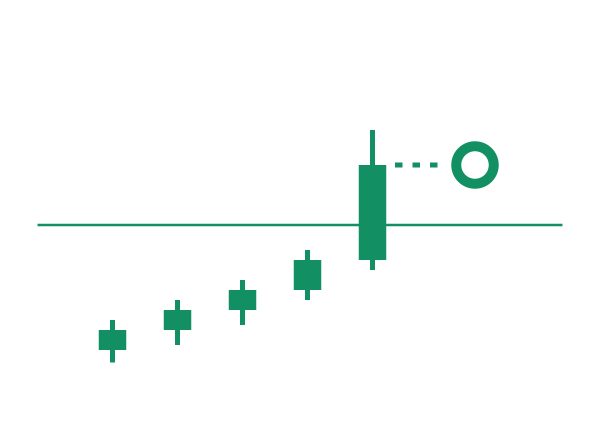 | Buy on breakout | The candle has to open below the line and close above it. A wick through the level opens nothing. An optional minimum distance in pips makes the close clear the line by a margin. |
 | Buy on full-bar breakout | Stricter than a plain breakout: open and close both have to sit above the line, which filters out bars that straddle it. |
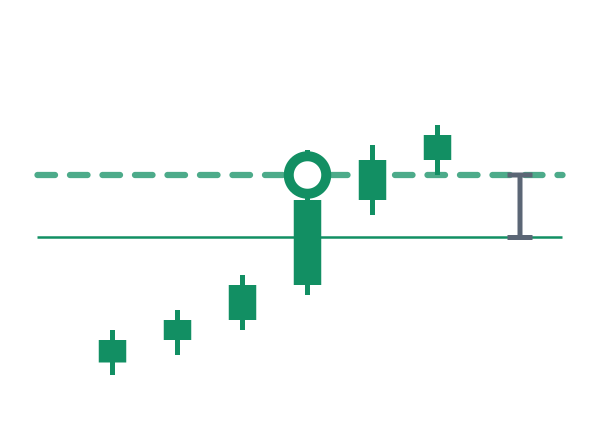 | Buy on distance breakout | No waiting for the close at all. Price has to run a set distance above the line, and the buy goes in the moment it does. |
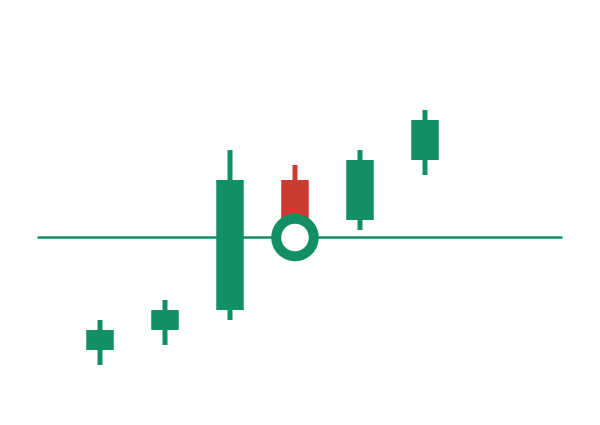 | Buy on pullback | A closed breakout above the line arms it. Within the next few candles (two by default) a wick back down to the line opens the buy; you can require that candle to close above the line instead. |
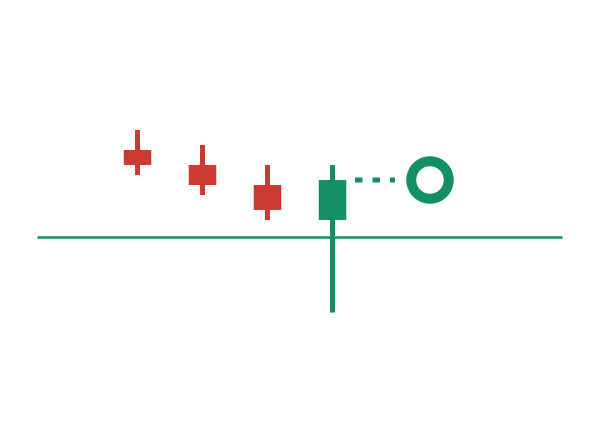 | Buy on false breakout | The candle opens and closes above the line, but its wick pierces below and comes back. The buy goes in at the close, once the level has held. |
| Sell lines | ||
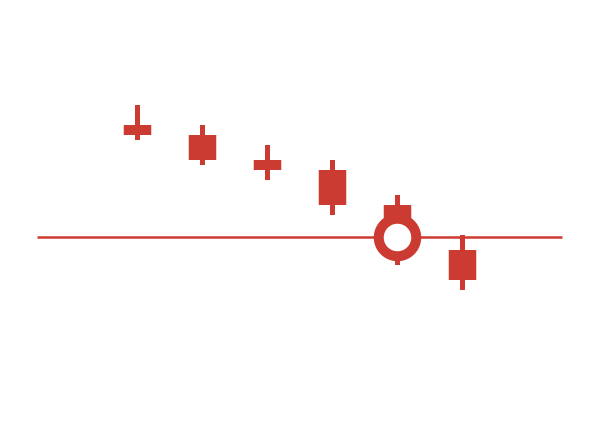 | Sell on touch | Price crosses the line downward and the sell opens, on the tick rather than the close. |
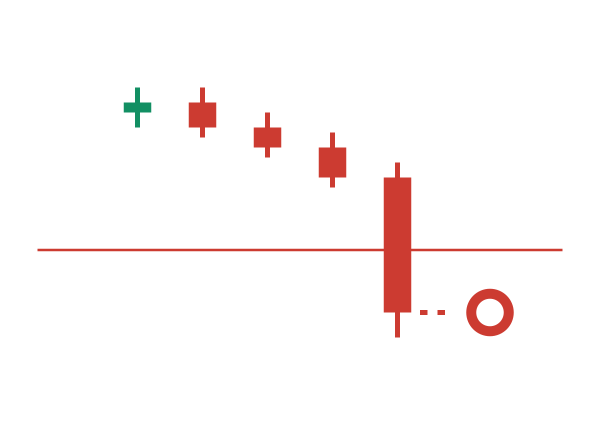 | Sell on breakout | The candle opens above the line and closes below it before the sell goes on. The same optional pip margin applies. |
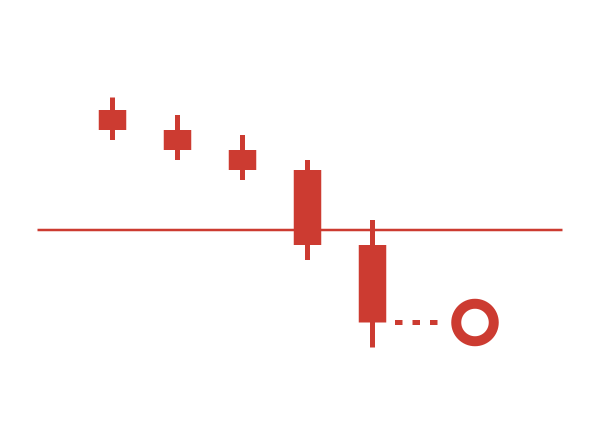 | Sell on full-bar breakout | Open and close both have to finish under the line, so a bar that only dips below it is ignored. |
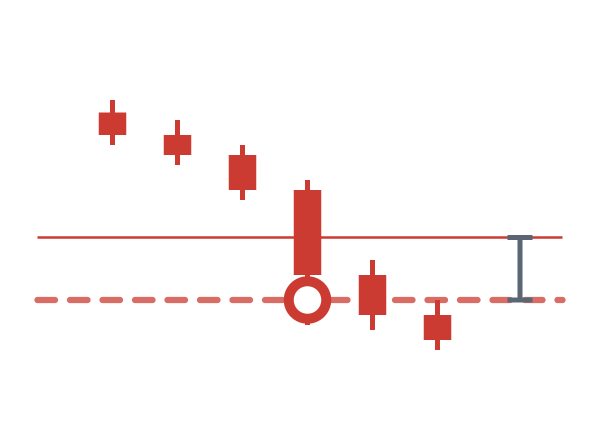 | Sell on distance breakout | Price has to run the set distance below the line, and the sell goes in intrabar, the moment the distance is covered. |
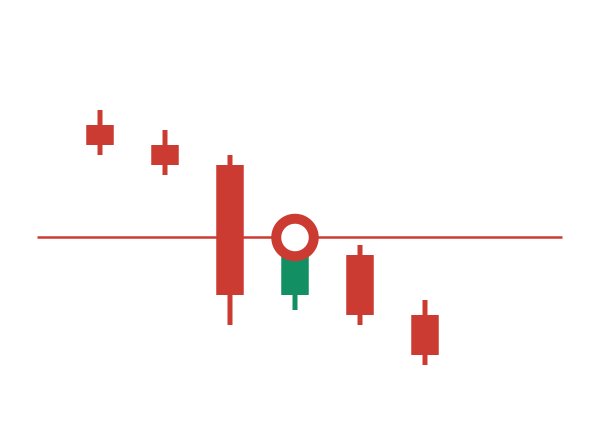 | Sell on pullback | Once a candle has closed below the line, a wick back up to it opens the sell inside the same window of candles. |
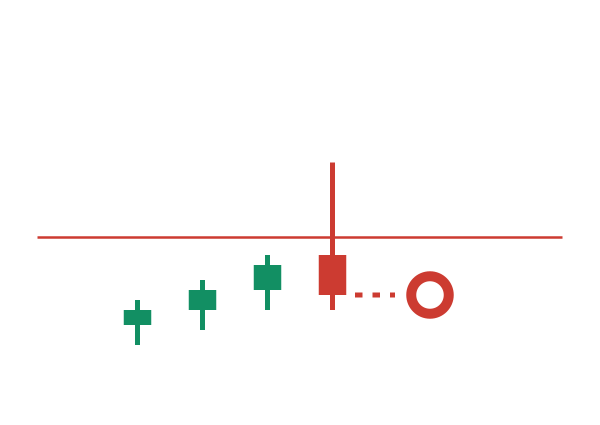 | Sell on false breakout | The candle opens and closes below the line while its wick spikes above it. The sell goes in at the close. |
| Both sides at once | ||
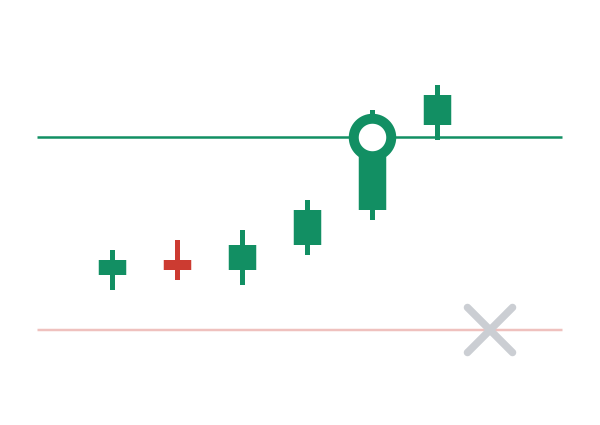 | OCO pair | A buy line above and a sell line below, linked. Whichever side triggers first opens the trade; the other line is removed automatically. |
Picking a trigger for the situation
None of these six is the "correct" one. Each fits a different market condition and a different tolerance for risk.
- Trading a fast market and want to be in as early as possible: touch. Accept that some entries will be noise.
- Want proof the candle finished on the right side before risking anything: breakout, or full-bar breakout if you've been burned by straddling candles.
- Trading a level where you expect a strong, fast move once it breaks: distance breakout, so you're not stuck waiting for a candle to close while price runs.
- Prefer entering closer to the level instead of chasing the break itself: pullback.
- Trading a level that gets tested a lot and tends to produce fakeouts: false breakout, so you're trading the failure of the break rather than the break itself.
- Don't know which direction the level will resolve, only that it will: an OCO pair covers both sides and cancels whichever one doesn't fire.
The line tells you where. The trigger tells you when and how sure you need to be before committing. Knowing the difference between the six is what turns "price broke the trendline" from a vague observation into an actual, repeatable rule.
These are the same six trigger types built into Trendline PRO, so each one can be set per line and executed automatically once the rule is defined on the chart.
Test on a demo account before using on a live account. Trading involves risk.



