How to Read Gold (XAUUSD) Candlestick Charts – A Complete Beginner's Guide


The first step towards becoming a better Gold trader is understanding how to read a candlestick chart.
Gold (XAUUSD) is one of the most actively traded financial instruments in the Forex market. Its price can move rapidly due to economic news, market sentiment, interest rates, US Dollar movements and global events.
Before using any trading strategy or indicator, traders should understand what each candlestick represents, how price moves and what buyers and sellers are doing in the market.
1. What Is a Candlestick Chart?
A candlestick chart is a visual representation of price movement over a specific period.
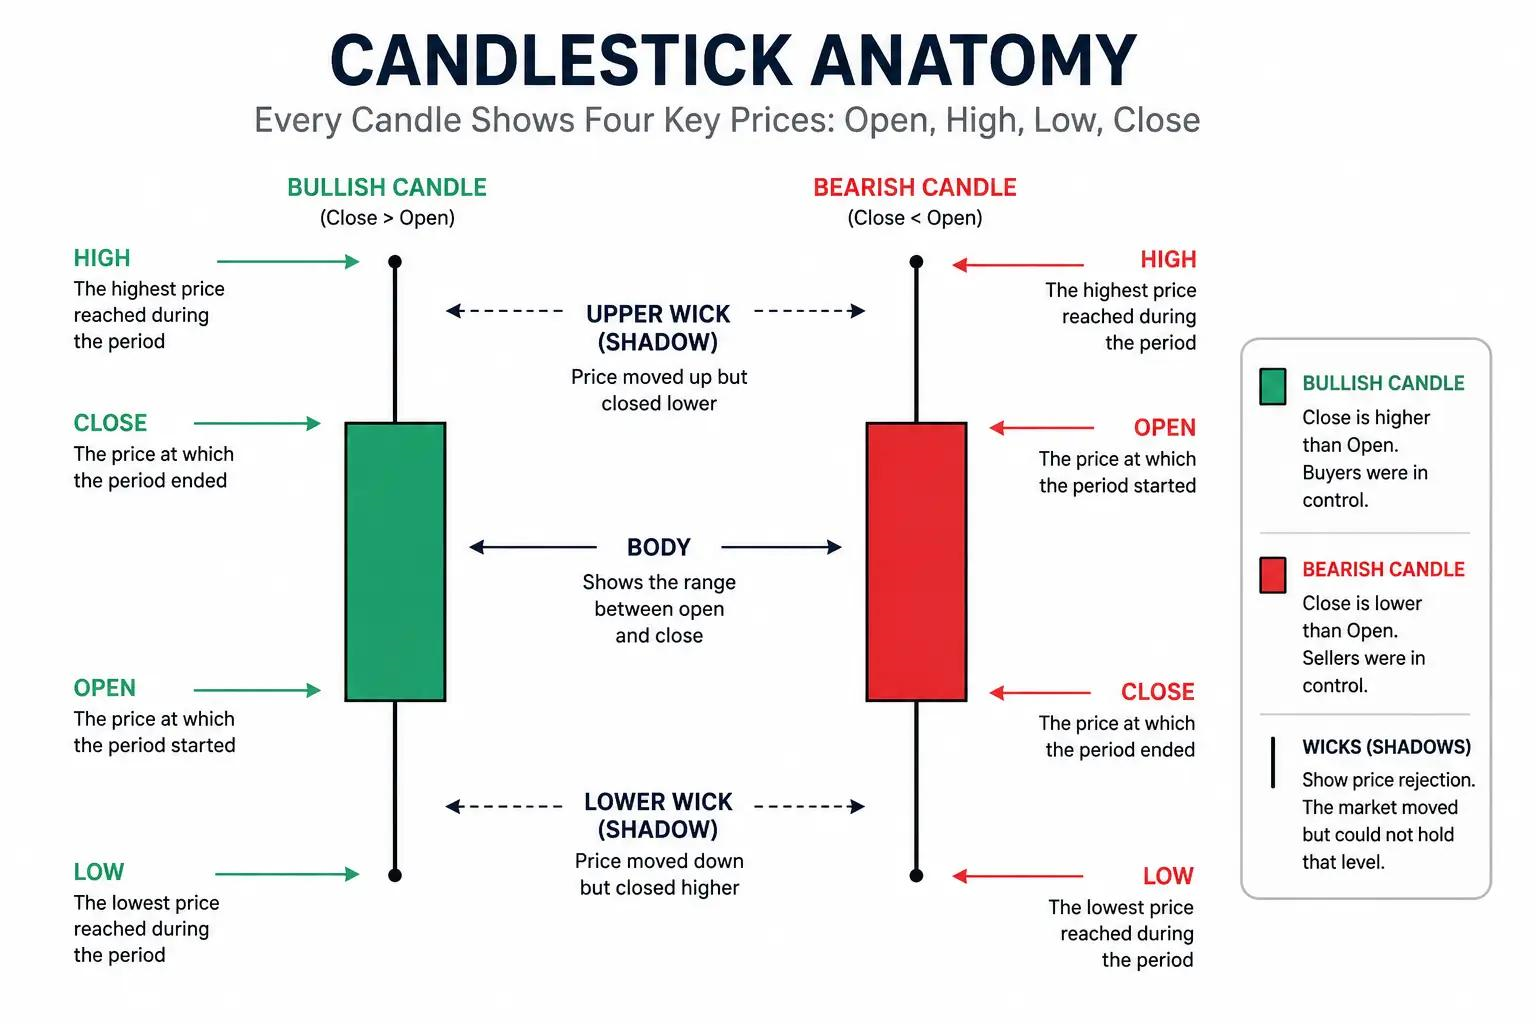
Each candlestick shows four important price levels:
- Open: The price at which the candle started.
- Close: The price at which the candle finished.
- High: The highest price reached during that period.
- Low: The lowest price reached during that period.
These four values are commonly known as OHLC.
Candlesticks help traders understand buying and selling pressure in the market.
2. Understanding Bullish and Bearish Candlesticks
There are two basic types of candlesticks.
Bullish Candlestick (Buyers in Control)
A bullish candlestick forms when the closing price is higher than the opening price.
This indicates that buyers pushed the price upward during that candle's formation.
Key characteristics:
- Close is above Open.
- The candle body represents upward price movement.
- The lower wick shows how far price moved below the body.
- The upper wick shows the highest price reached.
A strong bullish candle may indicate buying pressure, but it does not guarantee that the next candle will also move upward.
Bearish Candlestick (Sellers in Control)
A bearish candlestick forms when the closing price is lower than the opening price.
This indicates that sellers pushed the price downward during that candle's formation.
Key characteristics:
- Close is below Open.
- The candle body represents downward price movement.
- The upper wick shows how far price moved above the body.
- The lower wick shows the lowest price reached.
A strong bearish candle may indicate selling pressure, but traders should confirm the broader market context.
3. Understanding the Four Parts of a Candlestick
Every candlestick contains four important components.
1. Open Price
The starting price of a candle during its selected timeframe.
2. Close Price
The final price when the candle completes.
3. Upper Wick
The highest price reached during the candle's formation.
4. Lower Wick
The lowest price reached during the candle's formation.
Understanding these components helps traders evaluate price rejection, momentum and market behaviour.
4. Understanding Different Candlestick Timeframes
Gold traders use different timeframes depending on their trading style.
| Timeframe | Common application |
|---|---|
| M1 | Very short-term scalping |
| M5 | Short-term scalping |
| M15 | Intraday analysis |
| M30 | Intraday market structure |
| H1 | Short-term trend analysis |
| H4 | Broader market direction |
| D1 | Long-term market structure |
For example, a trader may use H1 to understand the broader direction and M5 to examine a potential entry setup.
A candle on the M5 chart represents five minutes of price movement, whereas an H1 candle represents one hour.
Remember that the same market can show bullish movement on M5 and bearish movement on H1. This is why timeframe context matters.
5. Important Candlestick Patterns in Gold Trading
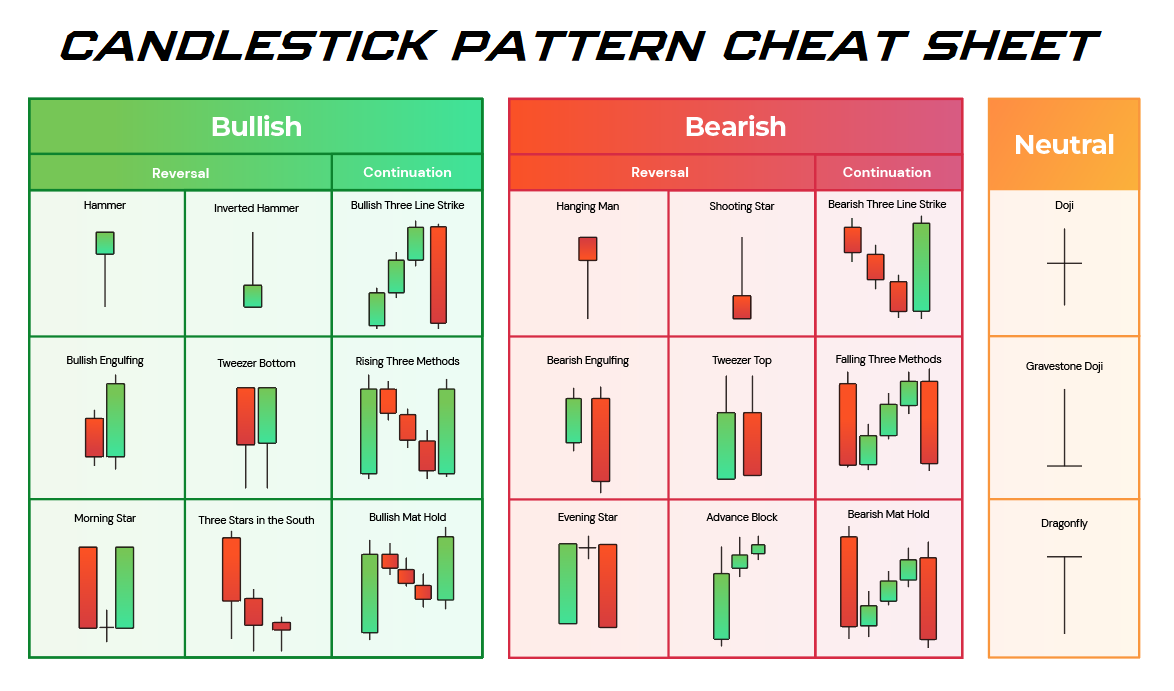
After understanding individual candlesticks, the next step is learning common candlestick patterns.
A. Bullish Engulfing
A bullish engulfing pattern consists of a bearish candle followed by a bullish candle whose real body covers the previous bearish candle's body.
It can indicate a shift towards buying pressure, particularly near a support area.
B. Bearish Engulfing
A bearish engulfing pattern consists of a bullish candle followed by a bearish candle whose real body covers the previous bullish candle's body.
It can indicate increasing selling pressure, particularly near a resistance area.
C. Hammer
A hammer typically has:
- A relatively small real body.
- A long lower wick.
- A small or absent upper wick.
It can indicate rejection of lower prices. Its significance depends on where it forms and what happens afterwards.
D. Shooting Star
A shooting star typically has:
- A relatively small real body.
- A long upper wick.
- A small or absent lower wick.
It can indicate rejection of higher prices, especially near resistance.
Important: No candlestick pattern should be treated as an automatic BUY or SELL signal. Market structure, support and resistance, and confirmation are also important.
6. How to Read Gold Price Action Using Candlesticks
Let's understand a practical example.
Imagine XAUUSD is trading around 2,650.
The following sequence occurs:
- Gold moves downward towards a previously identified support area.
- A candle forms with a long lower wick.
- The next candle closes bullish.
- Buyers continue pushing the price upward.
This sequence may suggest that buyers are becoming more active around support.
However, traders should wait for confirmation rather than entering simply because a bullish candle has appeared.
For a potential SELL setup, the opposite situation may occur near resistance:
- Gold moves upward towards resistance.
- A candle forms with a long upper wick.
- The next candle closes bearish.
- Selling pressure continues.
This may indicate rejection of higher prices.
7. Understanding Candle Body and Wick Strength
One useful technique is comparing the candle body with its total range.
Candle Range = High − Low
Candle Body = Absolute Value of (Close − Open)
For example:
- Open: 2650
- High: 2660
- Low: 2648
- Close: 2658
The candle range is 12 price units, while its body is 8 price units.
Body-to-range ratio:
8 ÷ 12 × 100 = 66.67%
This tells us that the candle closed relatively close to its high, with a comparatively substantial bullish body.
A larger body relative to the total range can indicate stronger directional movement during that candle. It should still be interpreted alongside volume, volatility and market structure.
8. Common Mistakes Beginners Make
Many beginners struggle with Gold trading because they misunderstand candlestick behaviour.
Avoid these common mistakes:
- Entering trades before a candle closes.
- Treating every bullish candle as a BUY signal.
- Treating every bearish candle as a SELL signal.
- Ignoring support and resistance.
- Trading against the broader market structure without a clear setup.
- Using very small stop losses without considering Gold volatility.
- Taking trades without calculating risk-to-reward.
- Overtrading during high-impact economic news.
A disciplined trading process is more important than finding a signal on every candle.
9. Using Technical Indicators for Additional Signal Analysis
Candlestick analysis is a valuable foundation, but some traders also use technical indicators to help identify potential BUY and SELL opportunities.
One option for MetaTrader 5 users is Scalping Smart Signals (SSS v5.0).
SSS v5.0 is designed to assist traders with identifying potential trading signals across different trading styles.
It can be explored as an additional technical analysis tool alongside:
- Candlestick patterns.
- Market structure.
- Support and resistance.
- Price action confirmation.
- Risk management.
Explore SSS v5.0 on MQL5 Market:
https://www.mql5.com/en/market/product/141469
Always understand an indicator's settings and signal conditions before using it in live trading. An indicator does not guarantee profitable trades.
10. Practical Checklist Before Entering a Gold Trade
Before considering a BUY or SELL trade on XAUUSD, ask yourself:
- What is the current market direction?
- Is price approaching support or resistance?
- Has the candlestick completed?
- Is there a recognizable price action pattern?
- Is the candle body showing meaningful directional movement?
- Is there confirmation from the surrounding market structure?
- Where will the stop loss be placed?
- Does the potential reward justify the risk?
If the setup is unclear, waiting for another opportunity is also a trading decision.
Conclusion
Understanding candlestick charts is one of the fundamental skills in Gold trading.
By learning how to identify bullish and bearish candles, interpret wicks, recognize common patterns and understand different timeframes, traders can develop a more structured approach to XAUUSD technical analysis.
Remember that candlesticks are only one part of a complete trading strategy. Market structure, support and resistance, volatility and proper risk management should also be considered.
In the next tutorial, we will explore how to identify support and resistance levels in Gold trading and how these levels can help traders understand potential market reversal and breakout areas.
About UZFX
UZFX provides educational content and tools related to Forex trading, Gold analysis and MetaTrader 5 indicator development.
Risk Disclaimer: Forex and Gold trading involve substantial financial risk. This educational article is not financial advice or a recommendation to buy or sell any financial instrument. Always conduct independent research and use appropriate risk management.



