
📌 Table of Contents:
1️⃣ Overview
📌 Recommended Symbols & Timeframes
⚙️ How to Adjust ATR Multiplier to Control Signal Frequency
📌 Risk Optimization Guide – FiboSniper Pro
⭐ Trading Statistics Simulator
⚙️ Days to Simulate – Historical Signal Simulation
⭐ Interactive Control Panel
2️⃣ Key Features
3️⃣ Smart Fibonacci Envelope System
4️⃣ Signal Filtering System
5️⃣ Candle Filter & Signal Confirmation
6️⃣ Smart ATR-Based SL/TP System
7️⃣ Alert System
8️⃣ Installation & Basic Usage
9️⃣ Risk Management Principles
🔟 Common Troubleshooting
1️⃣1️⃣ Trading Psychology & Discipline
1️⃣2️⃣ Final Notes & Support
1️⃣ Overview
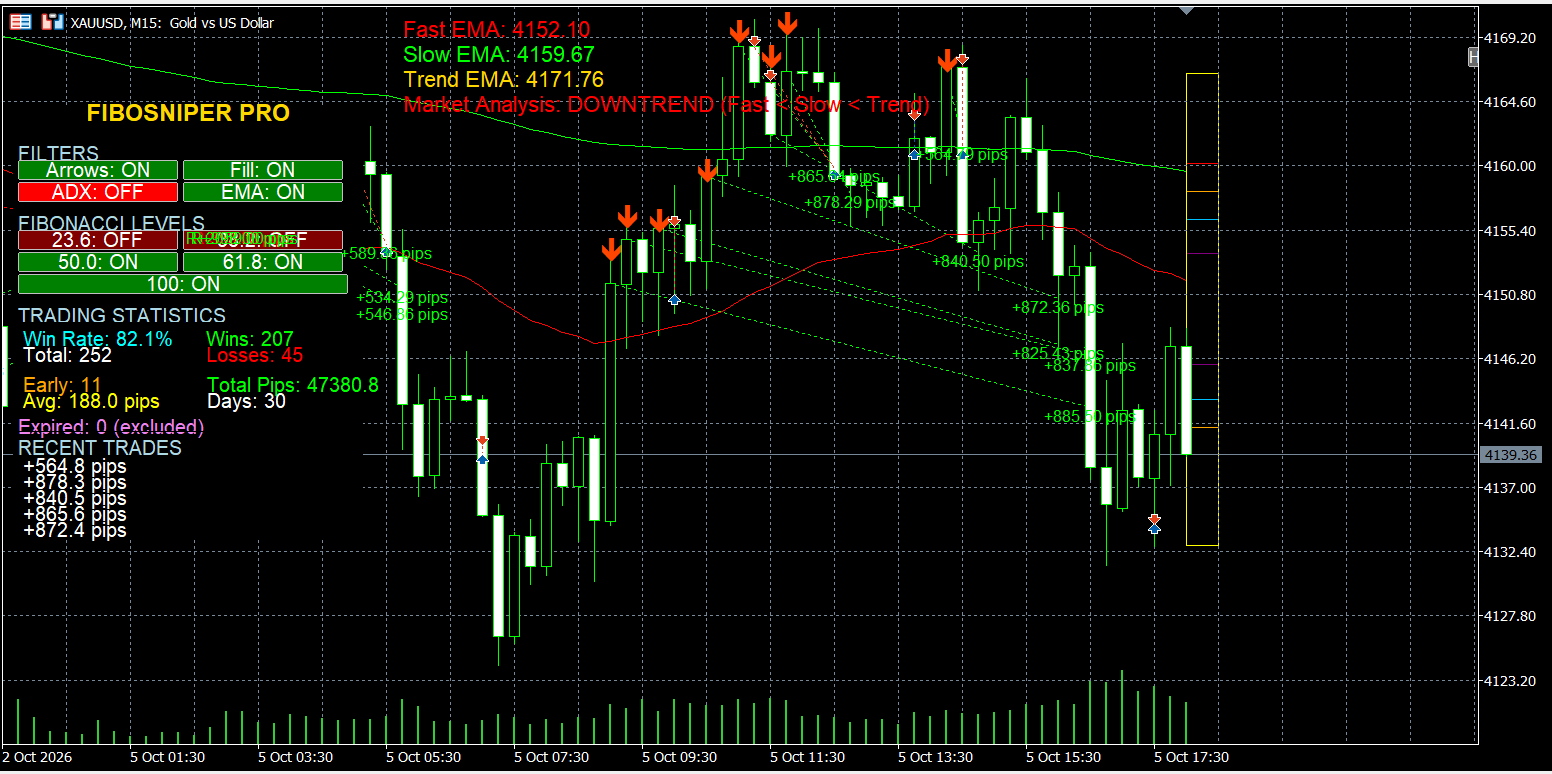
FiboSniper Pro is an advanced scalping indicator built around the Fibonacci Envelopes concept, combining Moving Averages (MA) and ATR to create dynamic Fibonacci bands that adapt to market volatility.
The indicator includes multiple intelligent filters designed to improve signal quality and provide a more structured approach to trade management.
FiboSniper Pro also includes:
✅ Interactive Control Panel with real-time filter ON/OFF controls
✅ Built-in Trading Statistics Panel for evaluating trading performance
✅ ATR-based Stop Loss and Take Profit system
✅ Dynamic Fibonacci system that adapts to market volatility
✅ Multiple confirmation filters, including EMA, RSI, ADX, Volume Profile, Bollinger Bands, RSI Divergence, and Market Structure
✅ Real-time Trend Analysis displayed directly on the chart
✅ Visual Profit/Loss Connection Lines
The system is designed for scalpers and day traders who want greater flexibility, improved trade filtering, and a more structured trading workflow.
📌 Recommended Symbols & Timeframes
FiboSniper Pro supports various symbols and market conditions, including:
- XAUUSD (Gold)
- BTCUSD (Bitcoin)
- Major Forex Pairs: EURUSD, EURCHF, EURGBP, USDCHF, AUDUSD, USDCAD, NZDUSD, GBPUSD, USDJPY
- Indices: US30, US100 (Nasdaq)
📊 Recommended Timeframes
- M1–M5: Fast scalping; European session (08:00–17:00) is generally preferred.
- M15: Balanced intraday trading.
- M30: More stable, higher-quality signals.
- H1–H4: Lower frequency with stronger trend confirmation.
Adjust the Time Filter according to your broker's server time to align with the London and New York sessions.
⚠️ Important: Market conditions change over time, so no configuration can guarantee consistent performance in all conditions.
For best results:
- Test settings on a demo account first.
- Use the Trading Statistics panel to evaluate configurations.
- Adjust filters based on current market conditions and volatility.
⚙️ How to Adjust ATR Multiplier to Control Signal Frequency
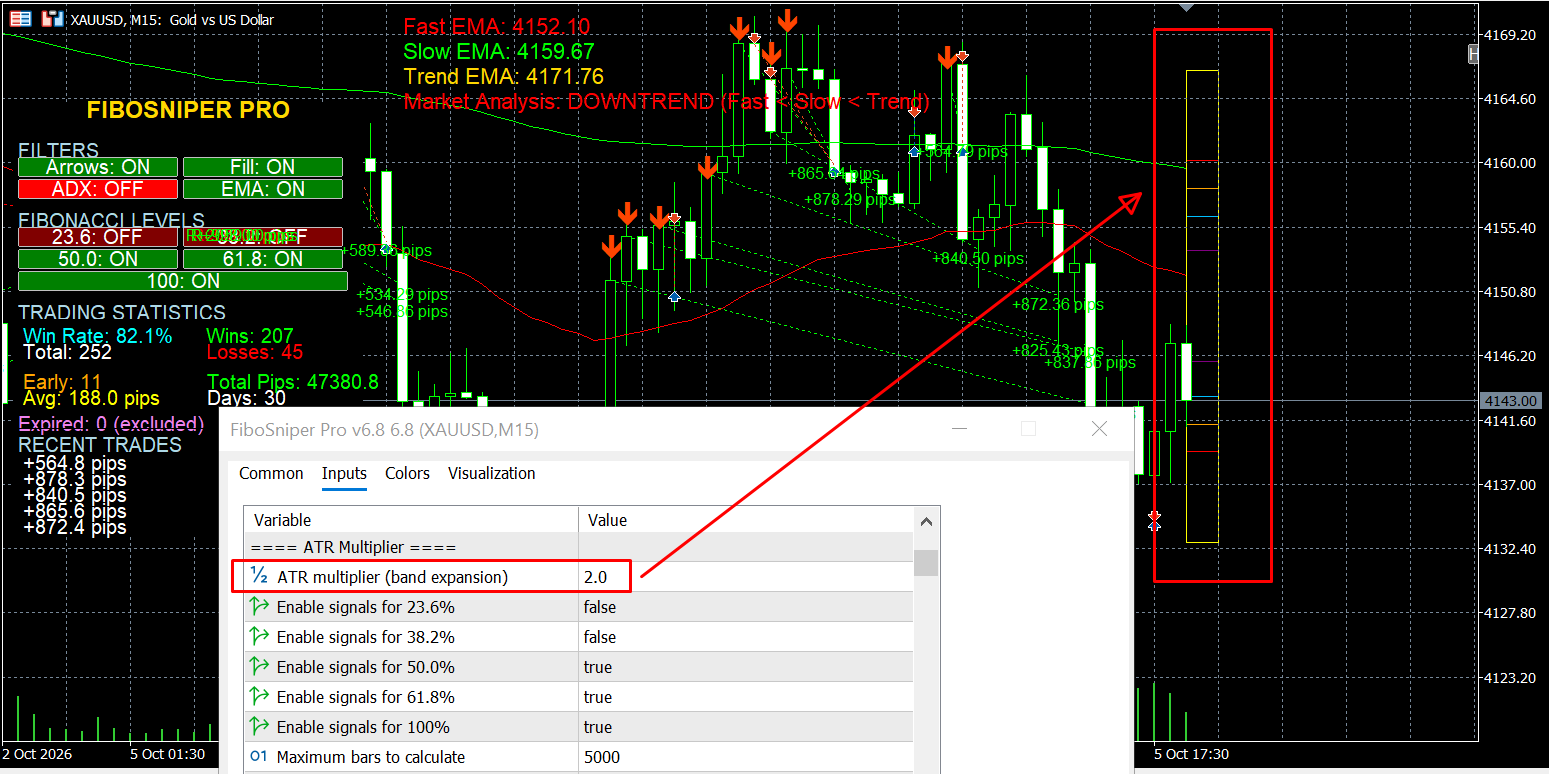
The ATR Multiplier is an important setting in FiboSniper Pro because it affects the sensitivity of the Fibonacci bands and the frequency of trading signals.
🔹 Default: ATR Multiplier = 2.0
📈 Increasing ATR Multiplier
Increasing the ATR Multiplier makes the Fibonacci bands wider and less sensitive to short-term price fluctuations, resulting in fewer trading signals.
Examples:
- 3.0 → fewer signals
- 5.0 → significantly fewer signals
📉 Decreasing ATR Multiplier
Decreasing the ATR Multiplier makes the Fibonacci bands narrower and more sensitive to price fluctuations, resulting in more trading signals.
Examples:
- 1.5 → more signals
- 1.0 → significantly more signals
📊 Compare Trading Statistics
After changing the ATR Multiplier, it is important to monitor the Trading Statistics panel and compare the results:
🏆 Win Rate | 📊 Total Trades | 🟢 Winning Trades | 🔴 Losing Trades | 💰 Total Profit | 🛑 SL Closed | 🎯 TP Closed
Do not evaluate a configuration based on Win Rate alone. Consider multiple performance metrics together and test over a sufficiently large number of trades.
💡 General Guideline:
Higher ATR Multiplier → Lower signal frequency
Lower ATR Multiplier → Higher signal frequency
There is no single ATR Multiplier that is suitable for every symbol or timeframe. Users can test different values such as 1.5, 2.0, 3.0, or 5.0 and select the configuration that best matches their preferred trading frequency and market conditions.
📌 Risk Optimization Guide – FiboSniper Pro
For users who want to customize risk management and trading behavior, the SL_ATR_Multiplier parameter can be adjusted.
Default setting: 4.0 ATR — a more conservative approach.
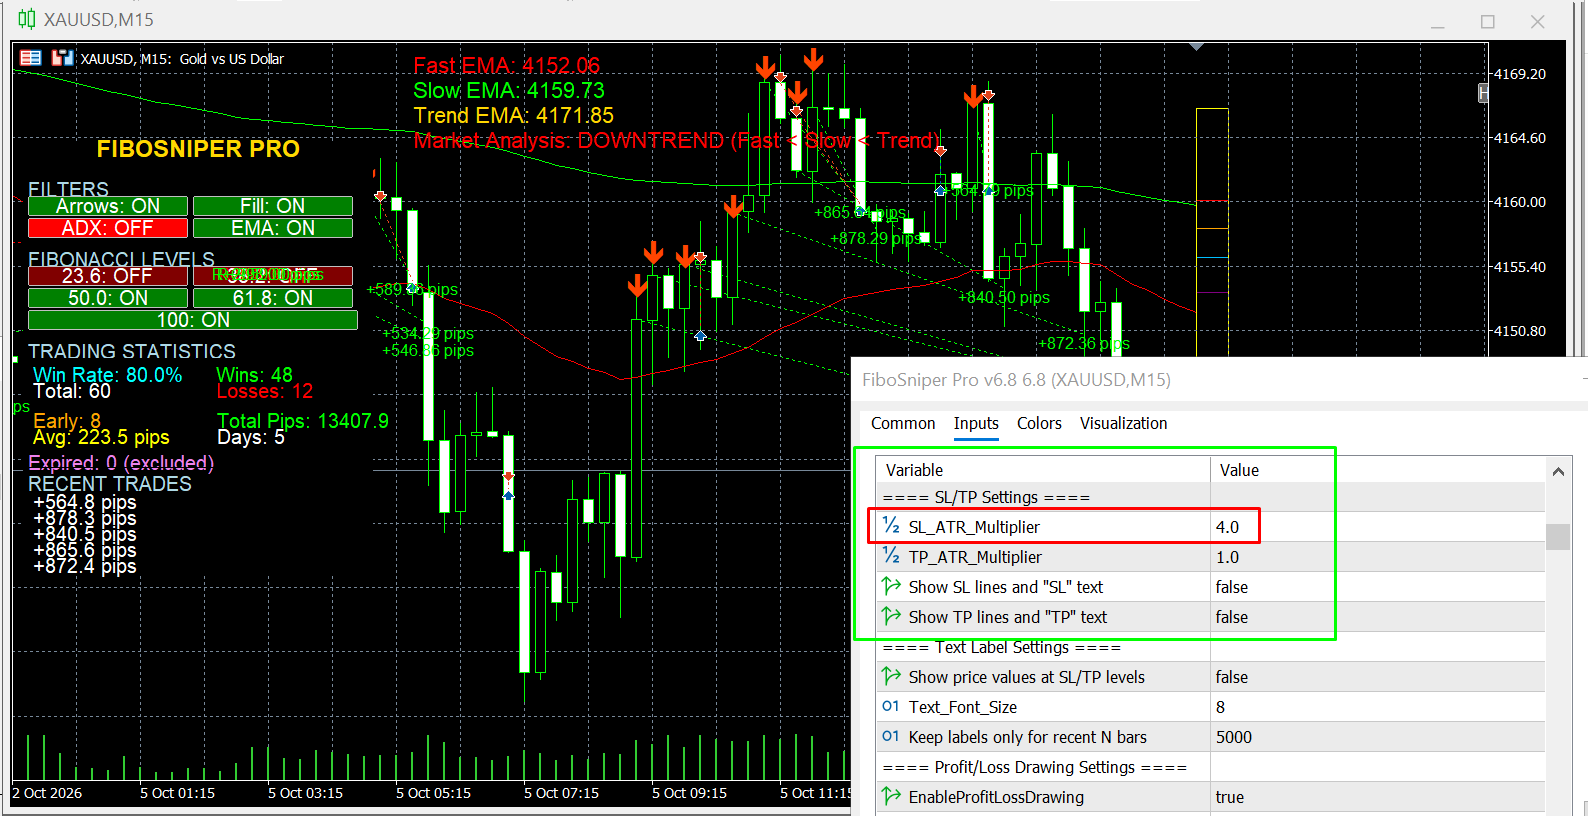
Recommended Alternatives
- 3.0 ATR – Balanced approach between risk and stop-loss distance
- 2.0 ATR – More aggressive approach with a tighter stop loss
- 1.0 ATR – Very tight stop loss, suitable for higher-frequency or more aggressive trading styles
Each adjustment directly affects stop-loss distance, trading behavior, drawdown, and overall performance depending on market volatility.
After making any changes, monitor Total Profit, Win Rate, and Drawdown in the Trading Statistics panel and compare the results.
There is no single perfect configuration for all market conditions. Users are encouraged to backtest and experiment to find a configuration that matches their risk tolerance and trading style.
⭐ Trading Statistics Simulator
📌 Purpose
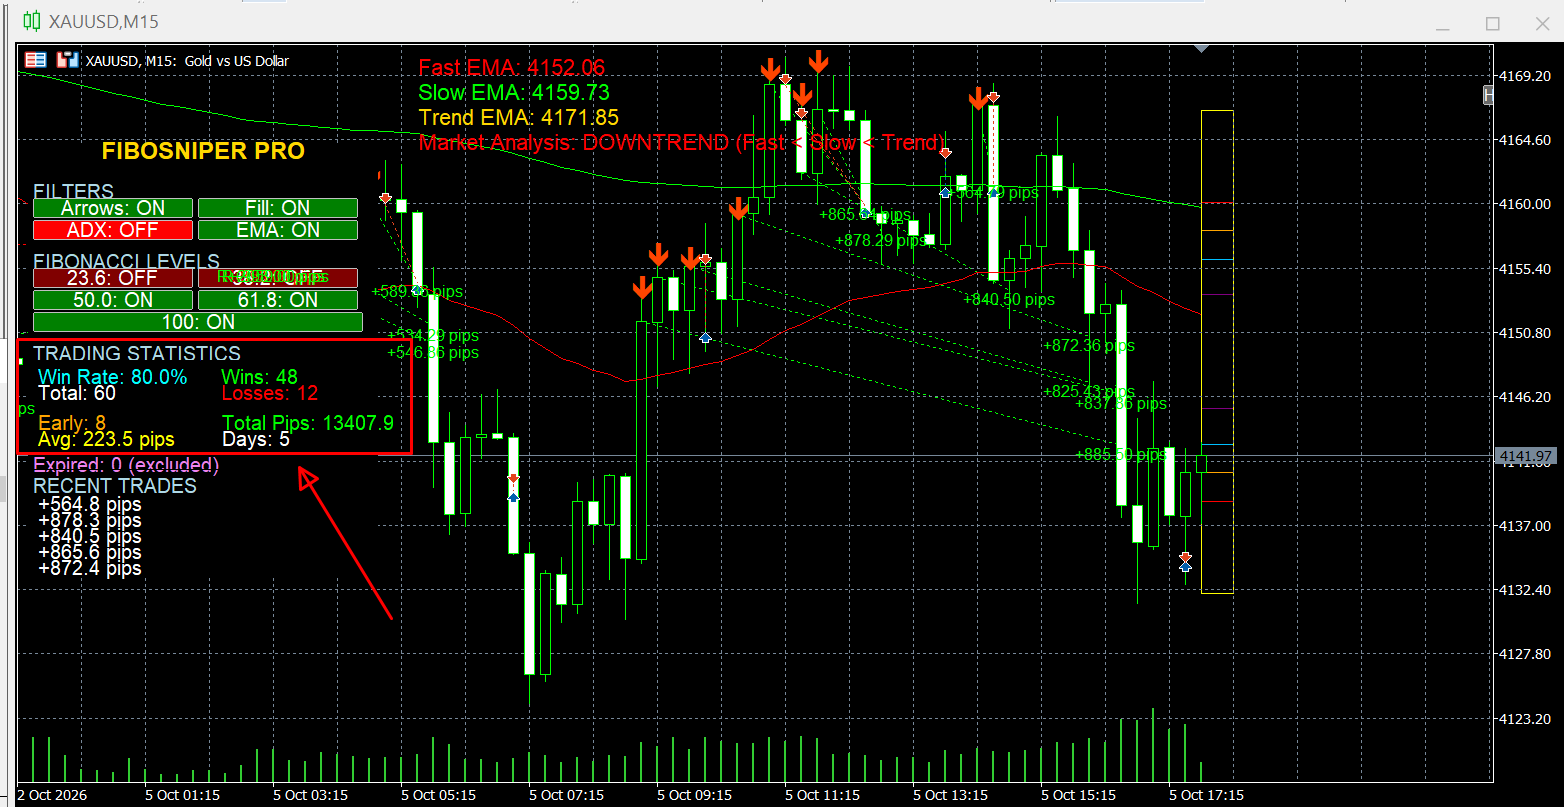
The Trading Statistics Simulator allows you to quickly evaluate the historical performance of FiboSniper Pro directly on the chart without running a full strategy backtest.
It simulates historical signals and provides useful statistics such as:
- Win Rate
- Total Trades
- Winning Trades
- Losing Trades
- Average Profit per Trade
- Total Profit (Pips)
- TP/SL Closed Trades
- Expired Trade Statistics
- Early Close Statistics
- Simulation Period (Days/Bars)
This feature allows traders to compare different filter combinations and optimize settings for different symbols and timeframes.
📌 Enabling the Trading Statistics Simulator
To enable the simulator:
- Set EnableSimulation = true
- Set ShowMainPanel = true to display the statistics panel directly on the chart
The statistics panel will automatically update and display the historical simulation results.
⚠️ Important
The Trading Statistics Simulator is a historical signal analysis tool and does not guarantee future trading performance.
Market conditions can change over time. Always perform forward testing on a demo account before using a configuration for live trading.
⚙️ Days to Simulate – Historical Signal Simulation
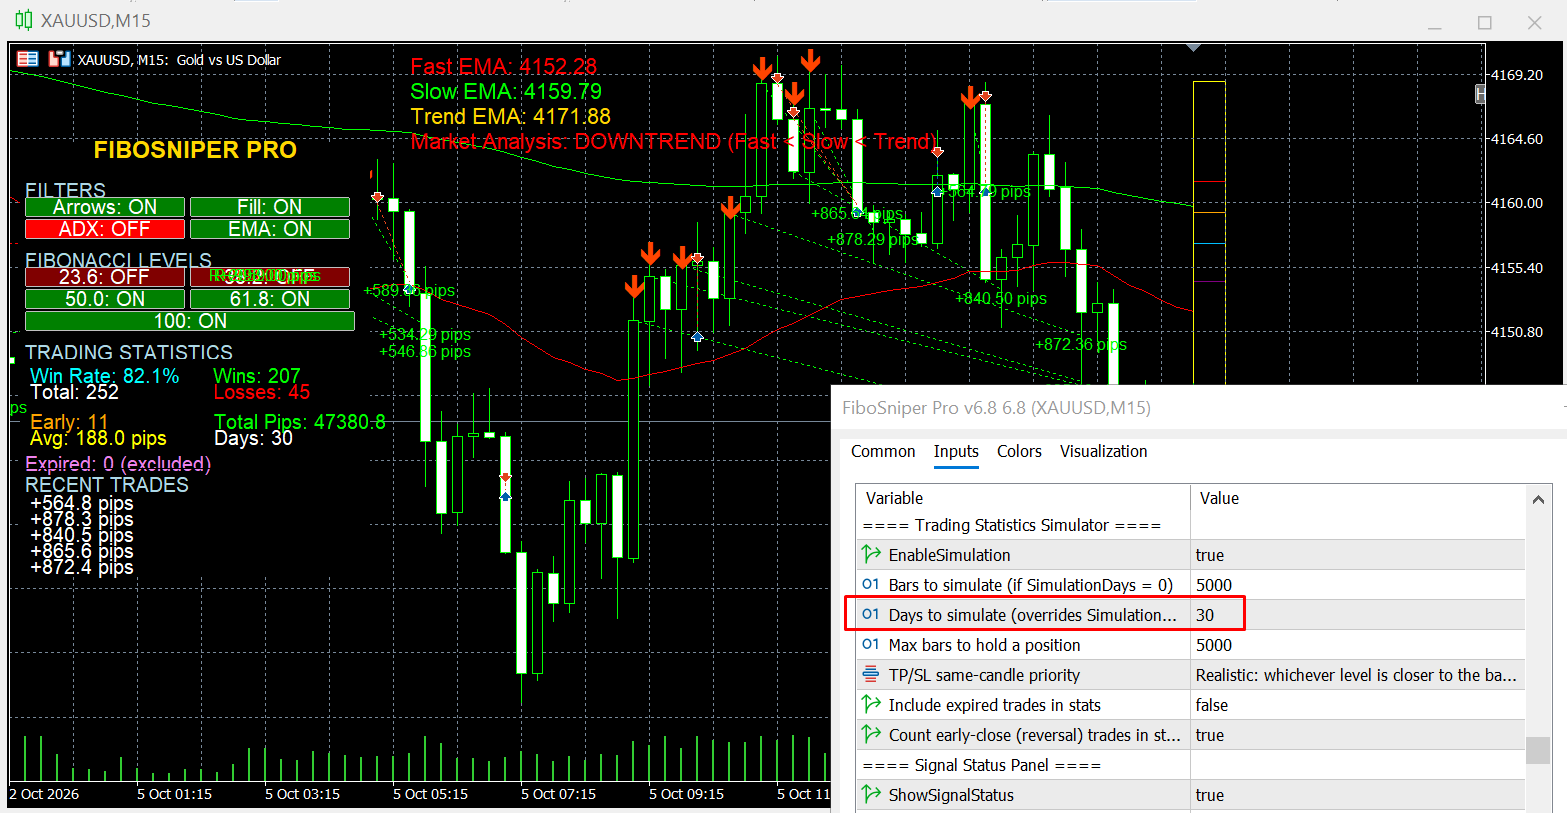
Days to Simulate allows you to simulate FiboSniper Pro signals over a specific historical period based on the number of days rather than manually specifying the number of bars.
This makes it easier to evaluate signal performance over a defined historical period directly on the current chart and timeframe.
📅 How It Works
The SimulationDays parameter determines how many recent days of historical data are used for the simulation.
- SimulationDays = 0 → The simulator uses SimulationBars
- SimulationDays > 0 → The simulator uses the specified number of days and ignores SimulationBars
- If insufficient historical data is available on the chart, the simulator will use only the available data
⚙️ Recommended Settings
Under Trading Statistics Simulator:
EnableSimulation = true ShowMainPanel = true SimulationDays = 30 SimulationBars = 0 MaxBarsToCheck = 10000
📌 SimulationDays = 30 means that the indicator will simulate signals from approximately the most recent 30 days on the current timeframe.
📌 MaxBarsToCheck determines the maximum number of bars checked when evaluating TP/SL results for each simulated trade. Values between 5000–10000 can be used depending on the timeframe and analysis requirements.
📊 Quick Timeframe Reference
| ⏱️ Timeframe | 📊 Approx. Bars per Day |
|---|---|
| M1 | ~1,440 |
| M5 | ~288 |
| M15 | ~96 |
| M30 | ~48 |
| H1 | ~24 |
| H4 | ~6 |
| D1 | 1 |
📝 Examples
- M5 × 30 days ≈ 8,640 bars
- M15 × 30 days ≈ 2,880 bars
- H1 × 30 days ≈ 720 bars
- D1 × 30 days = 30 bars
This allows you to use the same SimulationDays value across different timeframes while the simulator automatically works with the corresponding historical data.
⚠️ Important Notes
- Simulation results are based on historical signals and do not include spread, commission, or slippage.
- Results may vary depending on enabled filters and indicator settings.
- If MaxBarsToCheck is too small, some simulated trades may not have enough bars available to evaluate TP/SL.
- Make sure sufficient historical data is available in MT5 for the selected symbol and timeframe.
- W1 and MN1 are not recommended for Days to Simulate because converting a number of days into bars is not suitable for these higher timeframes.
💡 Practical Example
For example, if you are testing XAUUSD M15 and want to evaluate approximately one month of historical signals:
EnableSimulation = true SimulationDays = 30 ShowMainPanel = true MaxBarsToCheck = 3000
After applying the settings, review the Trading Statistics panel to evaluate:
- Win Rate
- Total Trades
- Winning/Losing Trades
- TP/SL Results
- Average Profit
- Total Profit
- Simulation Period
⚠️ The simulator is designed for historical analysis and configuration comparison. It should not be interpreted as a guarantee of future trading performance.
Always consider current market conditions and perform forward testing on a demo account before using a configuration for live trading.
⭐ Interactive Control Panel
FiboSniper Pro includes an Interactive Control Panel displayed directly on the chart, allowing traders to quickly enable or disable filters and system functions with a single click.
Combined with the Trading Statistics Simulator, the Control Panel allows users to test different configurations, compare performance results, and optimize the strategy without repeatedly reopening the indicator settings.
📌 Main Settings
- EnablePanel – Enable or disable the control panel
- ShowMainPanel – Display the main information panel
- ShowSignalStatus – Display the signal status panel
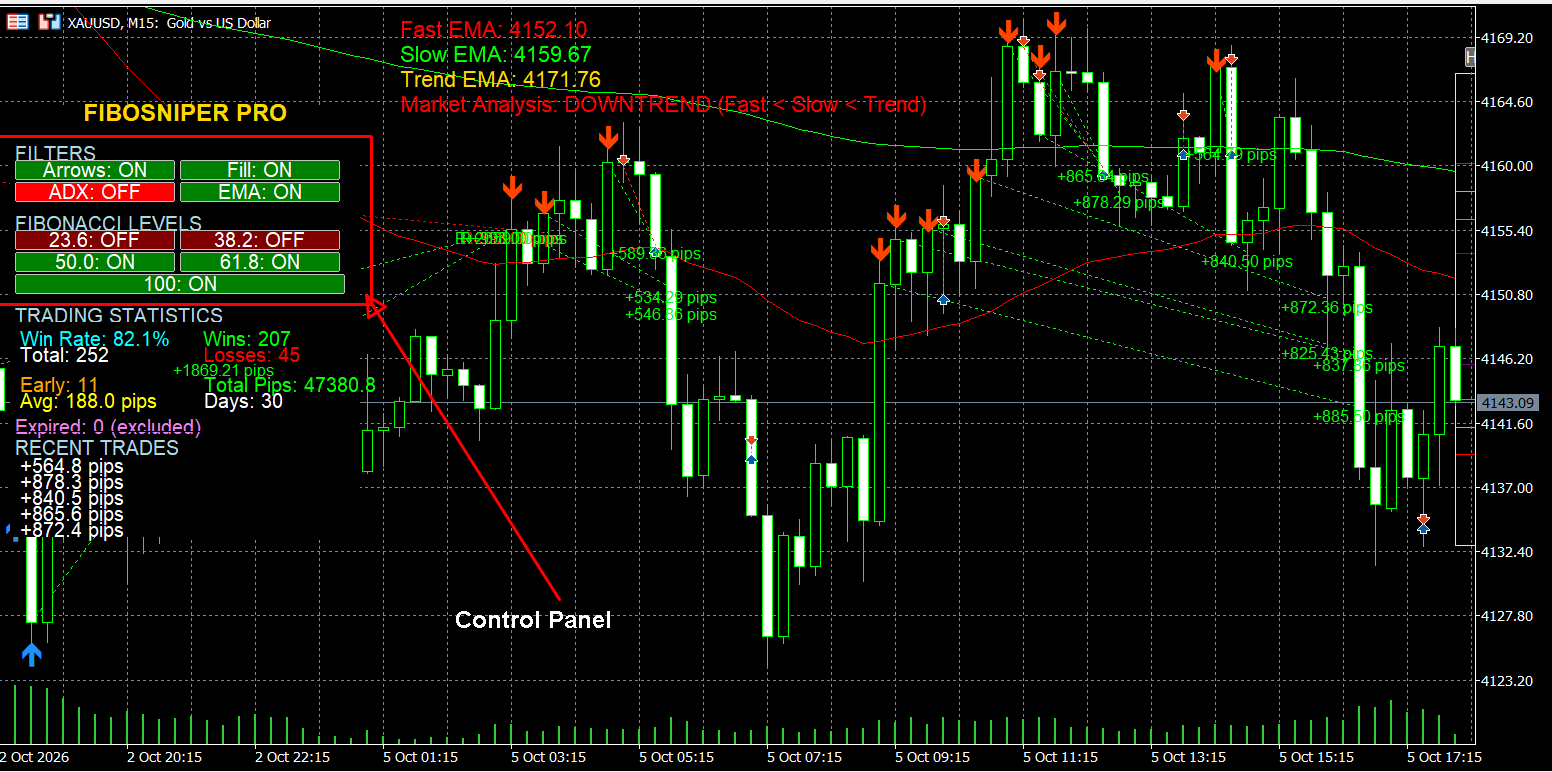
Control Buttons
| Button | Function |
|---|---|
| Arrows | Enable/disable signal arrows |
| Fill | Enable/disable band filling |
| ADX | Enable/disable ADX filter |
| EMA | Enable/disable EMA Cross filter |
| 23.6 | Enable/disable 23.6% signals |
| 38.2 | Enable/disable 38.2% signals |
| 50.0 | Enable/disable 50.0% signals |
| 61.8 | Enable/disable 61.8% signals |
| 100 | Enable/disable 100% signals |
Benefits
✅ Enable or disable filters instantly on the chart
✅ Test multiple configurations without reopening the settings window
✅ Optimize the strategy using real-time statistics
✅ Improve the workflow for scalping and intraday trading
✅ Easily adapt the system to different symbols and timeframes
✨ Advanced Fibonacci Envelopes using MA + ATR + Fibonacci ratios
🧩 16+ intelligent filters and trading tools, fully configurable ON/OFF
🖥 Interactive Control Panel displayed directly on the chart
🎛 Real-time ON/OFF controls for filters and system functions
📉 Automatic ATR-based SL/TP based on market volatility
📊 Built-in trading simulation and performance statistics
🖥 Real-time signal status panel displayed on the chart
📈 Profit/Loss Connection Lines with visual P/L information
📊 Volume Profile display with POC, VAH, and VAL levels
📈 Trend Analysis display with EMA values and market conclusions
🔔 Multi-platform alerts:
- Popup
- Push Notification (MT5 Mobile)
⚠️ Important Note
All filters and features in FiboSniper Pro can be enabled ( true) or disabled ( false), giving users full flexibility to adapt the system to their personal trading strategy and market environment.
The Interactive Control Panel provides a faster and more practical way to manage the system directly from the chart. Instead of reopening the indicator settings each time, you can instantly enable or disable filters and features, observe the changes through the statistics panel, and optimize the configuration more efficiently.
FiboSniper Pro uses a Fibonacci Envelopes system built from:
- Moving Average (MA) – central reference line
- ATR (Average True Range) – volatility measurement
- Fibonacci Ratios – dynamic support/resistance bands
🔧 Calculation Formula
Upper Band = MA + (ATR × FibRatio × ATR_Multiplier) Lower Band = MA − (ATR × FibRatio × ATR_Multiplier)
🟢 BUY signal when price touches or crosses the lower band
🔴 SELL signal when price touches or crosses the upper band
🔧 Main Parameters
| Parameter | Default | Description |
|---|---|---|
| MA_Period | 20 | MA period |
| MA_Method | MODE_EMA | MA method |
| ATR_Period | 14 | ATR period |
| ATR_Multiplier | 2.0 | Band expansion multiplier |
| FibRatio1 | 0.236 | 23.6% Fibonacci ratio |
| FibRatio2 | 0.382 | 38.2% Fibonacci ratio |
| FibRatio3 | 0.5 | 50.0% Fibonacci ratio |
| FibRatio4 | 0.618 | 61.8% Fibonacci ratio |
| FibRatio5 | 1.0 | 100% Fibonacci ratio |
🎚 Fibonacci Level Controls
Each Fibonacci level can be enabled independently:
- 23.6% → Early reaction zone (default: OFF)
- 38.2% → Moderate pullback zone (default: OFF)
- 50.0% → Neutral balance zone (default: ON)
- 61.8% → Strong reversal zone (default: ON)
- 100% → Maximum boundary (default: ON)
👉 This allows traders to customize the level of aggressiveness:
- Fewer levels → tighter signals
- More levels → more opportunities
FiboSniper Pro uses a powerful multi-layer filtering system designed to:
🎯 Improve signal quality
🚫 Reduce false signals
🔄 Adapt to different market conditions
Each filter can be enabled or disabled independently.
4.1 EMA Trend Filter
📌 Purpose: Identify the primary market trend.
Logic
- Uses EMA50, EMA200, and EMA400
- Bullish: EMA50 > EMA200 > EMA400 → BUY only
- Bearish: EMA50 < EMA200 < EMA400 → SELL only
✅ Filters counter-trend trades
✅ Reduces market noise
✅ Keeps trades aligned with the broader timeframe structure
Parameters
- Fast_EMA_Period = 50
- Slow_EMA_Period = 200
- Trend_EMA_Period = 400
- UseEMATrendFilter = true — display EMA lines
4.2 Simple EMA Cross Filter (Fast/Slow EMA Filter)
📌 Purpose: Confirm short-term directional bias.
Logic
- Uses the relationship between fast and slow EMAs
- Trades are allowed only when the short-term trend agrees with the broader direction
✅ Improves short-term timing
✅ Avoids entries during mixed market conditions
Parameters
- UseFastSlowEMAFilter = true
- Fibo_Fast_EMA_Period = 50
- Fibo_Slow_EMA_Period = 200
4.3 Trend Filter (EMA Trend Filter)
📌 Purpose: Trade only in the direction of the primary trend.
Logic
- Uses EMA400 as the trend filter
- The reference can be based on closing price or the MA band
Parameters
- UseTrendFilter = false — default OFF
- Fibo_Trend_EMA_Period = 400
- TrendFilterUseMABand = false — use close price when false, MA band when true
✅ Filters counter-trend trades
✅ Keeps trades aligned with the primary trend
4.4 RSI Filter
📌 Purpose: Avoid entries in extremely overbought or oversold conditions.
Logic
- RSI Period: 14
- Avoid BUY when RSI > 80 (overbought)
- Avoid SELL when RSI < 20 (oversold)
Parameters
- EnableRSIFilter = false
- RSI_Period = 14
- RSI_Oversold = 20.0
- RSI_Overbought = 80.0
✅ Prevents chasing extreme price levels
✅ Helps reduce emotional FOMO entries
4.5 RSI Divergence Filter
📌 Purpose: Detect price–momentum divergence.
Logic
- Detects bullish and bearish RSI divergence
- Signals are allowed only when valid divergence is detected
Parameters
- EnableRSIDivergence = false
- DivergenceLookback = 20 — number of bars used to search for divergence
- DivergenceMinGap = 4 — minimum distance between two pivots
✅ Improves reversal confirmation
✅ Strengthens breakout confirmation
✅ Helps filter weak trend exhaustion conditions
4.6 Bollinger Bands Width / Squeeze Filter
📌 Purpose: Avoid trading during low-volatility compression periods.
Logic
- Calculates Bollinger Band width relative to ATR
- Signals are allowed only when BB Width / ATR ≥ the minimum threshold
Parameters
- EnableBBWidthFilter = false
- BB_Period = 20
- BB_Deviation = 2.0
- MinBBWidth_ATR = 1.2 — minimum BB Width / ATR ratio
✅ Avoids low-volatility sideways markets
✅ Allows trading only when sufficient volatility is present
4.7 Market Structure Filter
📌 Purpose: Confirm market structure using HH/HL and LH/LL.
Logic
- Detects swing highs and swing lows
- Bullish: Higher Highs + Higher Lows → BUY only
- Bearish: Lower Highs + Lower Lows → SELL only
Parameters
- EnableStructureFilter = false
- StructureSwingLookback = 3 — bars on each side used to detect swings
- StructureSearchBars = 60 — search window for two swings
✅ Trades with market structure
✅ Filters signals during mixed market conditions
4.8 ADX Filter
📌 Purpose: Confirm sufficient trend strength.
Logic
- ADX must exceed the minimum threshold, for example 5.0
- An optional maximum threshold can be used to avoid overly extended conditions, for example 25.0
Parameters
- EnableADXFilter = false
- ADX_Period = 14
- ADX_Threshold = 5.0 — minimum threshold
- ADX_MaxThreshold = 25.0 — maximum threshold
✅ Helps avoid sideways markets
✅ Allows trading when sufficient trend strength is present
4.9 EMA Slope Filter
📌 Purpose: Confirm trend momentum using EMA slope.
Logic
- Calculates EMA slope
- Signals are allowed only when the slope exceeds the defined threshold
Available Options
- Fast EMA slope
- Slow EMA slope
- Trend EMA slope
Parameters
- UseEMASlopeFilter = false
- UseShortEMASlope = true
- UseLongEMASlope = true
- UseTrendEMASlope = true
- EMASlopeThreshold = 0.0
✅ Helps avoid sideways conditions
✅ Filters weak momentum conditions
4.10 EMA Price Zone Filter
📌 Purpose: Ensure that price is within a valid EMA zone.
Logic
- Price must remain within EMA ± ATR-based tolerance
- The dynamic zone can be calculated using ATR
Parameters
- EnableEMAPriceZoneFilter = false
- UseEMAZoneToleranceATR = true
- EMA_Zone_Tolerance_ATR = 1.5
- EMA_Zone_Tolerance_ATR_Period = 14
✅ Helps prevent late entries
✅ Reduces pullback risk
✅ Helps maintain more favorable entry locations
4.11 ATR Over-Extension Filter
📌 Purpose: Prevent FOMO entries after strong price movements.
Logic
- Measures recent price volatility
- Filters signals when recent movement exceeds ATR × Multiplier
Parameters
- EnableATROverExtFilter = false
- ATR_OverExt_Lookback = 5
- ATR_OverExt_Multiplier = 2.0
✅ Helps trade under more controlled volatility conditions
✅ Protects against unstable market phases
4.12 ATR Strength Filter
📌 Purpose: Measure current volatility strength relative to historical volatility and allow trading only when the market has sufficient momentum.
Logic
- Compares recent ATR ( ATR_Recent_Period) with reference ATR average ( ATR_Reference_Period)
- Calculates ATR strength as a percentage
- Signals are allowed only when ATR Strength ≥ the defined threshold
Parameters
- EnableATRStrengthFilter = false
- ATR_Recent_Period = 1
- ATR_Reference_Period = 14
- ATR_Strength_Threshold = 10.0
✅ Filters trades during weak market conditions
✅ Improves trade selection during stronger volatility periods
✅ Can work effectively together with Trend and ADX filters
4.13 Time Filter
📌 Purpose
Limits trading signals to a specific time window during the day, allowing the system to operate only during preferred market sessions when liquidity and volatility are generally higher.
Logic
- Checks the current chart time against the defined trading window
- Signals are allowed only when the current time falls within the specified start and end time
- Signals outside the trading window are ignored
Parameters
- InpUseTimeFilter = false
- InpStartHour = 8 — start hour
- InpStartMinute = 0 — start minute
- InpEndHour = 17 — end hour
- InpEndMinute = 0 — end minute
✅ Allows traders to focus on higher-liquidity sessions such as London or New York
✅ Helps avoid low-volatility periods and less favorable market conditions
✅ Can improve signal quality when combined with volatility and trend filters
4.14 Volume Profile Filter
📌 Purpose
Displays important Volume Profile levels to help identify significant market price areas.
Logic
- Builds a Volume Profile using historical price and volume data
- Calculates and displays key levels:
- POC (Point of Control)
- VAH (Value Area High)
- VAL (Value Area Low)
Filter Modes
| Mode | Description |
|---|---|
| VP_FILTER_INSIDE | Inside the value area (VAL–VAH) |
| VP_FILTER_NEAR_VAL | Near VAL (± ATR distance) |
| VP_FILTER_NEAR_VAH | Near VAH (± ATR distance) |
| VP_FILTER_NEAR_BOTH | Near VAL or VAH |
Parameters
- EnableVolumeProfileFilter = false
- VP_Filter_Mode = VP_FILTER_NEAR_BOTH
- VP_Filter_ATR_Distance = 2.0
- VP_ProfileBars = 50
- VP_NumBins = 50
- VP_ValueAreaVolume = 0.90
- ShowVP = false — display POC, VAH, and VAL lines
Benefits
✅ Highlights high-volume price areas
✅ Helps identify potential support and resistance zones
✅ Can filter signals based on price location relative to the value area
4.15 Signal Direction Control
📌 Purpose: Allows trading in only one specific direction.
Parameters
- EnableBuy = true — allow BUY signals
- EnableSell = true — allow SELL signals
✅ Flexible directional control
✅ Useful when the market has a clear directional trend
4.16 Early Close on Reversal
📌 Purpose: Automatically close a trade when a reversal signal is detected.
Parameter
- EnableEarlyCloseOnReversal = true
✅ Helps protect profits when the market reverses
✅ Can reduce potential losses during reversals
🕯 Closed Candle Confirmation (anti-repaint)
- EnableCandleCloseConfirmation = true
- ConfirmOnClosedBar = true
🪶 Long Wick Rejection Filter
- EnableWickFilter = true
- MaxWickToBodyRatio = 1.0
⏱ Minimum Distance Between Signals (anti-overtrading)
- EnableSignalSpacing = false
- MinBarsBetweenSignals = 5
🔄 Allow Re-entry in the Same Direction
- AllowReentrySameDirection = true
📐 Calculation Logic
BUY
SL = Entry − (ATR × SL_ATR_Multiplier) TP = Entry + (ATR × TP_ATR_Multiplier)
SELL
SL = Entry + (ATR × SL_ATR_Multiplier) TP = Entry − (ATR × TP_ATR_Multiplier)
Parameters
- SL_ATR_Multiplier = 4.0
- TP_ATR_Multiplier = 1.0
- Show_SL = false — display SL line
- Show_TP = false — display TP line
- Show_Text_Labels = false — display SL/TP price labels
- Text_Font_Size = 8
📊 Chart Display
- SL/TP lines can be displayed directly on the chart
- Optional price labels with adjustable font size
- Profit/Loss connection lines with customizable colors
P/L Drawing Settings
- EnableProfitLossDrawing = true
- ProfitLineColor = clrLime
- LossLineColor = clrRed
- ConnectionLineWidth = 1
- ConnectionLineStyle = STYLE_DOT
- PL_Text_Font_Size = 8
- ProfitTextColor = clrLime
- LossTextColor = clrRed
🔔 Popup Alerts – PopupAlerts = true
📧 Email Alerts – EmailAlerts = false
📱 Push Notifications (MT5 Mobile) – PushAlerts = false
🔛 Master Switch – EnableAlerts = true
📥 Installation Steps
- Download FiboSniper Pro from the MQL5 Market
- Open MetaTrader 5 → Navigator → Indicators
- Drag and drop FiboSniper Pro onto the chart
- Configure the parameters
⚙️ Recommended Initial Settings
Fibonacci Envelope: - MA_Period = 20 - MA_Method = MODE_EMA - ATR_Period = 14 - ATR_Multiplier = 2.0 - EnableFibo0500 = true - EnableFibo0618 = true - EnableFibo1000 = true SL/TP: - SL_ATR_Multiplier = 4.0 - TP_ATR_Multiplier = 1.0 EMA Trend Filter: - UseEMATrendFilter = true - Fast_EMA_Period = 50 - Slow_EMA_Period = 200 - Trend_EMA_Period = 400 Signal Confirmation: - ConfirmOnClosedBar = true - EnableCandleCloseConfirmation = true - EnableWickFilter = true Alerts: - EnableAlerts = true - PopupAlerts = true
For a more flexible workflow, traders can also use the Interactive Control Panel directly on the chart to enable or disable filters and system functions without reopening the indicator settings window.
⚠️ Risk per trade: 1–2%
🛑 Always use a Stop Loss
📉 Maximum daily loss: 5%
🚫 Avoid overtrading
❌ No Signals
Possible causes:
- Too many filters are enabled
- Thresholds are too restrictive
- Market is moving sideways with low ATR
- No Fibonacci levels are enabled
Solutions:
- Disable unnecessary filters
- Reduce the ATR Multiplier
- Enable additional Fibonacci levels
- Use the Interactive Control Panel to quickly disable filters directly from the chart
⚠️ Too Many Signals
Solutions:
- Enable EnableSignalSpacing and set MinBarsBetweenSignals to 5–20
- Add ADX / Volume Profile / RSI Divergence filters
- Increase the allowed wick-to-body ratio
- Enable the Market Structure filter
- Use the Interactive Control Panel to quickly activate stricter filters
📉 Incorrect SL/TP Levels
Check:
- ATR value
- Symbol digits (4-digit vs 5-digit)
- Pip calculation rules
🔔 Alerts Not Working
Check:
- Terminal → Journal
- Email / Mobile Notification settings
- Make sure EnableAlerts = true
🖥 Display Issues
Solutions:
- Refresh the chart (F5)
- Reattach the indicator
- Check the Object List (Ctrl+B)
- Avoid excessive chart objects or indicator overlays
If the Interactive Control Panel does not appear as expected, check:
- EnablePanel = true
- ShowMainPanel = true
- Panel corner and X/Y position settings
- Button size
- Chart object visibility
- Potential overlap with other indicators
🧠 Do not revenge trade
🛑 Do not modify SL/TP emotionally during an active trade
⏸ Take a break after a series of consecutive losses
📓 Maintain a trading journal
FiboSniper Pro is not a holy grail. It is a professional scalping toolset designed to help traders:
✅ Filter higher-quality trade setups
✅ Apply consistent risk management
✅ Build and refine their own trading strategy
Long-term trading success comes from:
- A robust trading system
- Strict risk management
- Strong trading psychology
- Discipline and consistency
With the addition of the Interactive Control Panel, Trend Analysis Display, and Volume Profile, FiboSniper Pro provides a more practical workflow for real-time trading.
Traders can adjust filters and system behavior directly on the chart with greater speed and convenience, while using the built-in statistics to compare and evaluate different configurations.
If you have any questions, need installation assistance, or would like recommended settings, please contact me through MQL5 Messages.
📥 Download & Support
📌 FiboSniper Pro Indicator:
https://www.mql5.com/en/market/product/168754
📌 Support:
MQL5 User Profile – minhnguyen1504



