


Review not only what you traded, but what the chart looked like when you traded it.
Most trading histories answer a few basic questions: what was opened, where was it closed, and what was the result? What they usually do not preserve is the chart context that was visible when the decision was made.
ChartLedger is a free local visual trade journal for MetaTrader 5. It records new trading activity for the attached symbol, captures chart context at entry and final close, and creates local reports for later review.
ChartLedger is observation-only. It does not send trading requests and does not open, modify, or close orders or positions. Link to the product
Why Visual Context Matters
A trade result alone cannot explain the decision behind it.
At the moment of entry, the chart may have shown a specific market structure, an indicator reading, a manually drawn level, a session range, support or resistance, or another piece of information that influenced the decision.
A trading history preserves the numbers. A screenshot preserves the context.
ChartLedger combines both so that a trade can later be reviewed together with the chart that was actually visible while the trade was taking place.
This can be useful for:
- Reviewing manual execution.
- Studying trades opened from the MetaTrader mobile or web terminal.
- Analysing trades opened by another Expert Advisor.
- Comparing the original chart context with the final outcome.
- Keeping separate reports for automated strategies using magic numbers.
ChartLedger does not attempt to recreate the past later. It records the chart context while the trading activity is happening.
From Trade to Journal Record
- Attach ChartLedger to a chart for the symbol you want to journal.
- When a new trade is detected, ChartLedger can capture the current chart at entry.
- When the trade is fully closed, ChartLedger can capture the final chart context and complete the journal record.
- Use Snapshot whenever you want to save an additional chart image manually.
- Keep Enable Live Report enabled to refresh one current local report as the journal changes.
- Use Export to create a timestamped local review folder.
The screenshots reflect the chart at capture time, including:
- Current timeframe.
- Visible price action.
- Indicators.
- Drawing objects.
- Chart colors and layout.
Initial Setup
Start with one chart and one symbol.
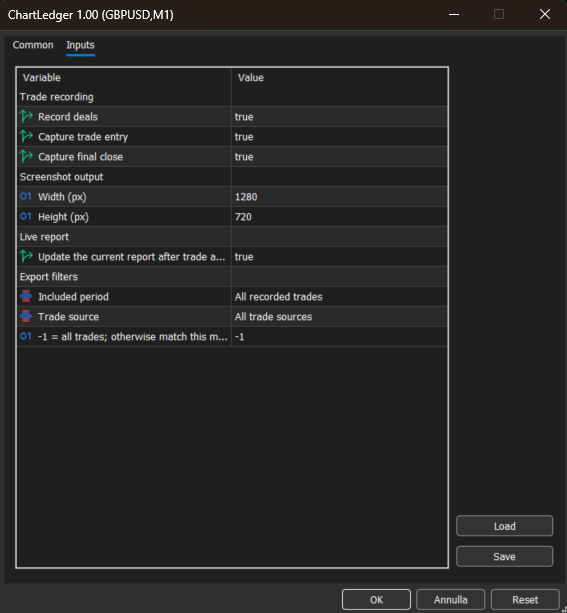
Attach ChartLedger, keep Enable Trade Recording enabled, and choose whether opening and final-close screenshots should be captured automatically.
If you want to journal more than one symbol, attach one ChartLedger instance to each additional symbol.
For example:
- ChartLedger on EURUSD records EURUSD activity.
- ChartLedger on XAUUSD records XAUUSD activity.
- Each symbol keeps its own journal state and export history.
Only one ChartLedger instance can run for the same symbol. A second instance is refused to prevent duplicate records and protect the local journal state.
If another Expert Advisor is already running on the symbol, ChartLedger can be attached to a separate chart of the same symbol. This keeps the journal interface separate while still allowing ChartLedger to observe new account activity for that symbol.
What ChartLedger Records
- Buy or sell direction.
- Entry and exit prices.
- Trade volume.
- Trade duration.
- Gross trading profit.
- Commission.
- Swap.
- Net profit.
- Result in points and pips.
- Result in R when the initial trade risk is available.
- Trade source.
- Magic number.
- Order comment.
- Automatic exit reason when available.
- Chart screenshots captured at entry and final close.
- Full closes, partial closes, and netting reversals as separate journal records where applicable.
Manual Trades, Mobile Trades, and Other Expert Advisors
ChartLedger does not require the trade to be opened from the same chart.
It can record new activity for the attached symbol when the trade was opened:
- Manually from the desktop terminal.
- From the MetaTrader mobile application.
- From the MetaTrader web terminal.
- By another Expert Advisor.
As long as ChartLedger is running in the desktop MetaTrader terminal for that symbol, it can observe the new trading activity and create the journal record.
Organizing Automated Strategies with Magic Numbers
ChartLedger records activity for the attached symbol, while the export filters determine which recorded trades are included in a specific report.
The Magic Number Filter can be used to isolate one automated strategy from other activity on the same symbol.
For example, if two Expert Advisors trade EURUSD with different magic numbers, ChartLedger can keep the symbol journal while allowing separate exports for each strategy.
Use:
- -1 to include all recorded trades for the symbol.
- A specific magic number to include only trades belonging to that strategy.
On-Chart Dashboard
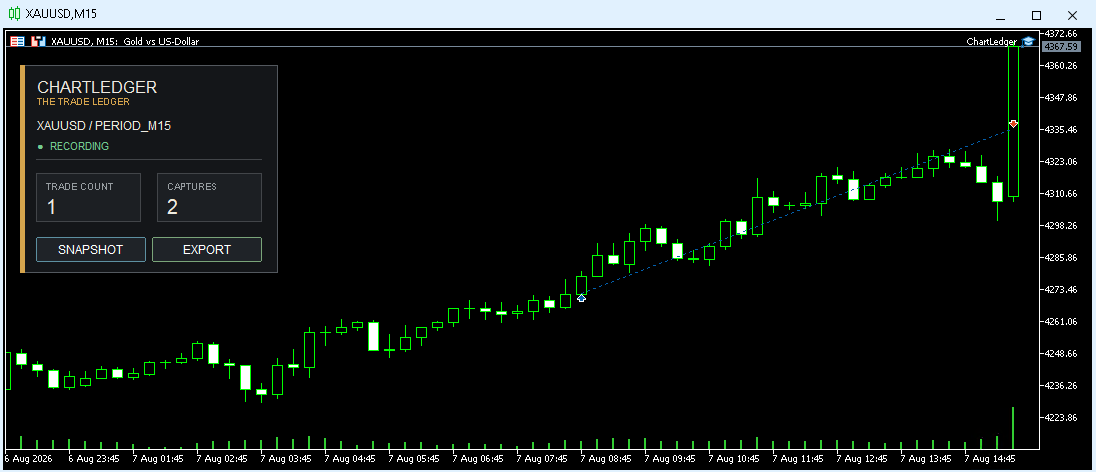
The compact dashboard shows the current ChartLedger status directly on the chart.
It includes:
- Attached symbol.
- Recording status.
- Number of recorded trades.
- Number of captured screenshots.
The dashboard also provides two main actions:
- Snapshot - saves an additional chart image manually.
- Export - creates a local review package using the selected filters.
Creating an Export
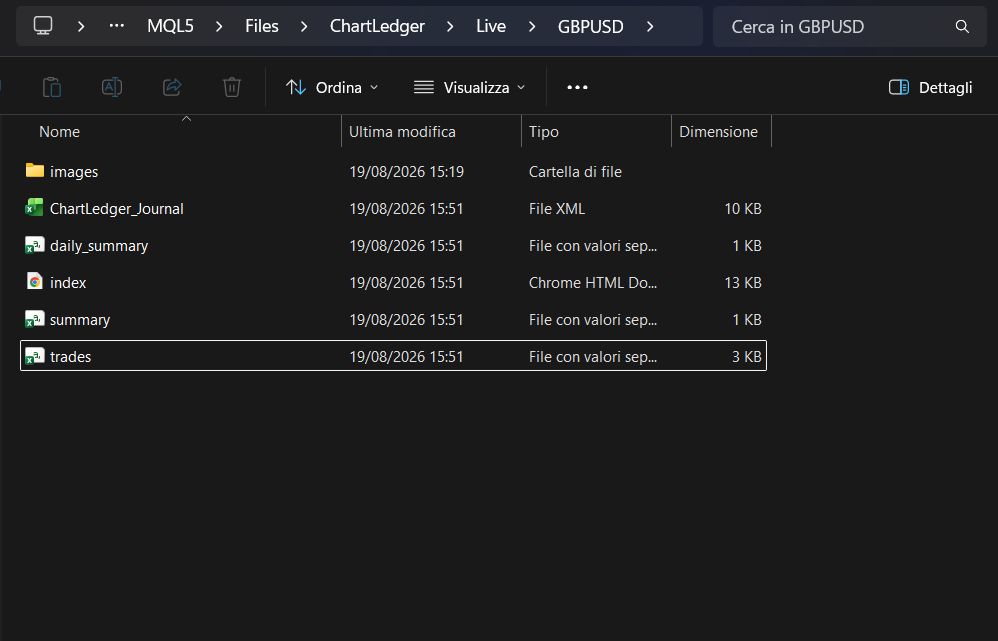
Press Export on the ChartLedger dashboard to create a timestamped local folder under:
MQL5\Files\ChartLedger\Exports
Each export can contain:
- index.html - interactive visual report.
- ChartLedger_Journal.xml - Excel-compatible workbook.
- trades.csv - detailed trade records.
- summary.csv - overall summary metrics.
- daily_summary.csv - results grouped by trading day.
- images - local copies of the screenshots referenced by the HTML report.
Every export receives its own timestamped folder, so previous reports remain separate and can be archived, copied, or analysed independently.
The HTML Report
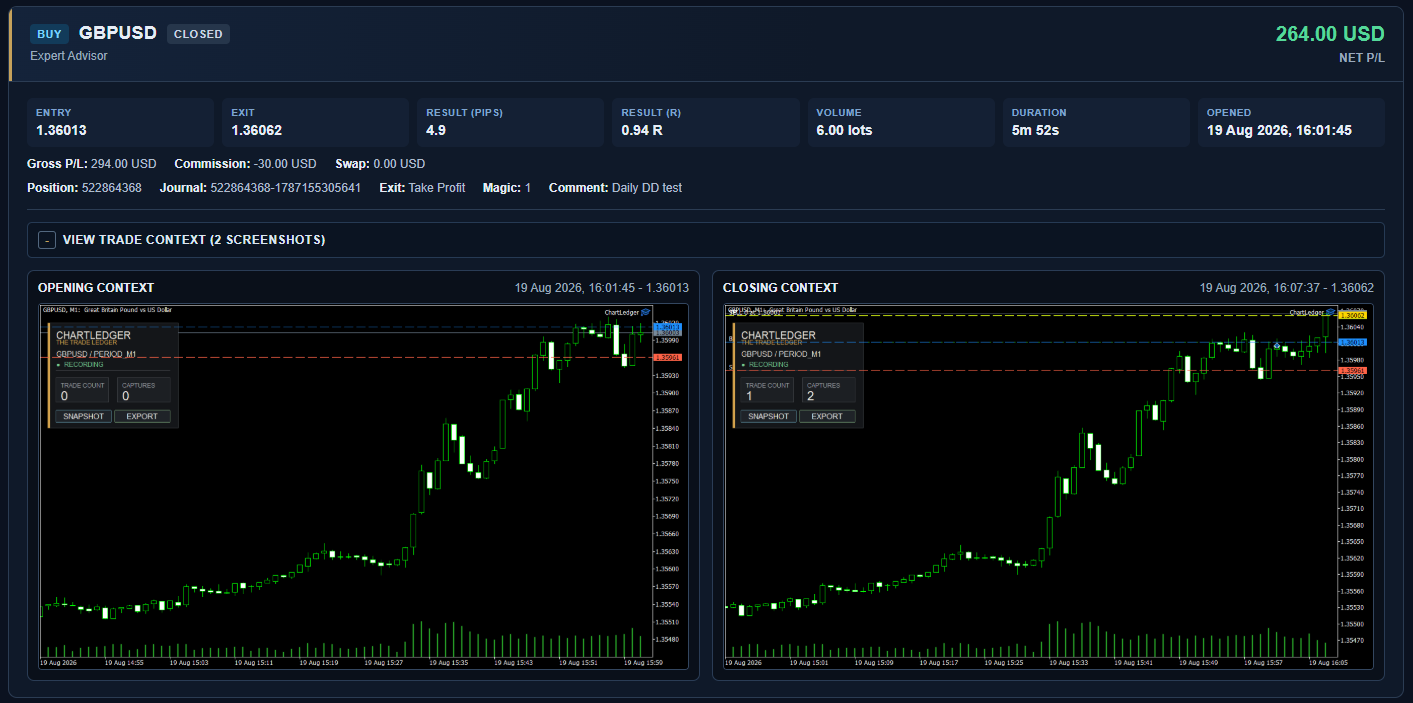
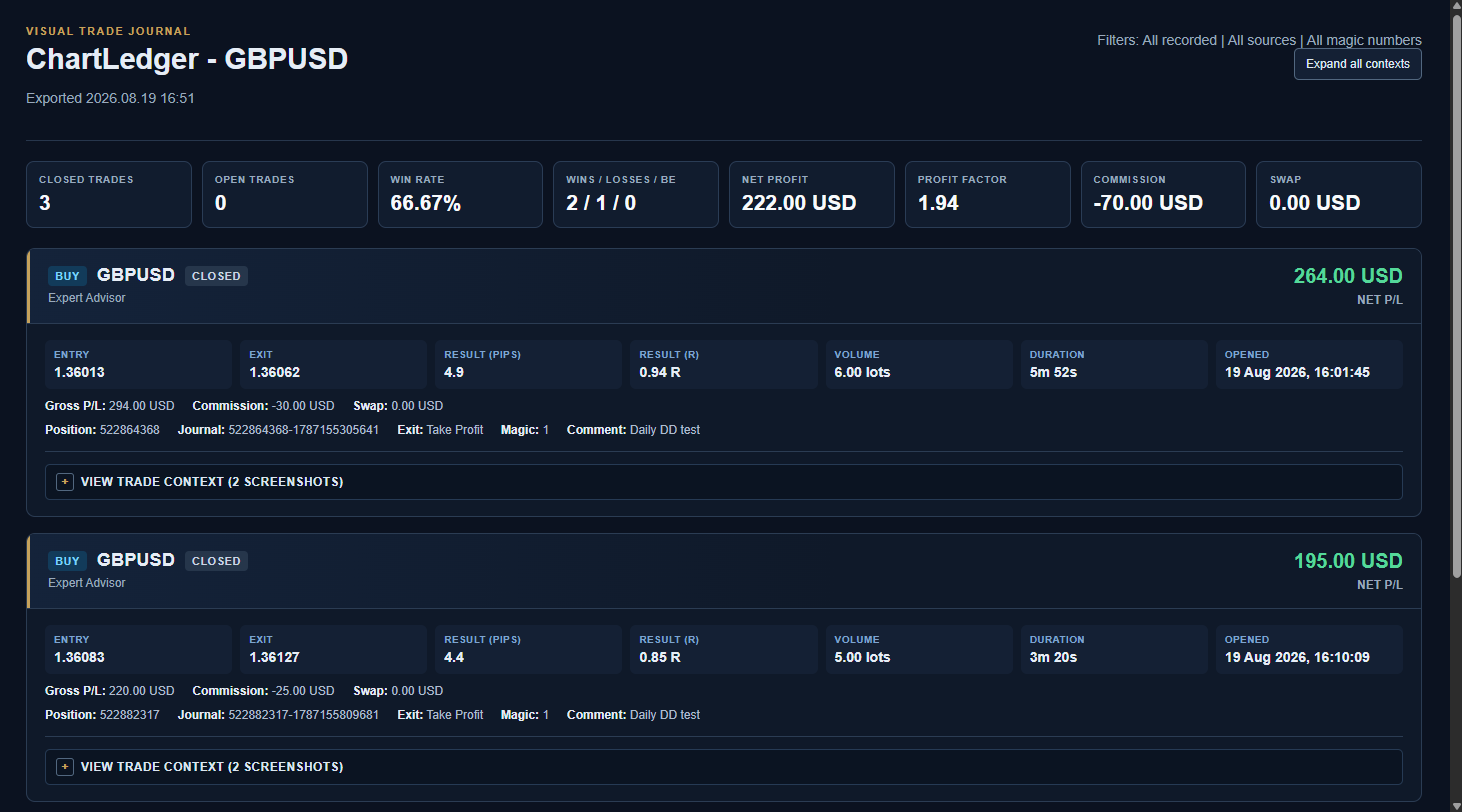
The index.html file is designed for trade-by-trade visual review.
Open it in a browser to see the exported period, summary metrics, and individual trade records.
The report can include:
- Closed and open trade count.
- Win rate.
- Net profit.
- Profit factor.
- Total commission.
- Total swap.
- Individual trade cards.
- Expandable opening and closing chart context.
- Image zoom.
Each trade card allows the numerical result to be reviewed together with the visual context in which the trade was opened and eventually closed.
A Practical Review Workflow
Start with the summary section of the HTML report.
This gives a compact overview of the selected trade set before individual trades are analysed.
Then open a trade record and compare:
- Entry and exit prices.
- Result in pips.
- Result in R.
- Volume.
- Trade duration.
- Commission and swap.
- Opening chart context.
- Closing chart context.
The goal is not simply to decide whether a trade won or lost.
The more useful question is whether the entry, risk, and management made sense when compared with the chart information that was actually visible at the time.
Using the Excel-Compatible Workbook
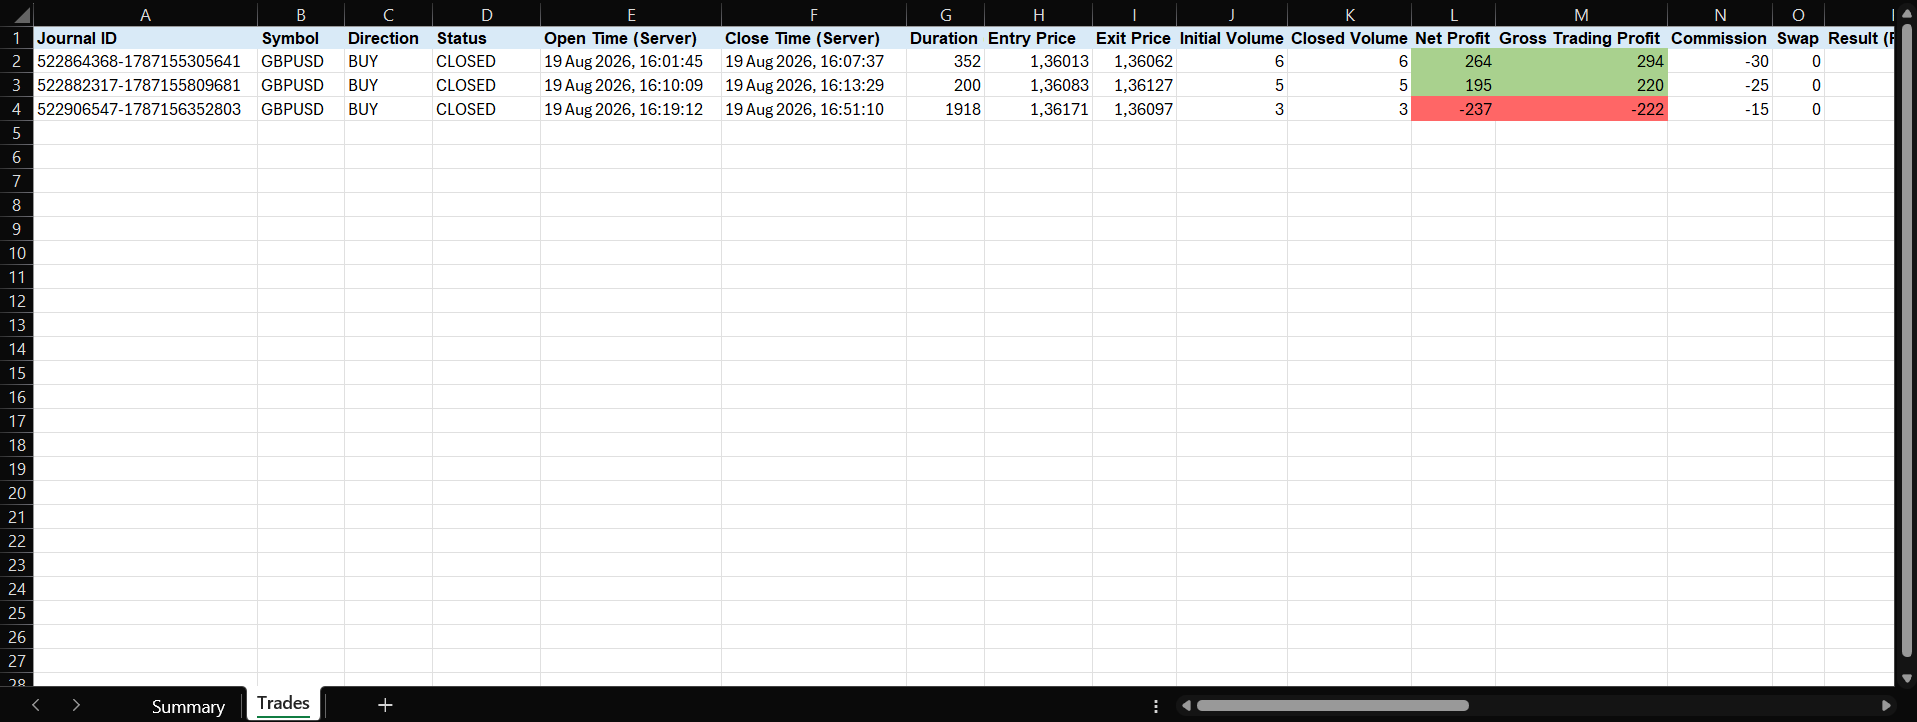
ChartLedger_Journal.xml is an Excel-compatible workbook containing Summary and Trades sheets.
The Summary sheet provides a compact view of the exported period.
The Trades sheet keeps the underlying information in separate columns, including:
- Prices.
- Volume.
- Profit and loss.
- Trade duration.
- Trade source.
- Magic number.
- Comment.
- Exit reason.
- Screenshot paths.
This makes the journal suitable for sorting, filtering, and further review without manually copying trade data from MetaTrader.
Using the CSV Files
The CSV exports are intended for traders who want to use their own analysis workflow.
ChartLedger can create:
- trades.csv for individual trade records.
- summary.csv for overall metrics.
- daily_summary.csv for daily performance.
The files use a semicolon separator and can be imported into spreadsheet software, databases, or custom analysis tools.
Export Filters
The export can be limited without changing the underlying local journal.
- Export Period - all recorded trades, today, last 7 days, or current month.
- Export Source - all sources, manual, Expert Advisor, or other.
- Magic Number Filter - all trades or one specific automated strategy.
This makes it possible to create different reports from the same symbol journal without duplicating the recorded data.
Questions Before You Start
Does ChartLedger import my older account history?
No. ChartLedger records new activity detected while it is attached. It preserves its own local journal between restarts, but it does not reconstruct trades that occurred before recording began.
Can ChartLedger record trades opened from the MetaTrader mobile app?
Yes. If ChartLedger is running in the desktop terminal for that symbol, it can observe new account activity even when the trade was opened from the MetaTrader mobile or web terminal.
Can it record trades opened by another Expert Advisor?
Yes. ChartLedger can observe new activity for its attached symbol without managing the other Expert Advisor or its positions.
Can ChartLedger manage or interfere with my trades?
No. ChartLedger is observation-only. It does not send trading requests and does not open, modify, or close orders or positions.
Can I use ChartLedger on several symbols?
Yes. Attach one separate ChartLedger instance to each symbol you want to journal.
Can I run two ChartLedger instances on the same symbol?
No. A second instance for the same symbol is refused to protect the journal state and prevent duplicate records.
Where are the exports stored?
They are stored locally under MQL5\Files\ChartLedger\Exports inside the MetaTrader terminal data folder. Each export creates a separate timestamped folder.
Does ChartLedger require a cloud account or external service?
No. Journal data, screenshots, and exports remain local to the MetaTrader terminal data folder.
Important Operating Notes
- Run only one ChartLedger instance per symbol.
- Attach a separate instance for every additional symbol you want to journal.
- ChartLedger records new activity detected while it is running and does not reconstruct trades that occurred before recording began.
- Screenshot captures reflect the current chart state at capture time.
- R results are available only when the initial trade risk can be determined.
- All journal data and exports remain local in the MetaTrader terminal data folder.
- No external account, cloud service, or web service is required.
- ChartLedger is a record-keeping and review utility. It does not provide trading signals and does not guarantee trading results.
Final Thoughts
A trading journal becomes more useful when the result is connected to the context in which the decision was made.
ChartLedger is designed to preserve that connection without changing the trading process itself. It observes new activity, saves the chart context, and turns the recorded information into local reports that can be reviewed visually or analysed with spreadsheet tools.
The result is a journal that keeps both sides of the trade review together: the numbers and the chart.


![[EURUSD]: Weekly Liquidity Activation Points (LAP), October 12-16, 2026](https://c.mql5.com/6/1035/splash-preview-777305.png "[EURUSD]: Weekly Liquidity Activation Points (LAP), October 12-16, 2026")
![[XAUUSD]: Weekly Liquidity Activation Points (LAP), October 12-16, 2026](https://c.mql5.com/6/1035/splash-preview-777299.png "[XAUUSD]: Weekly Liquidity Activation Points (LAP), October 12-16, 2026")
![[Nasdaq]: Weekly Liquidity Activation Points (LAP), October 12-16, 2026](https://c.mql5.com/6/1035/splash-preview-777311.png "[Nasdaq]: Weekly Liquidity Activation Points (LAP), October 12-16, 2026")