| SMC Pro ToolKit is a professional Smart Money Concepts analysis workspace for MetaTrader 5. It combines market structure, multi-timeframe analysis, institutional price zones, setup evaluation, confirmation tools, volume context, alerts, and risk planning inside one organized chart environment. This user guide is designed to help you understand the main pages, core tools, workflow logic, and practical usage of the system. Whether you are new to the product or want to explore its full capabilities, this guide will walk you through the key components step by step. |
In this guide you will learn:
- How the main pages are organized
- How to read the most important tools
- How to use setup context and confirmations
- How to use alerts and risk planning features
- How to build a more structured trading workflow with SMC Pro ToolKit
Table of Contents
- Introduction
- Candle Zoom
- Currency Power
- Market Insight
- LRC Channel
- Main Decision
- Market Pulse
- MTF Structure
- Opening Range
- Risk Command Center
- Session Range
- Signal Log
- Smart Zones
- Trend Lines
- Trend Radar
- Smart Volume Structure
- Signal Alerts
- CISD
1. Introduction SMC Pro ToolKit is built to organize market structure, context, confirmation, and trade planning into one structured workspace. Instead of using separate tools across multiple windows, the system combines analysis panels, multi-timeframe context, trade evaluation, alerts, and risk tools in one chart environment. The goal is not to replace trader judgment, but to help the trader read context more clearly, plan setups more efficiently, and work with a more organized decision-making process.
|
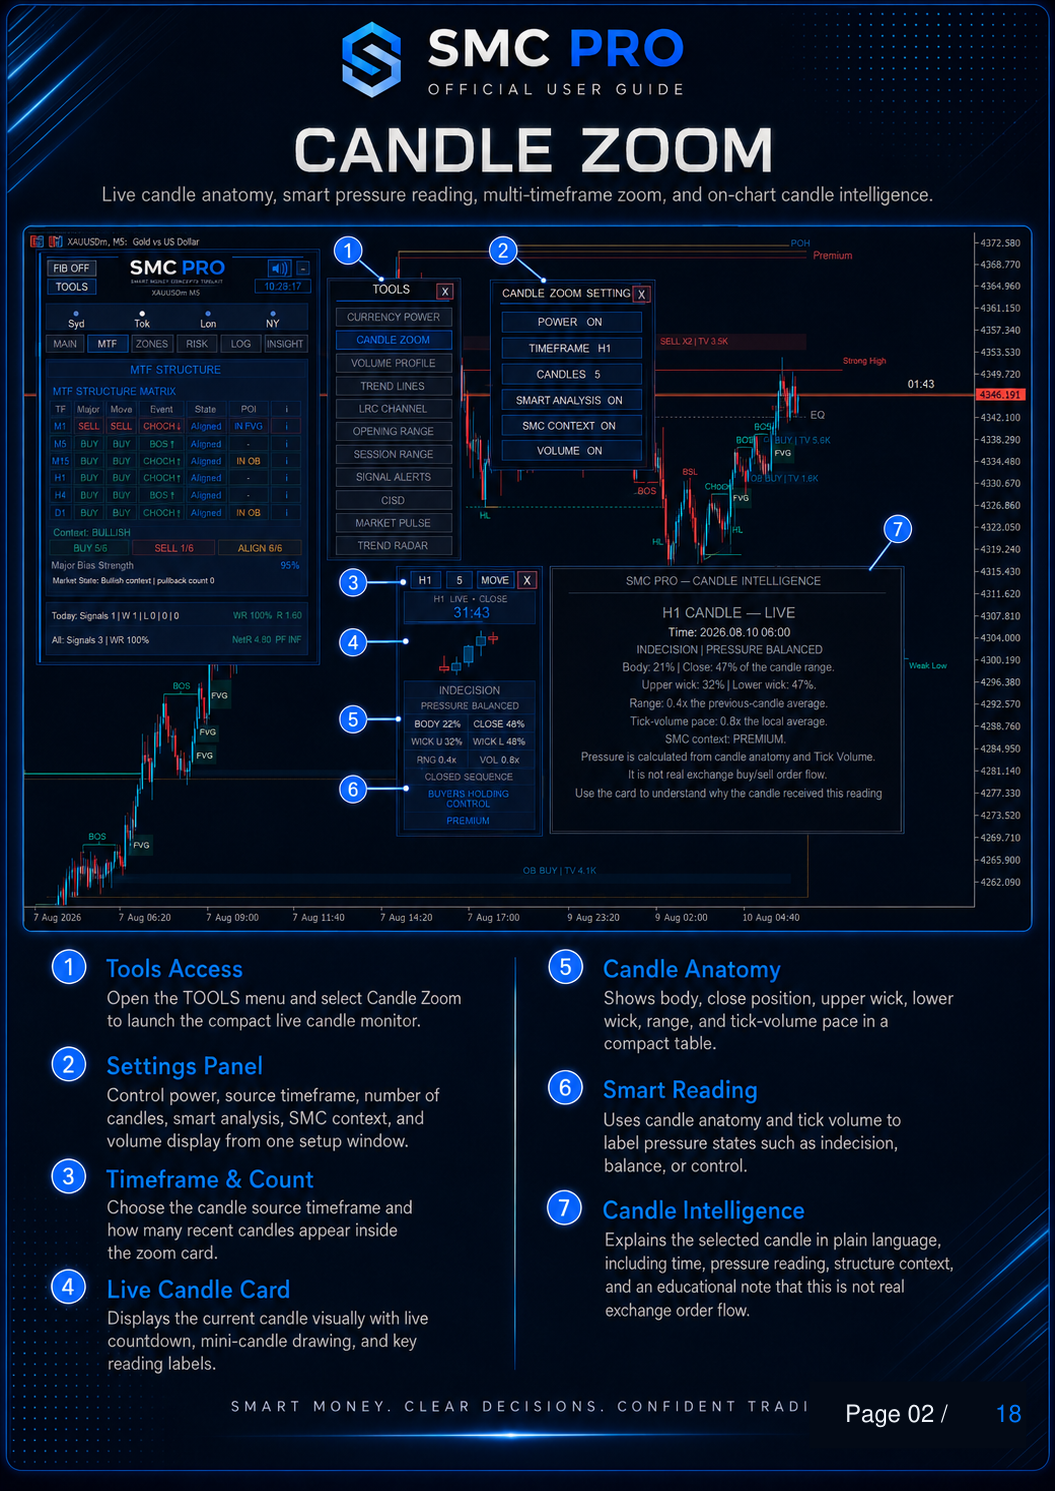
2. Candle Zoom Candle Zoom is designed to provide a focused candle-reading view directly on the chart. It helps you inspect live candle behavior, view internal candle anatomy, monitor mini-chart behavior, and understand short-term pressure in a more compact visual format. Main functions of Candle Zoom: - Opens from the TOOLS menu
- Displays a zoomed candle view
- Shows candle anatomy
- Includes smart reading support
- Helps explain the currently selected candle in plain language
Usage note:
Candle Zoom is a visual support tool. It is useful for reading candle behavior and short-term context, but it should be used together with structure and setup logic.
|
3. Currency Power Currency Power provides a live relative-strength view designed to compare currencies and selected assets from one compact panel. It helps identify current strength, directional persistence, momentum behavior, and relative performance without switching between multiple charts. Main functions of Currency Power: - Opens directly from the TOOLS menu
- Displays live strength readings in one panel
- Ranks assets by relative strength
- Shows momentum-state labels
- Measures directional persistence
- Displays a Power Spread comparison
- Provides detailed hover-based analysis
How to read it:
The strength table helps identify which assets are currently stronger or weaker, while the Persistence Score helps distinguish short-lived movement from more sustained directional behavior. The Power Spread adds another layer of relative comparison, while Hover Analysis provides a simplified explanation of the selected currency or asset. Usage note:
Currency Power is best used as a market-context tool alongside structure, zones, and the active setup. 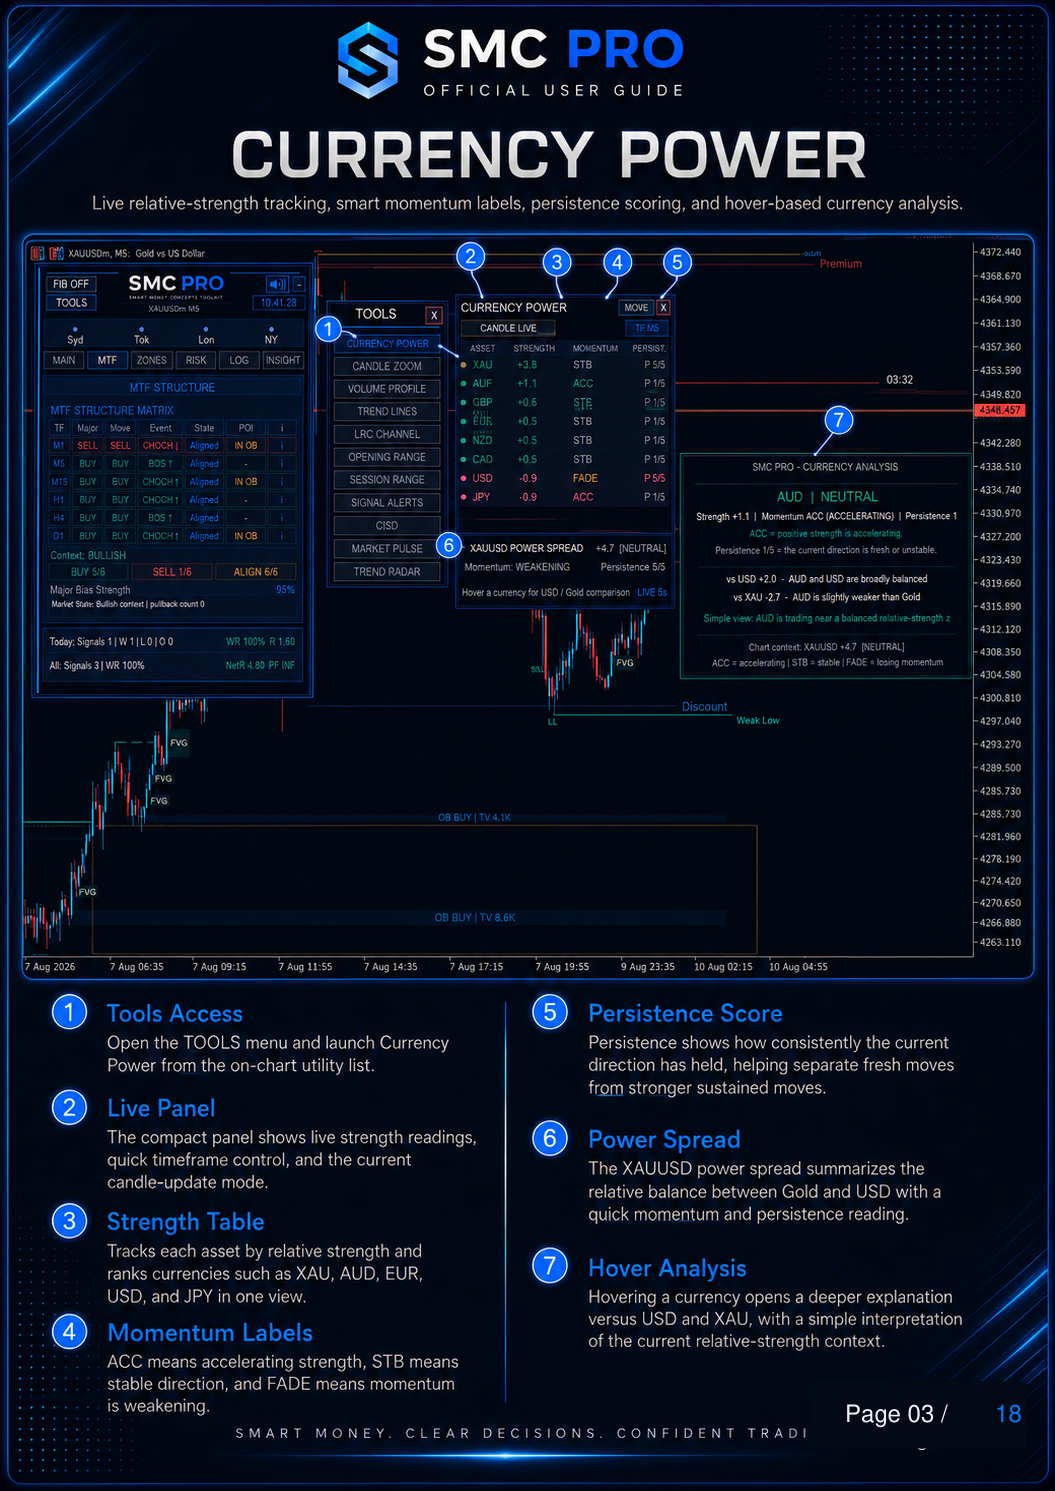
|
4. Market Insight
Market Insight summarizes the current market context and provides structured next-action guidance from one dedicated page. It combines directional context, structural alignment, setup location, point-of-interest information, and a simplified market verdict. Main functions of Market Insight: - Introduces the current market context
- Shows structural alignment and stack information
- Displays current price location and context quality
- Summarizes the active point-of-interest condition
- Provides a directional Market Verdict
- Displays a suggested Next Action when additional detail is required
How to read it:
Start with the market context, then review structural alignment and location. The POI section shows the current point-of-interest condition, while Market Verdict provides a simplified directional interpretation. Usage note:
Market Insight is designed to summarize information from the wider system. It should be read as context rather than as a standalone entry signal. 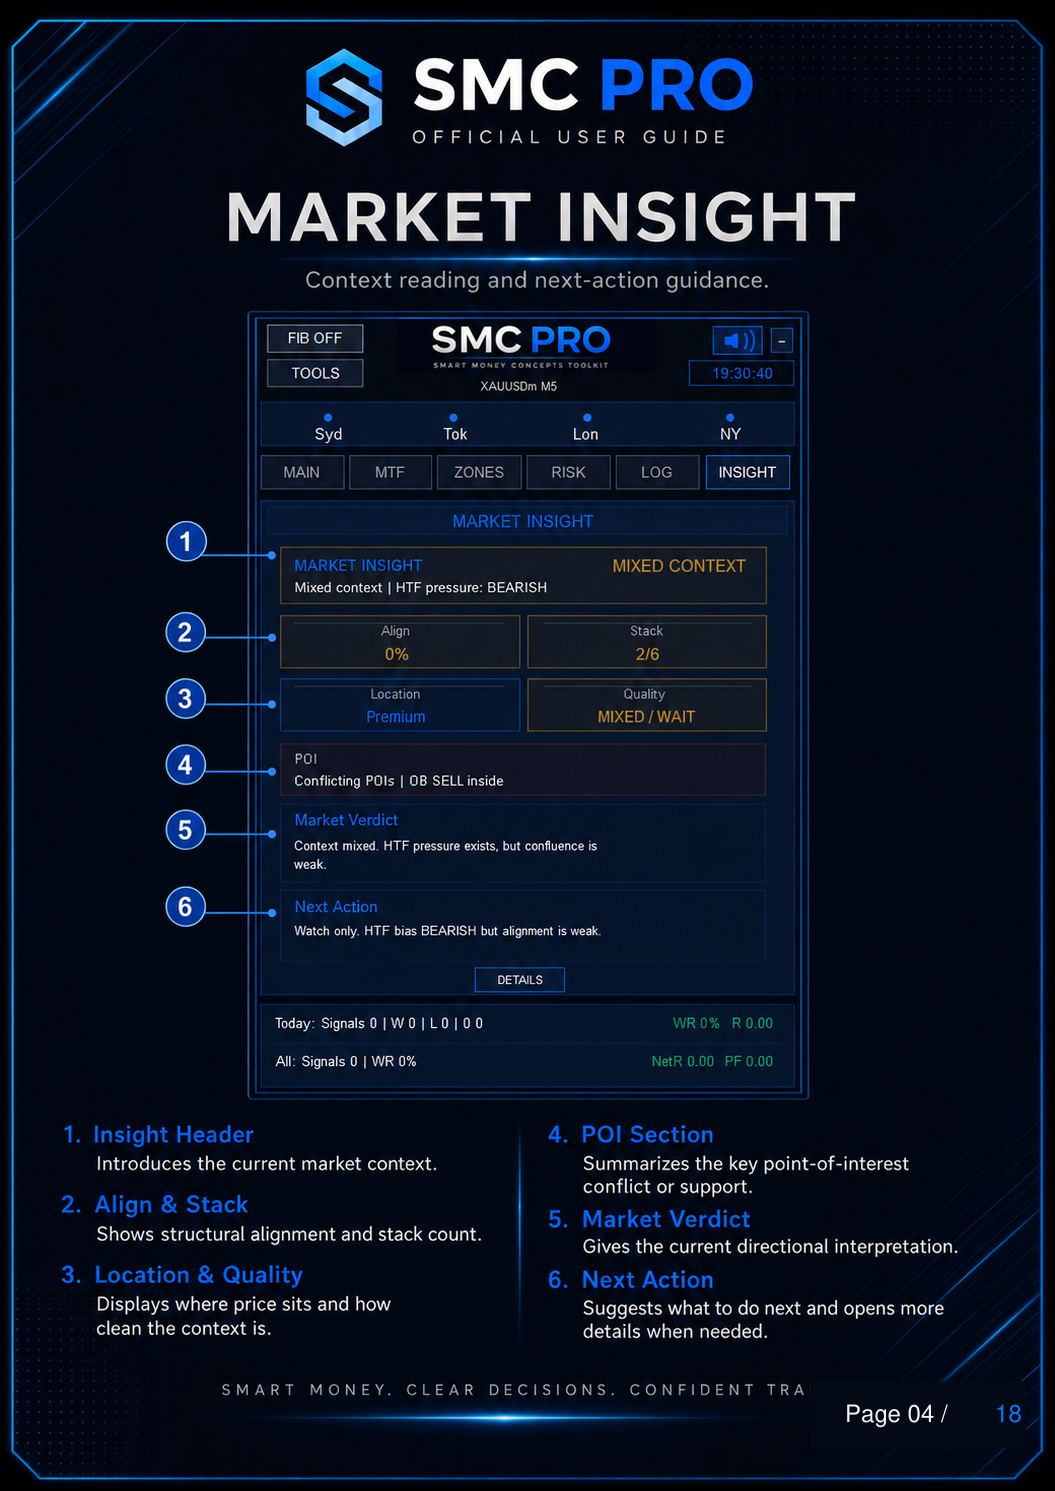
|
5. LRC Channel
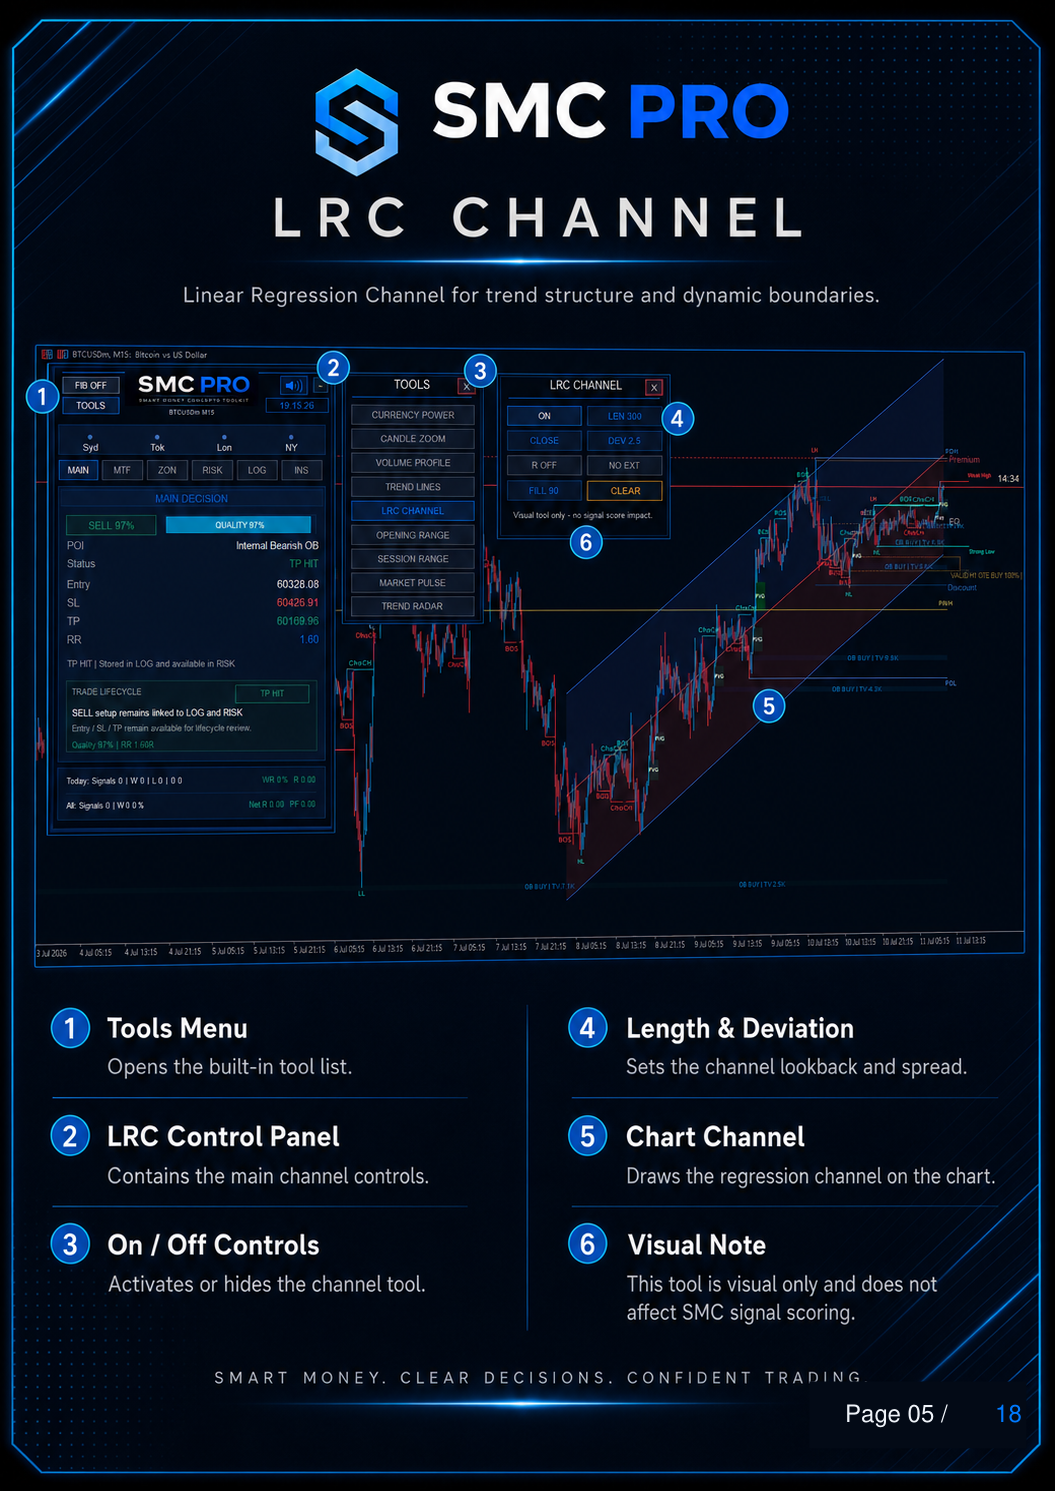
LRC Channel is a Linear Regression Channel tool designed to visualize trend structure and dynamic price boundaries. It provides an adjustable regression channel directly on the chart for visual trend analysis. Main functions of LRC Channel: - Opens from the TOOLS menu
- Includes a dedicated control panel
- Can be enabled or disabled independently
- Provides Length and Deviation controls
- Draws the regression channel directly on the chart
- Allows the channel lookback and spread to be adjusted
Usage note:
LRC Channel is a visual analysis tool and does not affect SMC signal scoring.
|
6. Main Decision Main Decision is the central trade-plan overview of SMC Pro ToolKit. It summarizes the current trade direction, setup quality, point of interest, setup status, trade levels, and lifecycle information in one page. Main functions of Main Decision: - Displays active market-session information
- Provides navigation between MAIN, MTF, ZONES, RISK, LOG, and INSIGHT pages
- Shows the current trade direction and setup quality
- Identifies the active point of interest and setup status
- Displays Entry, Stop Loss, Take Profit, and Risk-to-Reward values
- Keeps the active setup connected with LOG and RISK information
- Displays summary performance information
How to read it:
Begin with Direction and Quality. Then verify the POI and current setup status before reviewing Entry, SL, TP, and RR. The Trade Lifecycle area shows whether the setup remains active and keeps the trade-plan information available for later review. Usage note:
Main Decision should be treated as the central summary page. More detailed information can be reviewed through the dedicated MTF, ZONES, RISK, LOG, and INSIGHT pages. 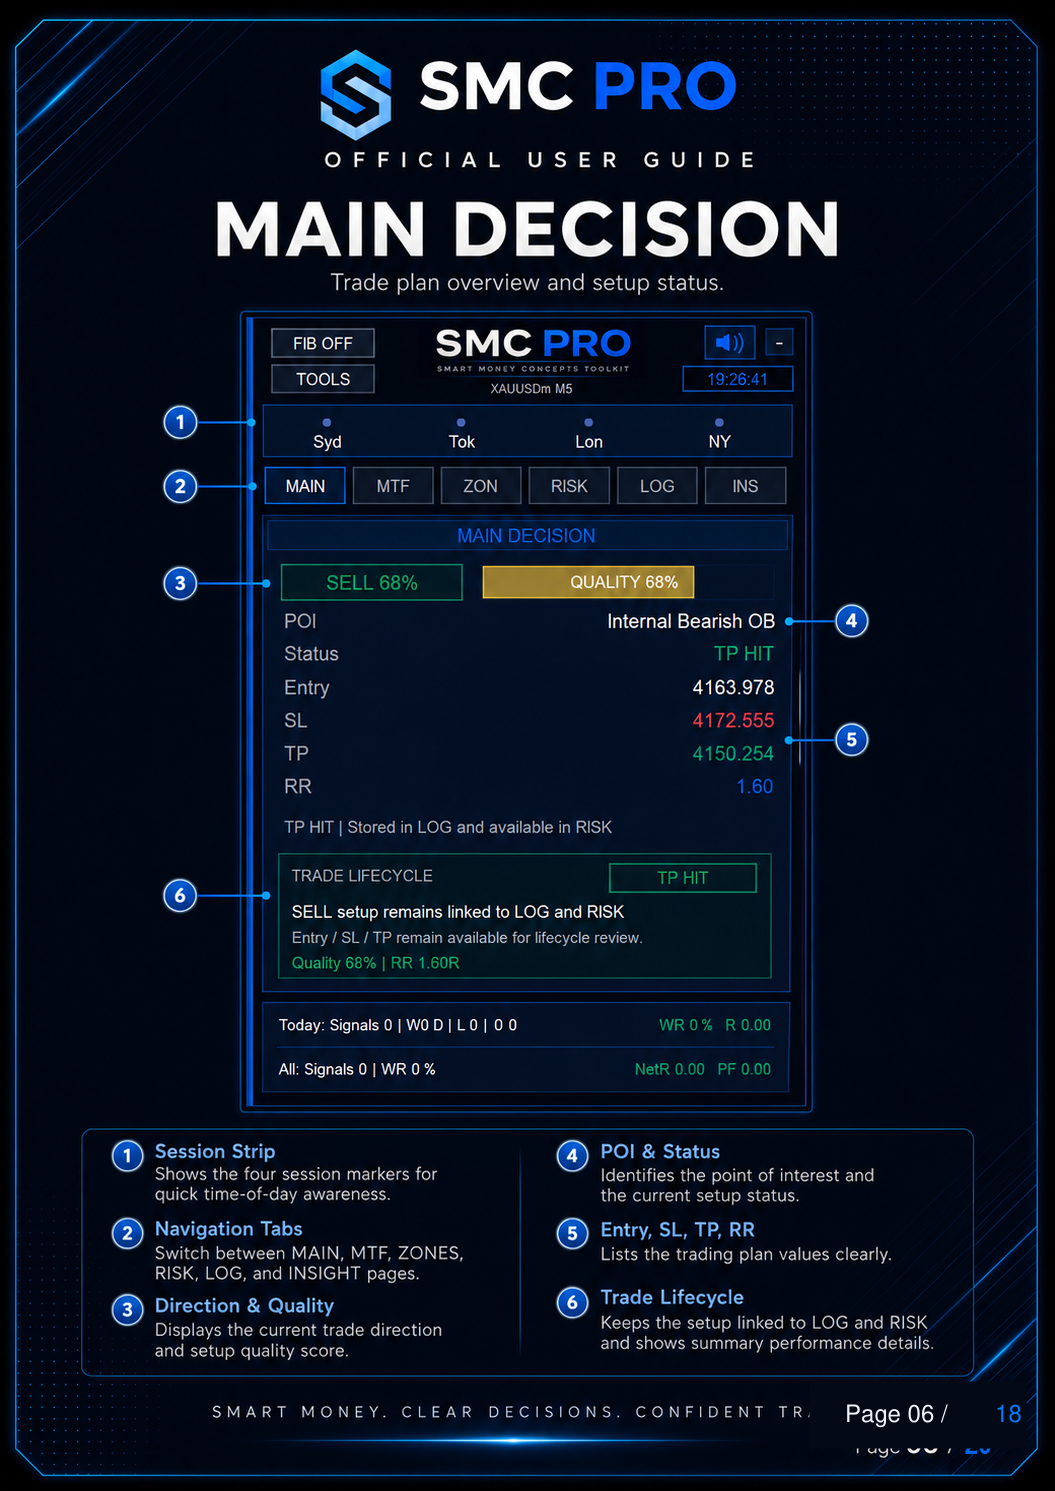
|
7. Market Pulse
Market Pulse provides a live market-pressure view using a visual pressure gauge and supporting indicator readings. It is designed to help interpret current buying or selling pressure alongside the active SMC structure. Main functions of Market Pulse: - Opens from the TOOLS menu
- Displays a live buy-versus-sell pressure gauge
- Uses supporting readings such as ADX, DMI, and RSI
- Displays important market-condition information
- Summarizes the current momentum state
- Provides a plain-language Pulse Explainer
- Adds market-pressure context directly to the chart
How to read it:
The Pressure Gauge provides the main visual balance between buyers and sellers. Supporting readings help explain the current condition, while the Status Line summarizes whether pressure is accelerating, weakening, or remaining balanced. The Pulse Explainer translates these readings into simpler market language. Usage note:
Market Pulse is a supporting context tool and should be used alongside the active SMC market structure. 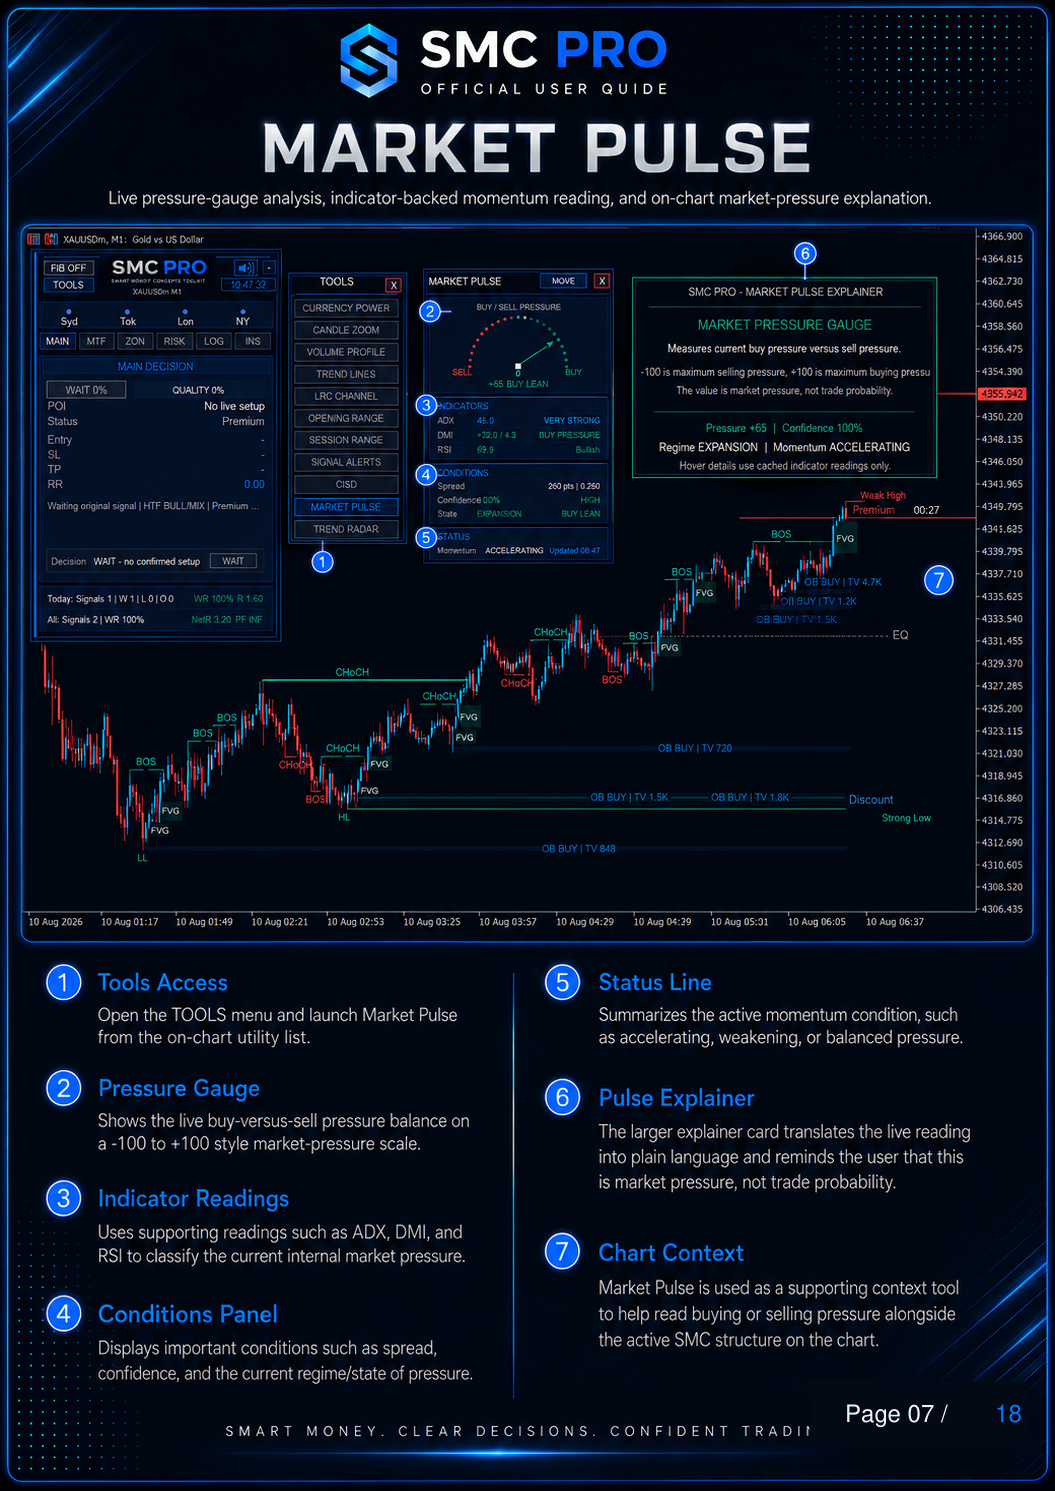
|
8. MTF Structure
MTF Structure provides a multi-timeframe direction matrix designed to show structural alignment across several timeframes. It helps identify the broader market bias, the latest structural events, and the level of agreement between timeframes. Main functions of MTF Structure: - Tracks multiple timeframes from M1 to D1
- Shows the major directional bias
- Displays the latest BOS or CHOCH event
- Indicates whether each timeframe is aligned with the broader context
- Shows whether a valid order block is present
- Provides a combined bullish, bearish, and alignment summary
How to read it:
Review the Major Bias first, then compare the Move and Event columns across the available timeframes. The State column shows whether each timeframe agrees with the broader context. The POI column highlights the presence of a valid order block when applicable. The Context Summary provides a quick overall view of bullish, bearish, and aligned conditions. 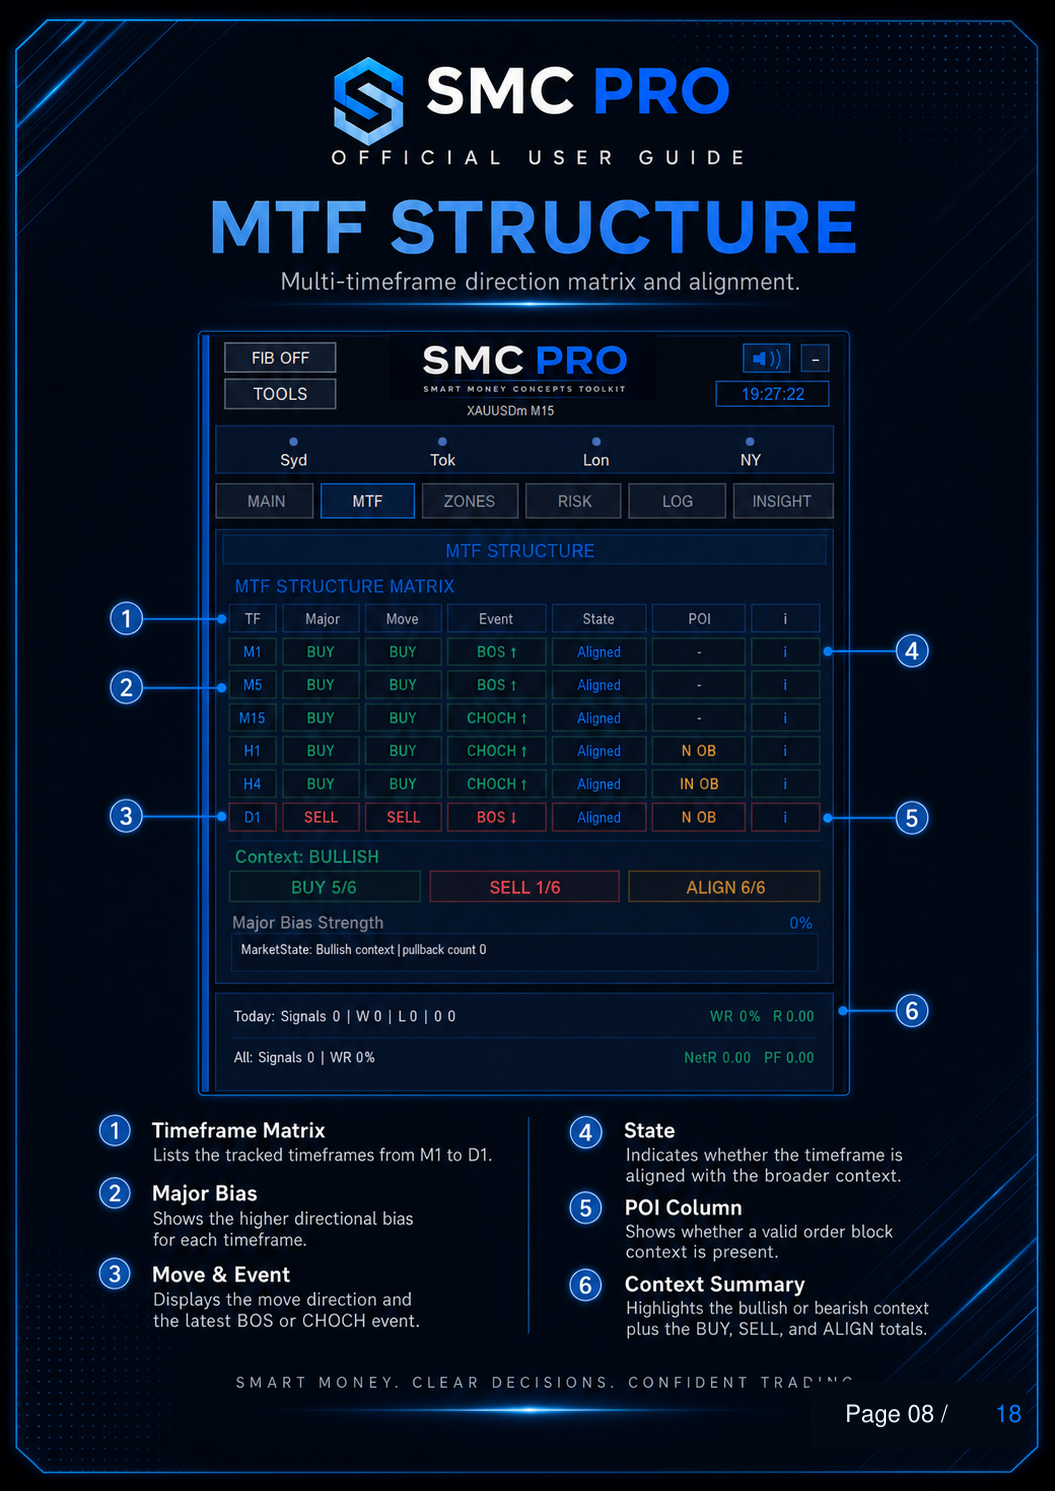
|
9. Opening Range
Opening Range is designed to map the early-session trading range and provide breakout context directly on the chart. It identifies the session range visually and marks the Opening Range High and Opening Range Low. Main functions of Opening Range: - Opens from the TOOLS menu
- Includes a dedicated Opening Range control panel
- Provides power and range controls
- Draws the session opening-range box
- Marks ORH and ORL levels
- Provides visual breakout context on the chart
Usage note:
Opening Range is a visual market-context tool and does not affect SMC signal scoring. 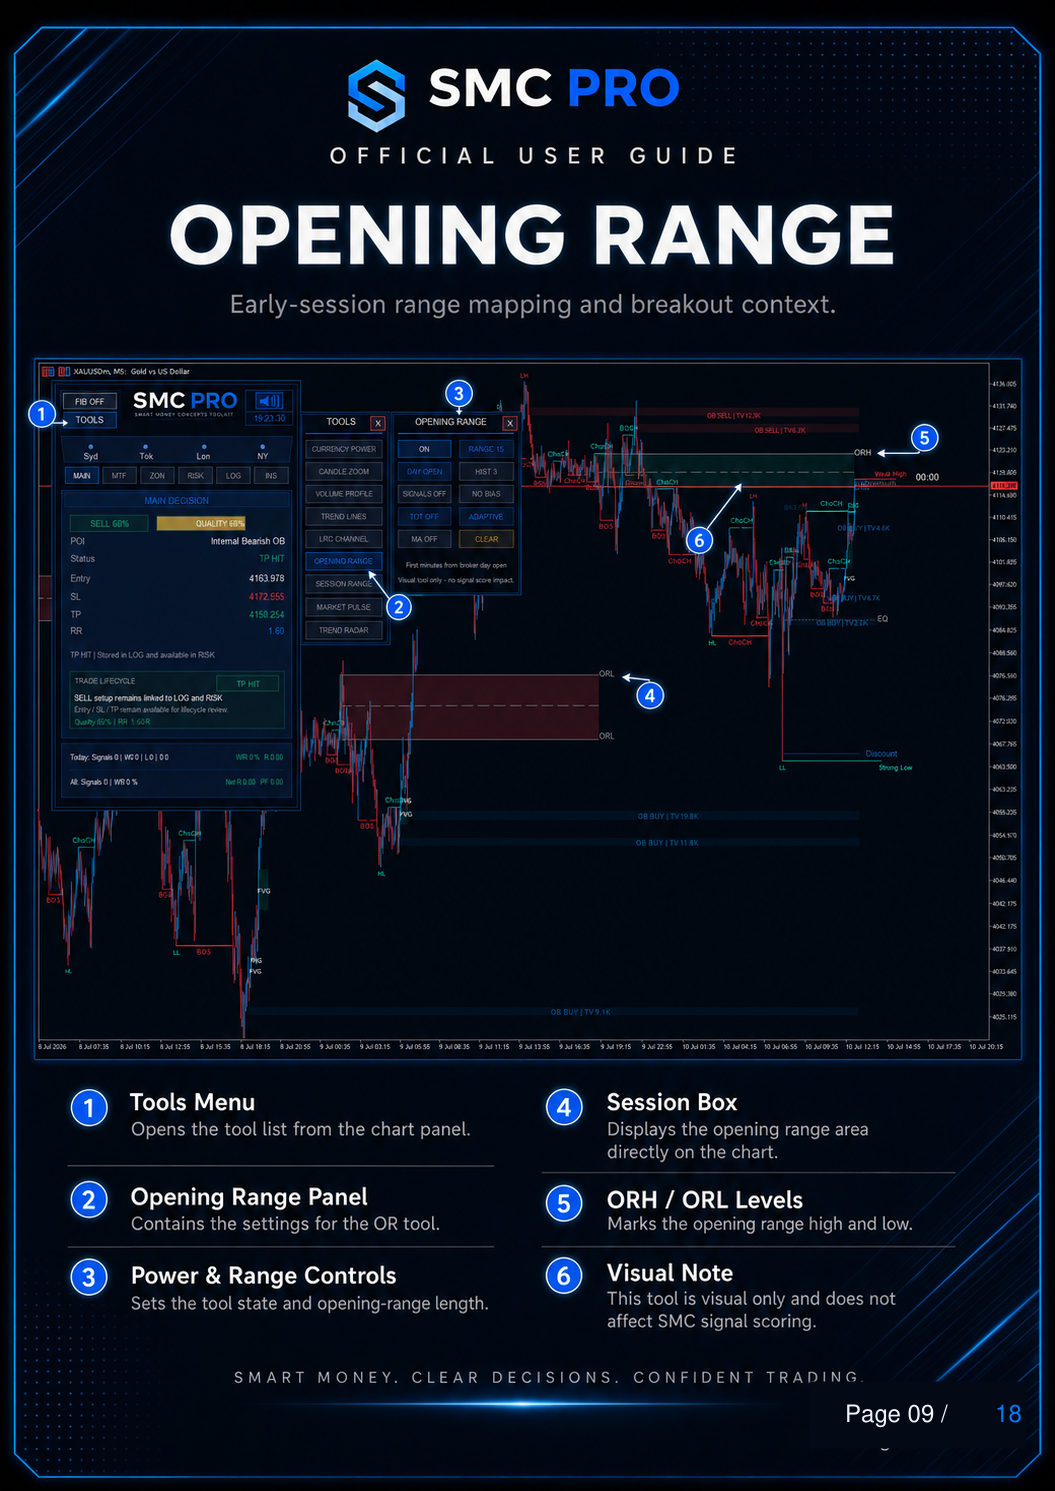
|
10. Risk Command Center
Risk Command Center is the position-sizing and trade-planning workspace of SMC Pro ToolKit. It organizes risk percentage, position size, reward planning, setup grade, and important risk metrics in one page. Main functions of Risk Command Center: - Provides AUTO and SHOW PLAN modes
- Includes manual BUY, SELL, CLEAR, and RESET planning controls
- Allows account risk percentage to be adjusted
- Calculates or adjusts position size through Auto Lot controls
- Displays setup Grade and Risk-to-Reward information
- Shows important risk metrics such as loss risk, reward, budget, spread, and margin information
- Keeps Entry, SL, and TP values visible during trade planning
How to read it:
Start with the selected Risk Percent and confirm the proposed position size. Then review the setup Grade and RR before checking the Risk Metrics area for the estimated loss, reward, available budget, spread, and margin-related information. Usage note:
Always review spread, setup quality, and margin conditions before relying on the displayed risk plan. 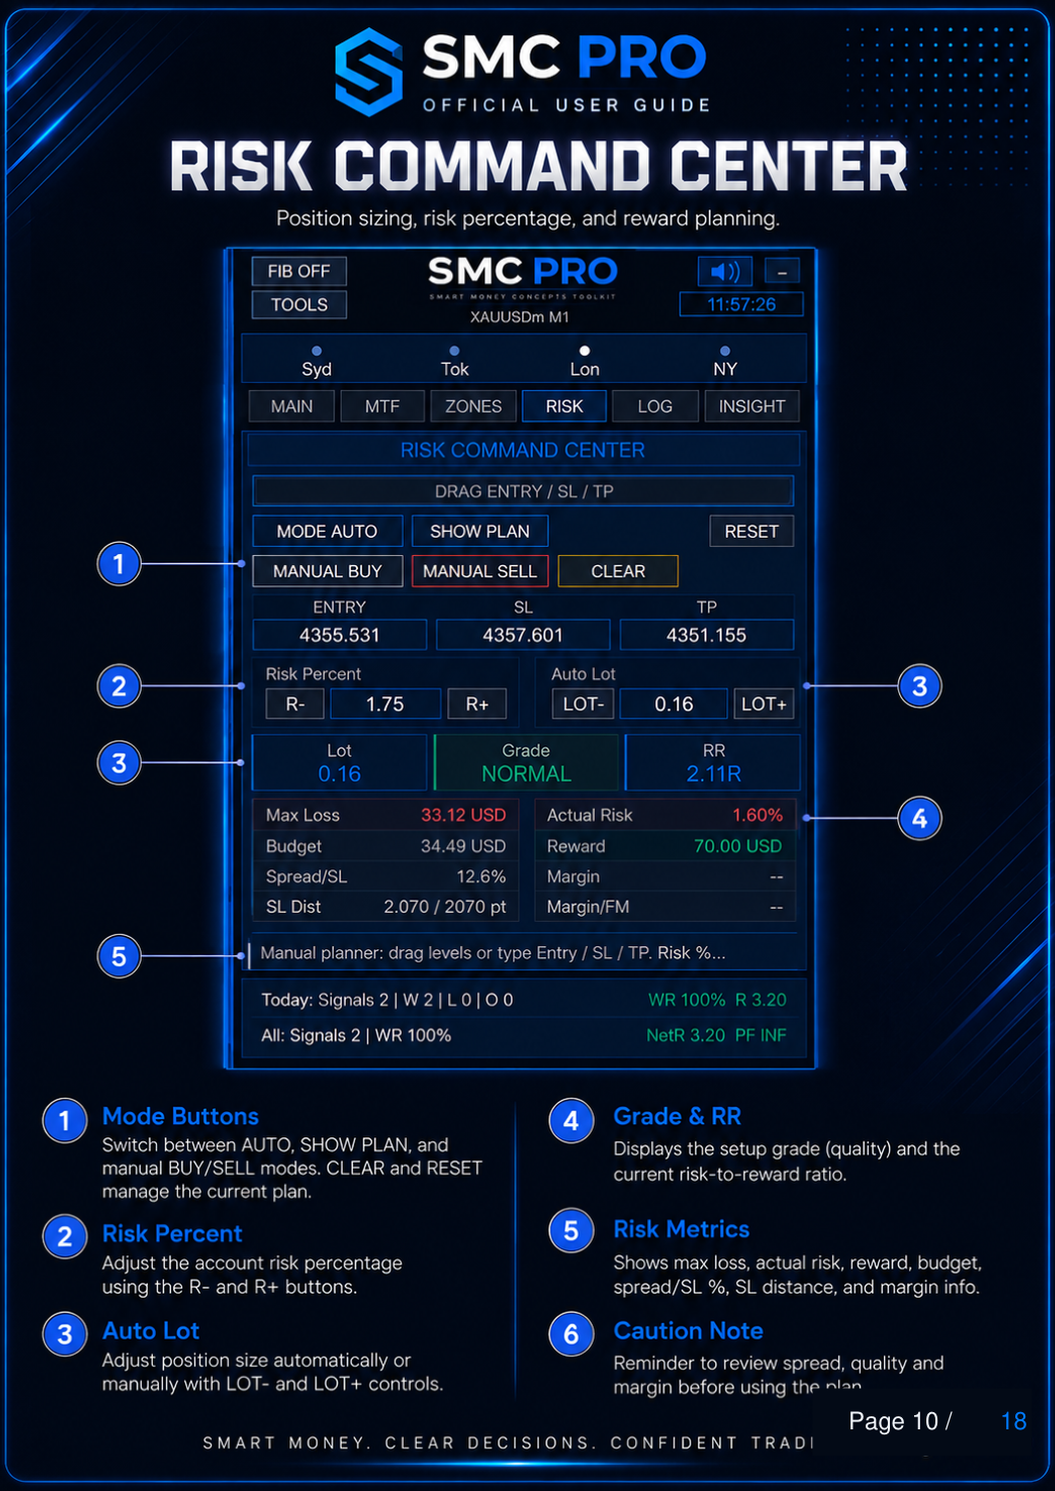
|
11. Session Range
Session Range maps the major market sessions directly on the chart. It helps traders visualize session boxes, session highs and lows, and important session behavior across Sydney, Tokyo, London, and New York. Main functions of Session Range: - Opens from the TOOLS menu
- Includes a dedicated Session Range control panel
- Provides session display and history options
- Allows individual market sessions to be enabled or disabled
- Includes box and sweep display controls
- Draws session ranges directly on the chart
How to read it:
Use the session controls to select which sessions are displayed. The chart can show Sydney, Tokyo, London, and New York session ranges together with their corresponding highs and lows. Usage note:
Session Range is a visual analysis tool and does not affect SMC signal scoring. 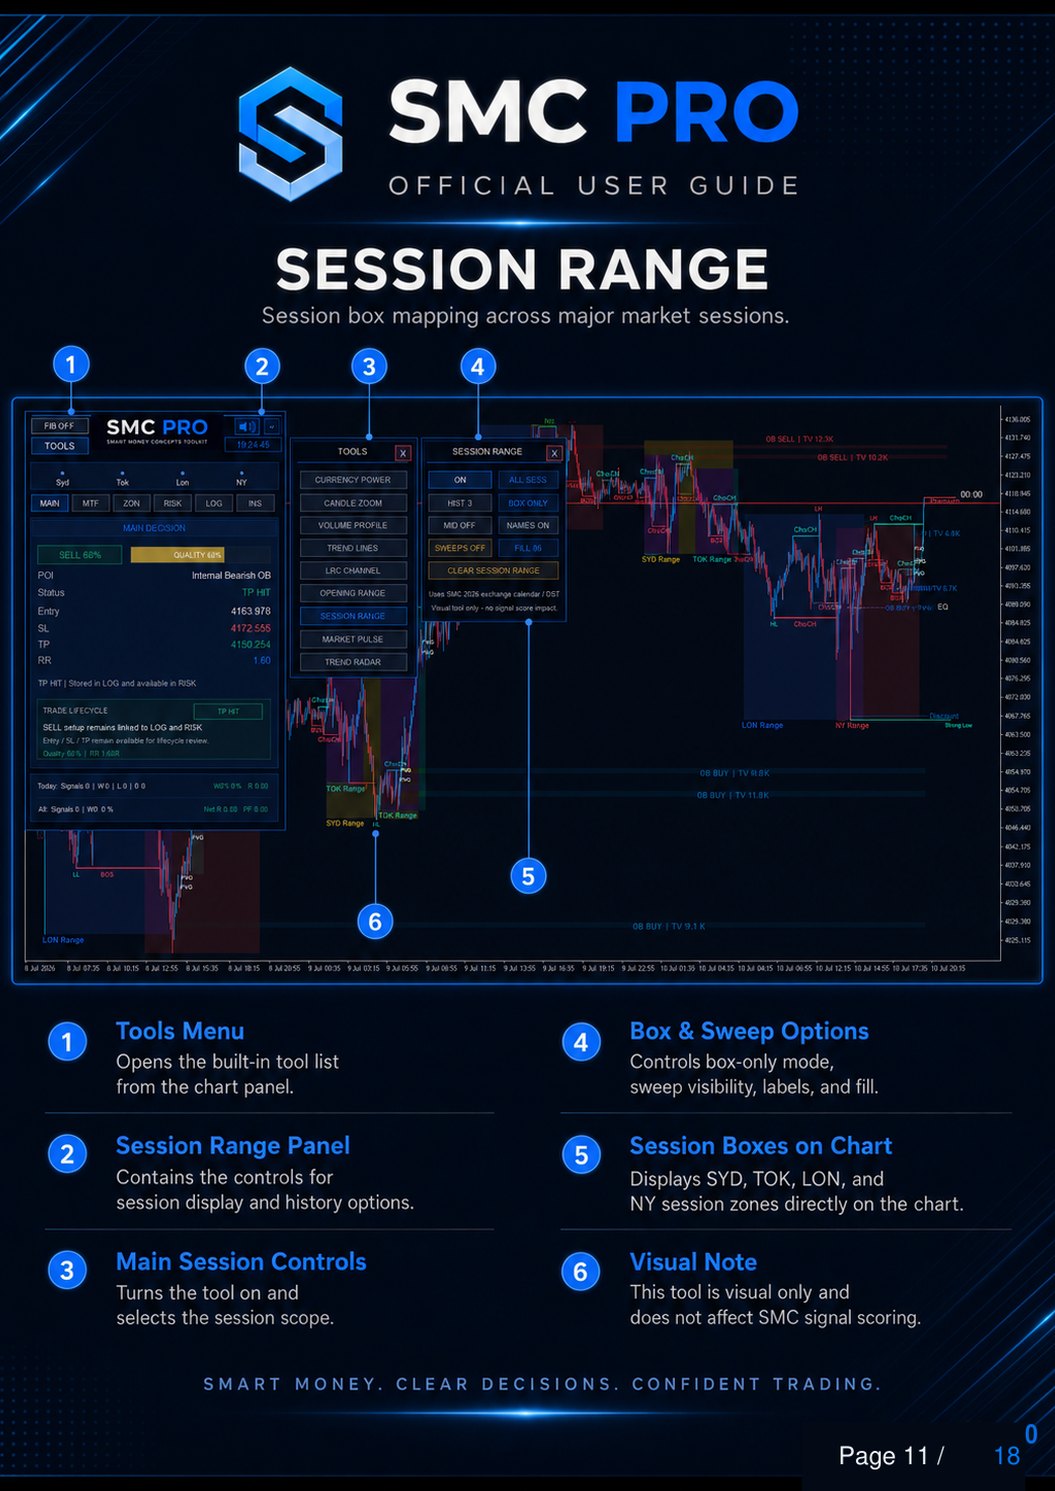
|
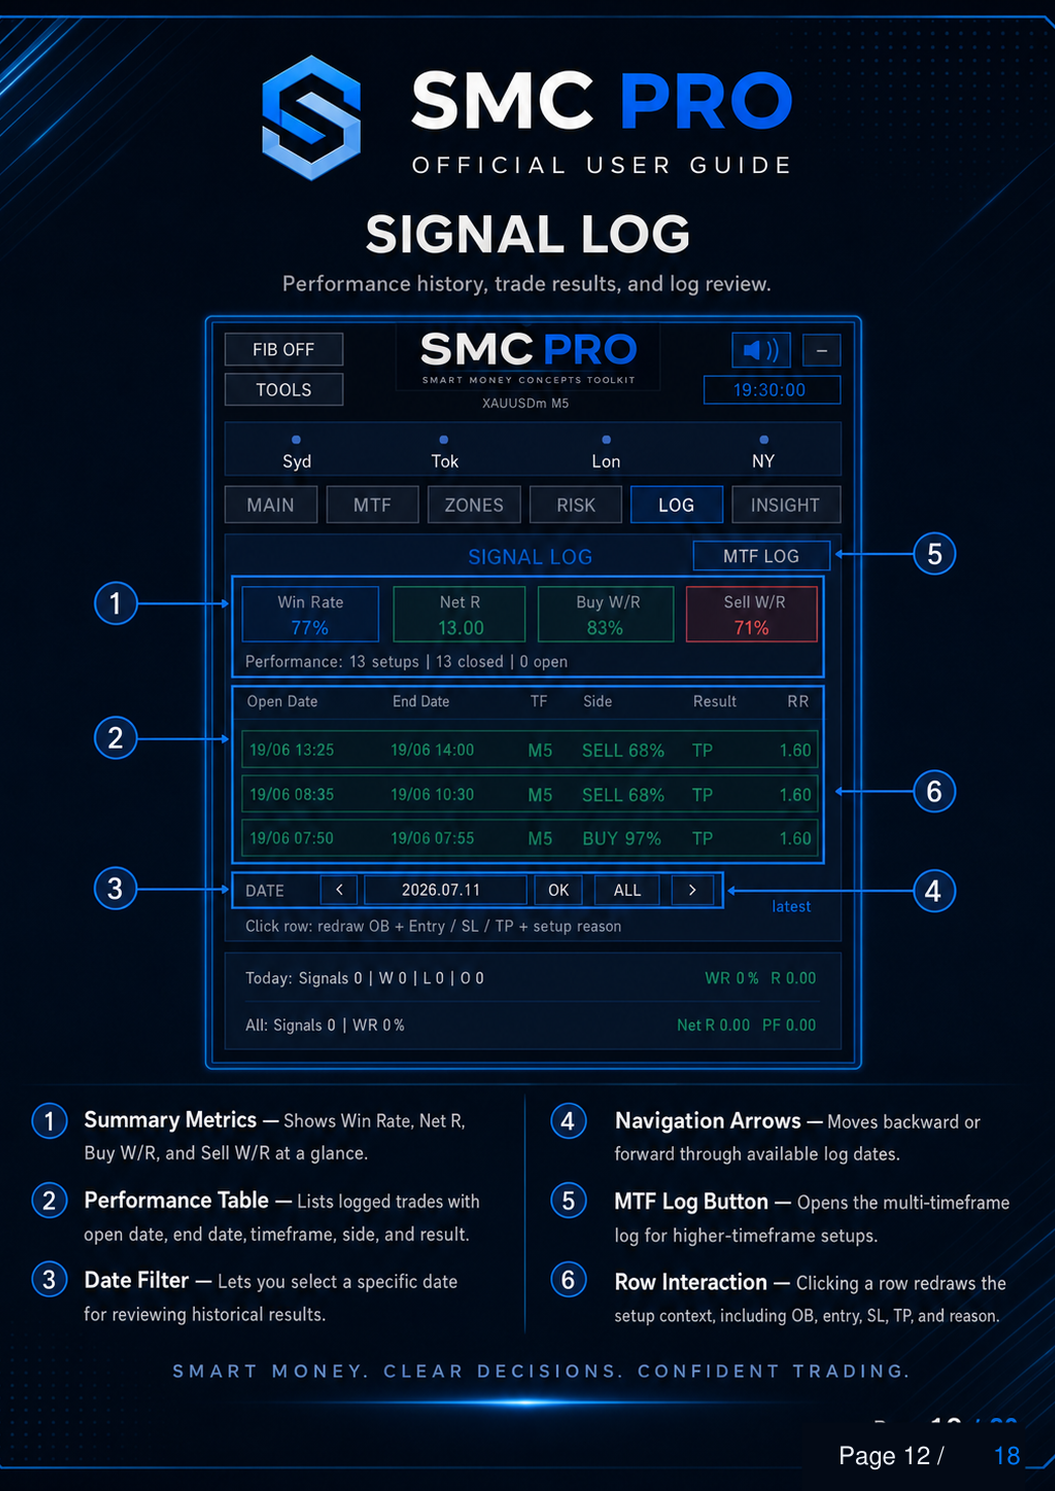
12. Signal Log
Signal Log provides a structured history of setups and their recorded outcomes.
It allows previous trade setups to be reviewed by date, timeframe, side, result, and Risk-to-Reward information.
Main functions of Signal Log:
- Displays summary performance metrics
- Shows Win Rate and Net R information
- Separates BUY and SELL performance
- Lists recorded setups in a performance table
- Displays open date, end date, timeframe, side, result, and RR
- Provides date filtering for historical review
- Includes navigation controls for moving through log dates
- Provides access to higher-timeframe setup history
- Allows previous setup context to be redrawn on the chart
How to use it:
Use the filters to select a specific date or period, then review the individual setup rows.
Selecting a recorded setup can restore its chart context for review, including information such as the original zone, Entry, SL, TP, and setup reason where available.
13. Smart Zones
Smart Zones is the advanced zone-management and filtering workspace. It organizes active zones, ranks candidate areas, and provides detailed information about each tracked zone. Main functions of Smart Zones: - Filters zones by working timeframe
- Filters by zone type
- Displays the highest-ranked candidate zone in the Top Zone Card
- Shows detailed zone metrics
- Provides ALL, PRIME, TRADE, NEAR, and BROKEN views
- Displays tracked zones in a structured table
- Allows a selected zone to be viewed directly on the chart
Zone information may include: - Zone ID
- Side
- Type
- Area
- Distance
- Test count
- Target room
- Gate status
- Current state
How to use it:
Use the Filters to narrow the list, then review the Top Zone Card for the strongest current candidate. The different View Tabs help organize zones by condition and status, while Chart Selection allows a specific zone to be inspected visually. 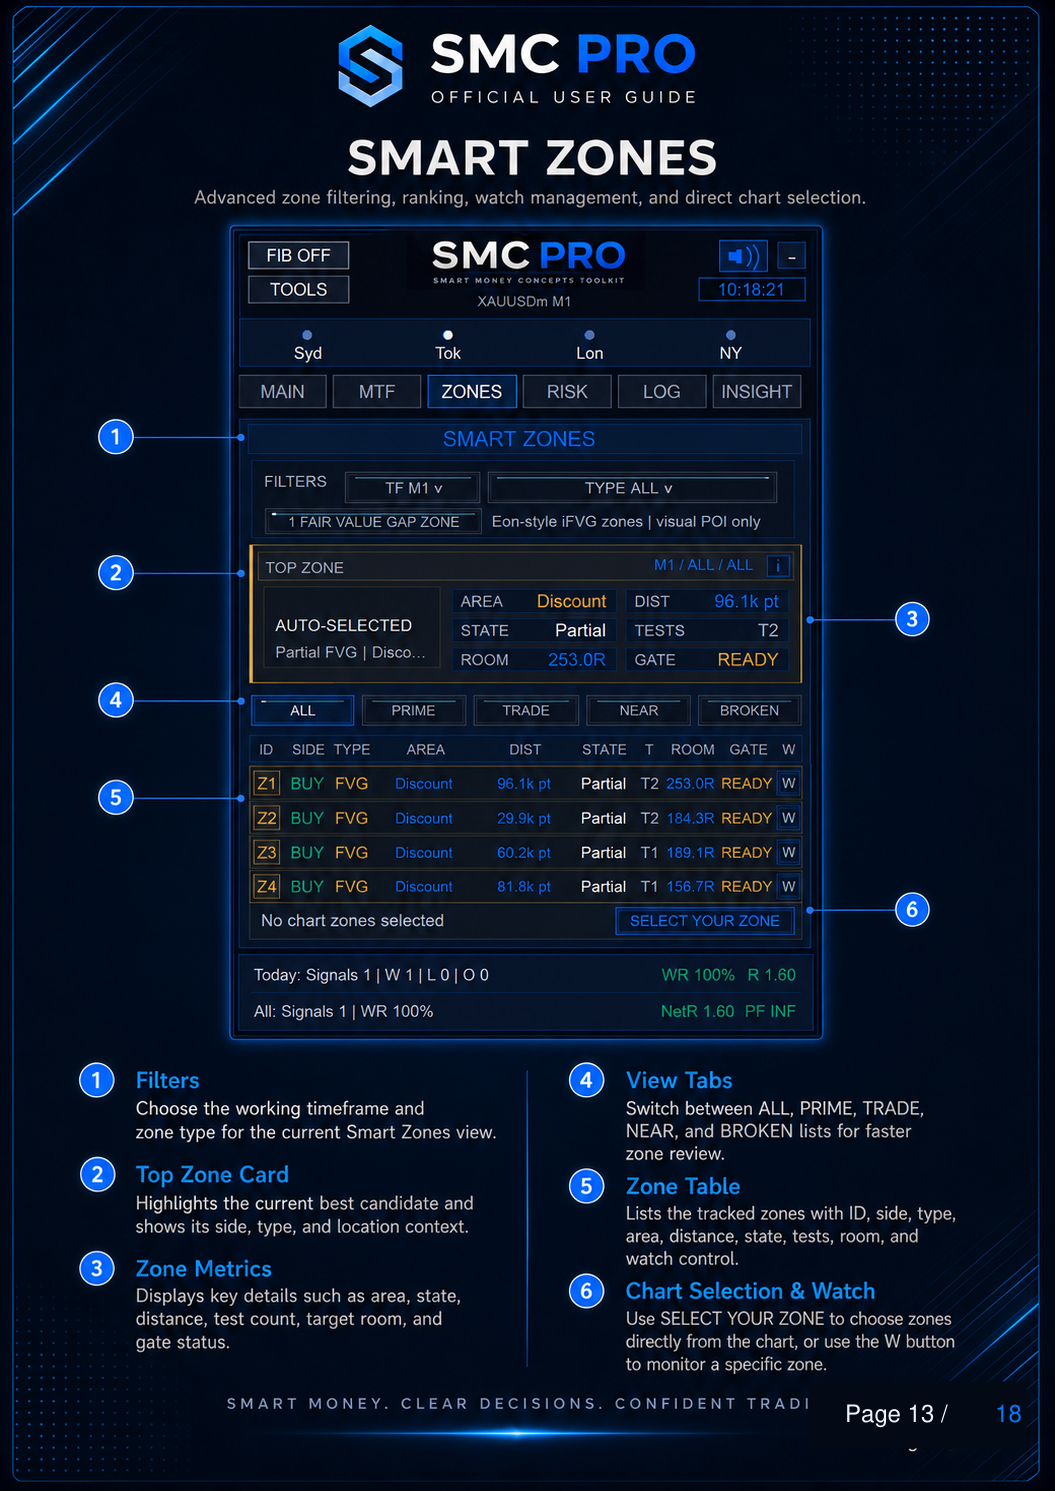
|
14. Trend Lines
Trend Lines provides automatic support and resistance mapping with multi-timeframe ranking and visual trend guidance. The tool scans several timeframes and organizes important trend-line structures directly on the chart. Main functions of Trend Lines: - Opens from the TOOLS menu
- Includes a dedicated Trend Lines control panel
- Can be enabled or disabled independently
- Includes a Smart Auto mode
- Scans multiple timeframes from M1 through D1
- Provides line-management controls
- Ranks the strongest support and resistance structures
- Displays trend-line status such as ACTIVE, TESTING, or WEAKENING
How to use it:
Smart Auto mode allows the system to rank important support and resistance structures automatically. The Line Controls can be used to manage visible lines and confirmation behavior, while Ranking & States helps identify which structures are currently most relevant. Usage note:
Trend Lines are visual analysis tools and do not change SMC signal generation. 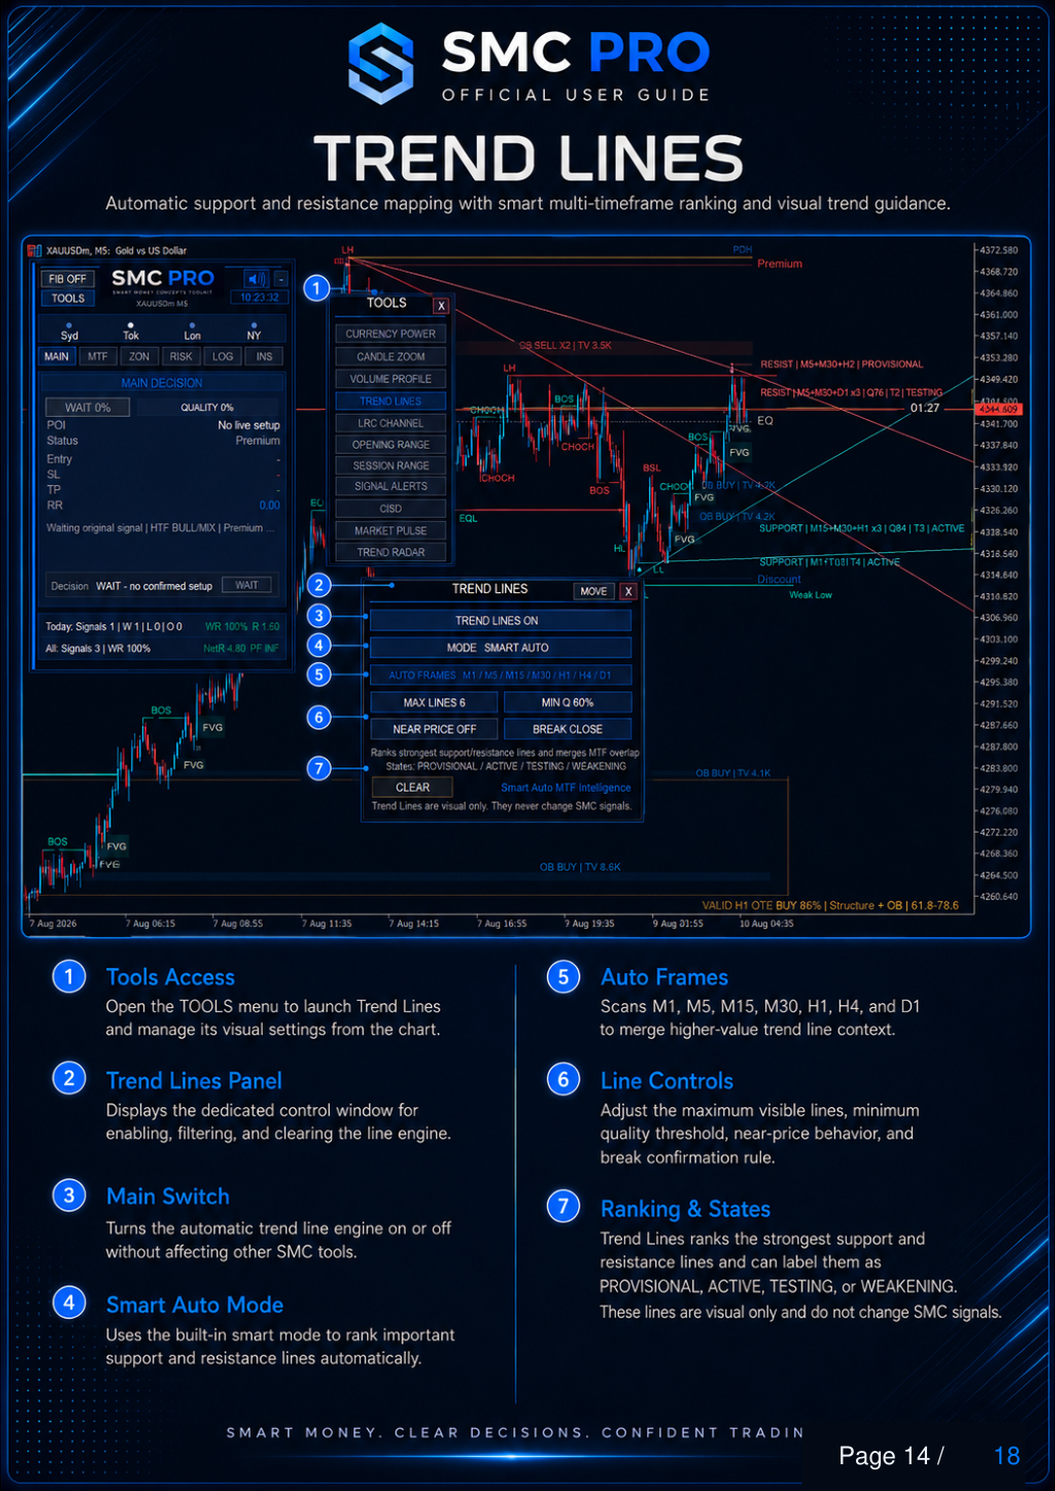
|
15. Trend Radar
Trend Radar provides a fast multi-timeframe market scan across multiple symbols. It is designed to compare trend alignment, pullback conditions, reversal-watch behavior, and overall directional context from one radar matrix. Main functions of Trend Radar: - Opens from the TOOLS menu
- Displays multiple symbols in a single radar matrix
- Compares directional context across several timeframes
- Uses directional labels to show bullish or bearish bias
- Highlights stronger multi-timeframe alignment
- Displays pullback and reversal-watch context
- Allows symbols to be added and reset
- Supports fast visual scanning of selected markets
How to read it:
Each row represents a market, while the timeframe columns allow directional context to be compared quickly. BULL and BEAR labels show directional bias, while stronger alignment across multiple timeframes provides additional context. Pullback conditions are marked separately from reversal-watch behavior so that temporary retracement and possible structural change can be distinguished more clearly. 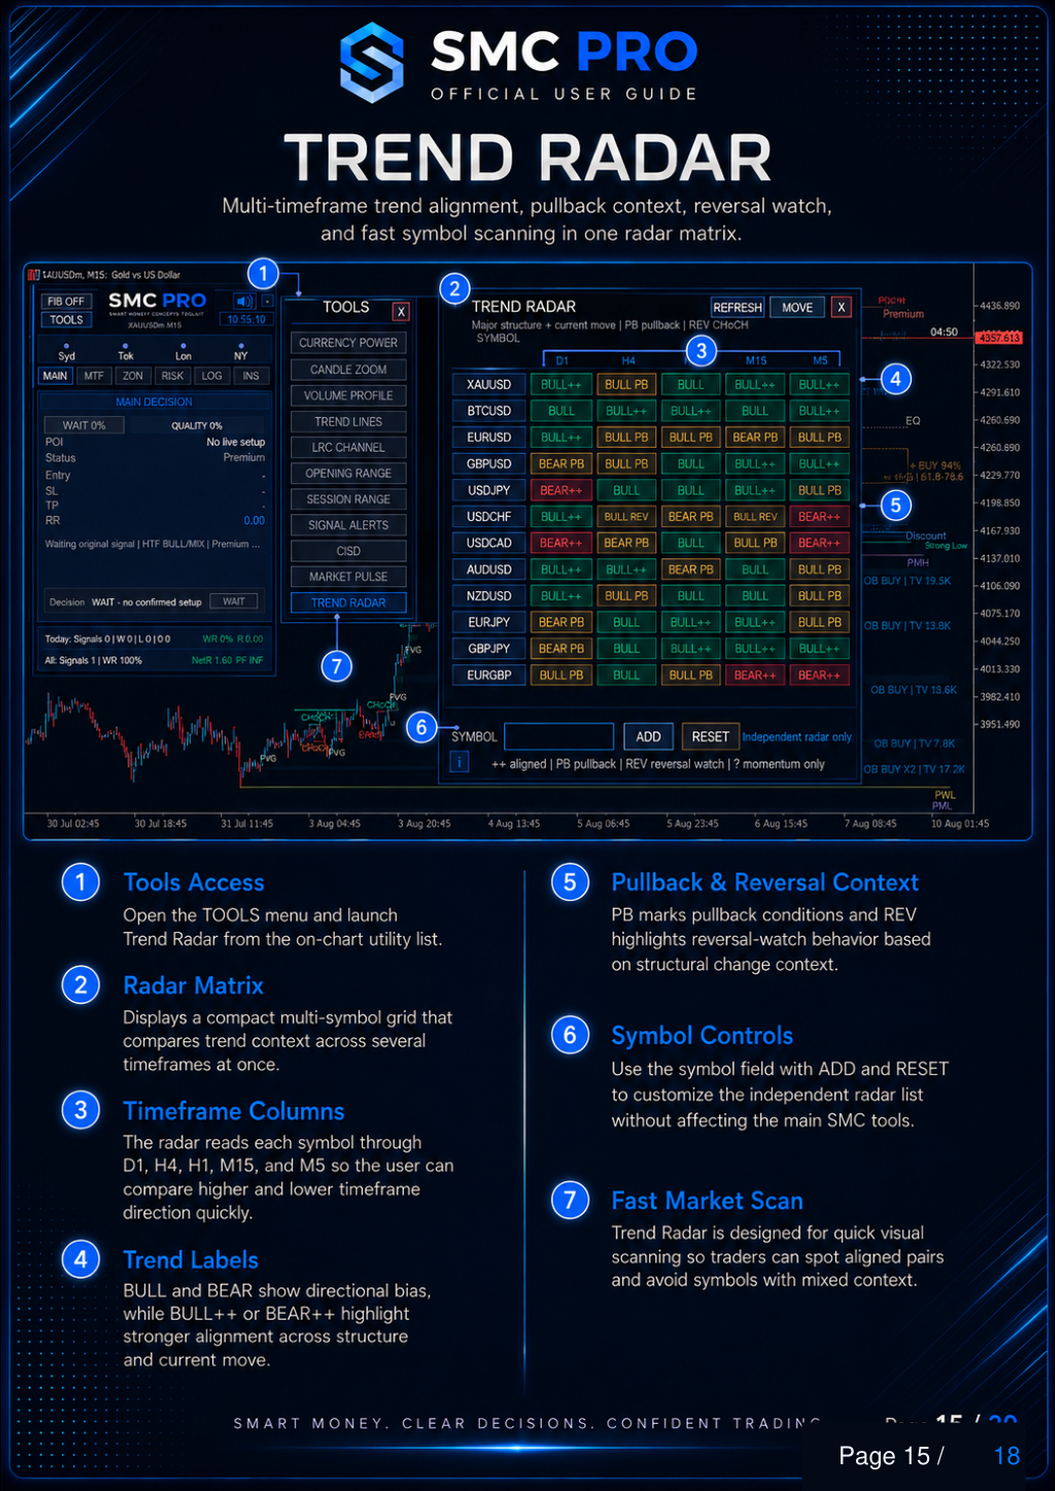
|
16. Smart Volume Structure
Smart Volume Structure is an advanced volume-profile workspace designed to combine volume distribution with SMC chart context. It provides visible-range profiling, node analysis, dynamic profile states, and confluence information. Main functions of Smart Volume Structure: - Opens from the TOOLS menu
- Includes multiple volume-profile modes
- Provides Bars and Rows controls
- Displays Point of Control and Value Area information
- Identifies High-Volume Nodes and Low-Volume Nodes
- Tracks Dynamic Point of Control behavior
- Compares volume-profile information with SMC structure
- Displays the current live profile state
- Shows profile confluence directly on the chart
How to read it:
POC identifies the highest-activity price area, while the Value Area highlights the accepted trading region around it. HVN and LVN areas help show where volume has been concentrated or relatively thin. Dynamic POC and SMC Sync provide additional context by comparing evolving volume information with the current market structure. The Live Profile State summarizes the current profile condition, while Chart Confluence helps show where volume and structural information overlap. 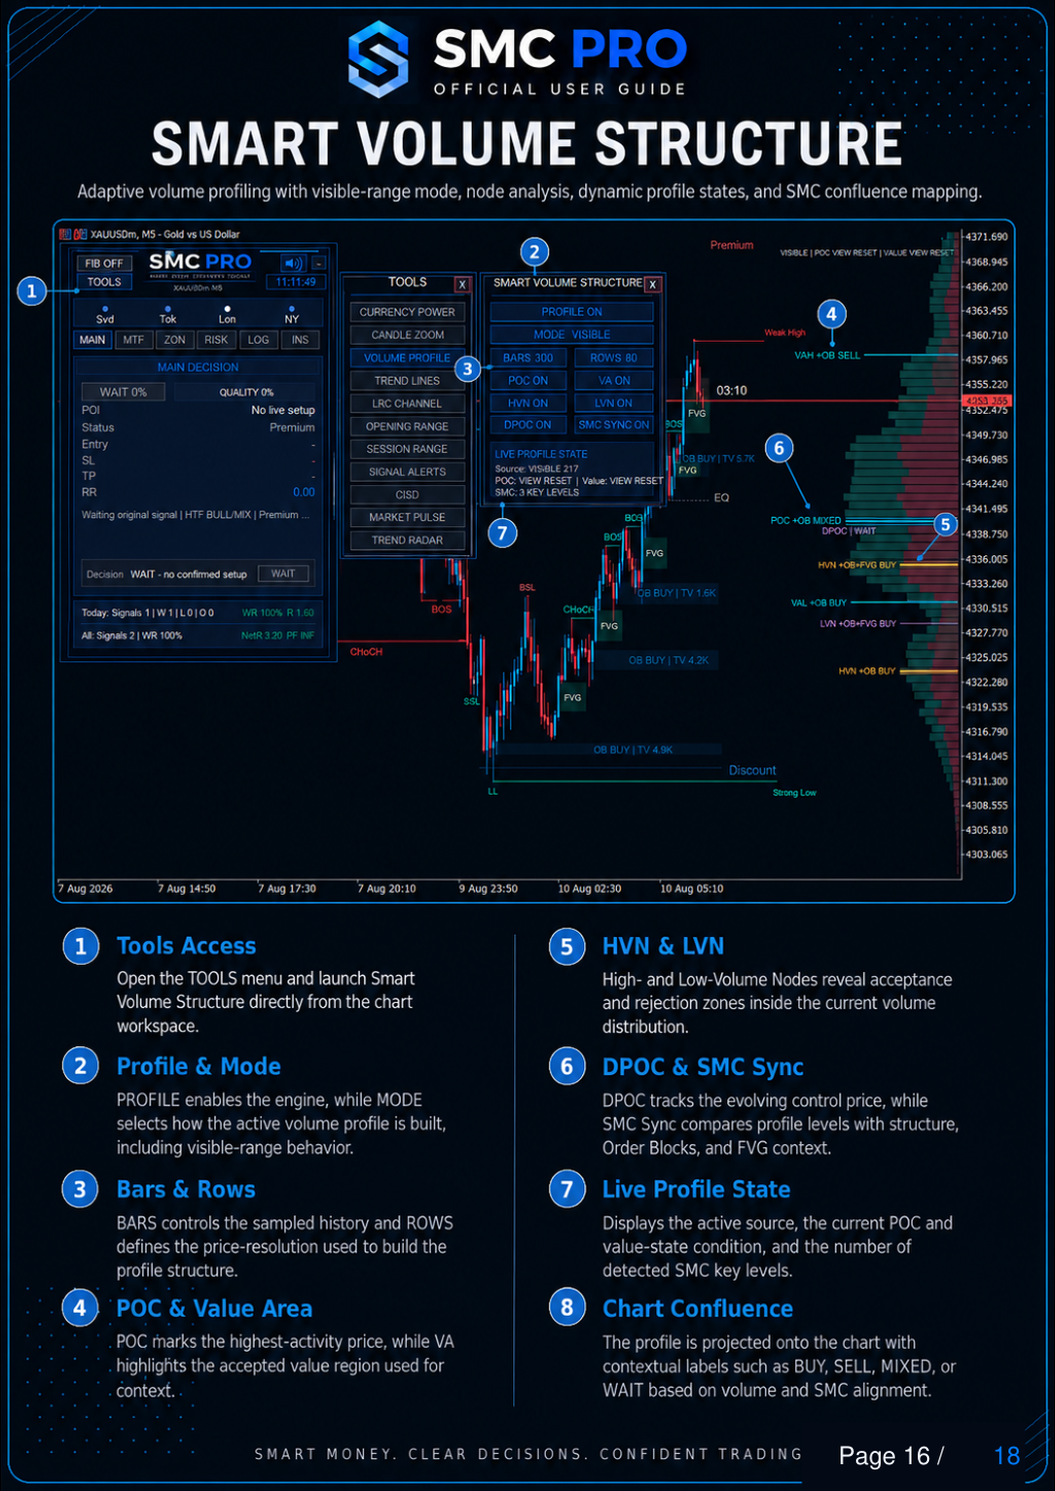
|
17. Signal Alerts
Signal Alerts provides centralized control over the alert engine. It allows individual alert types to be enabled or disabled depending on the trader's preferred workflow. Available alert controls include: - Master Alert toggle
- Breakout alerts
- Retest alerts
- False Break alerts
- Multi-Timeframe Break alerts
- Order Block Retest alerts
- Order Block Hold alerts
- Fair Value Gap Retest alerts
- Fair Value Gap Reject alerts
- Liquidity Sweep alerts
- Confluence alerts
- Keep Breakout Zones option
How to use it:
Use MASTER ON to enable the main alert engine, then activate only the alert types relevant to your workflow. The Keep Breakout Zones option keeps historical breakout areas visible on the chart for later review and context. 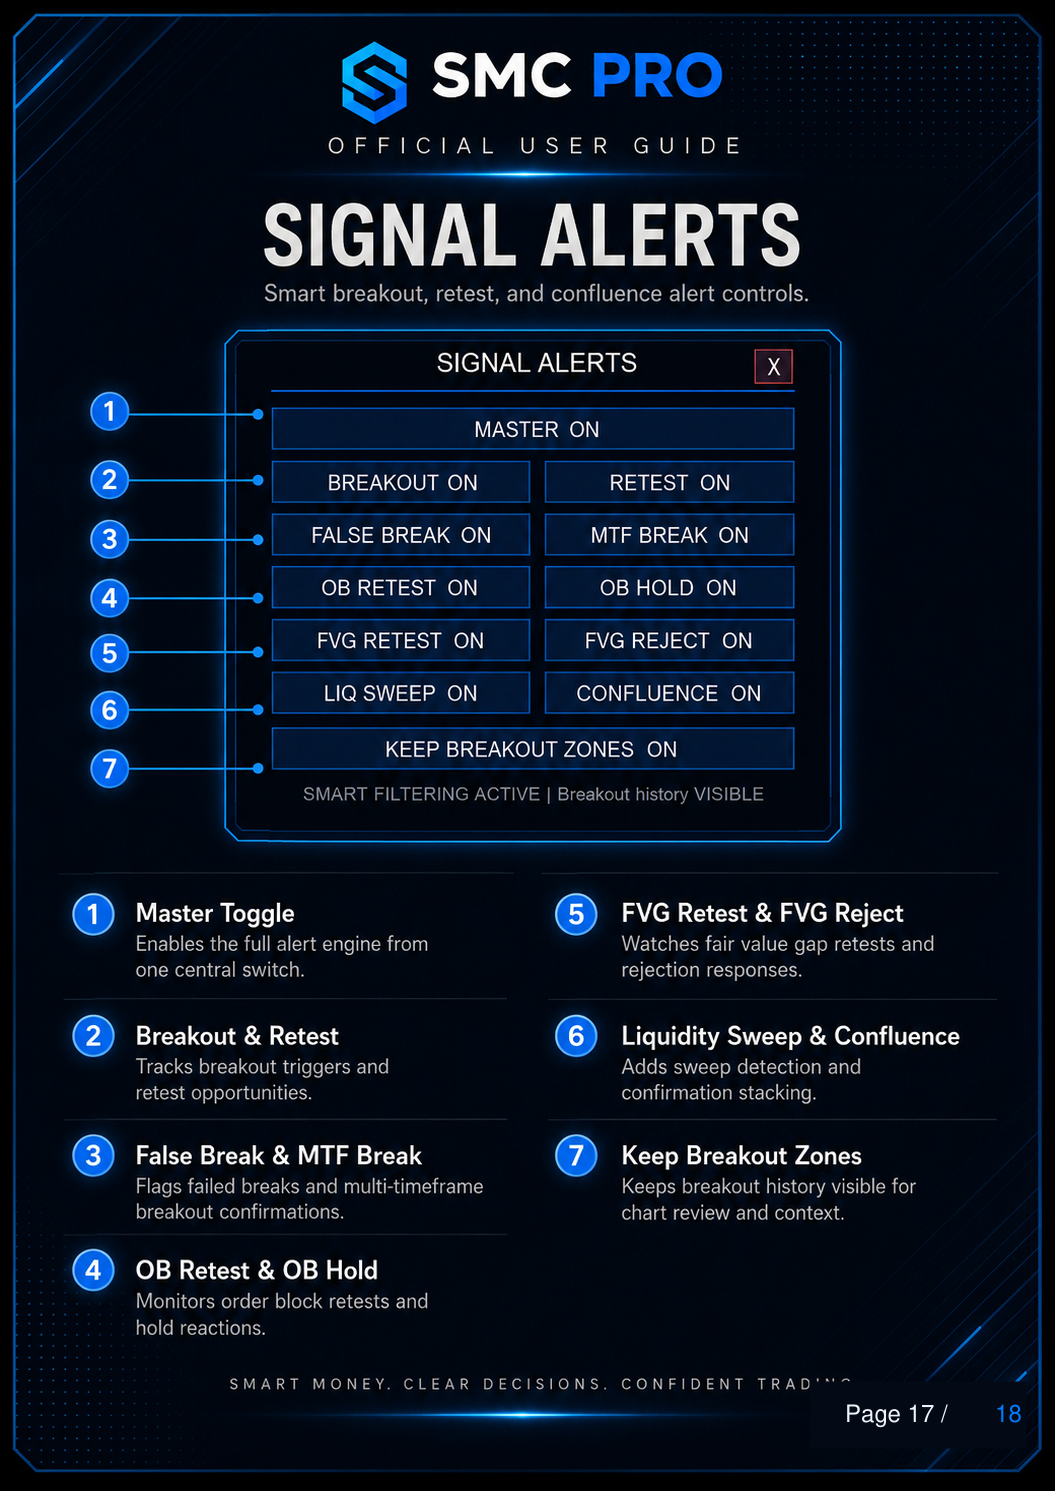
|
18. CISD
CISD provides structured delivery-state confirmation with pending-level control, confirmation arrows, chart labels, and focused signal filtering. It is designed as a confirmation and context tool within the wider SMC Pro ToolKit workflow. Main functions of CISD: - Opens from the TOOLS menu
- Includes an independent CISD ON/OFF switch
- Displays pending CISD reference levels
- Shows confirmation arrows when a CISD setup is confirmed
- Displays CISD text labels and related price information
- Includes a LAST BUY / SELL ONLY display option
- Provides dedicated CISD alerts
- Shows confirmed CISD events directly on the chart
How to read it:
Pending Levels display the reference areas being monitored before confirmation. Confirmation Arrows appear when the required CISD confirmation is completed. Labels and Price information help identify the related CISD event on the chart, while LAST BUY / SELL ONLY can be used to keep the display focused on the most recent confirmed event instead of showing a crowded signal history. Usage note:
CISD should be used as a confirmation and market-context component together with the wider structure and setup logic of SMC Pro ToolKit. 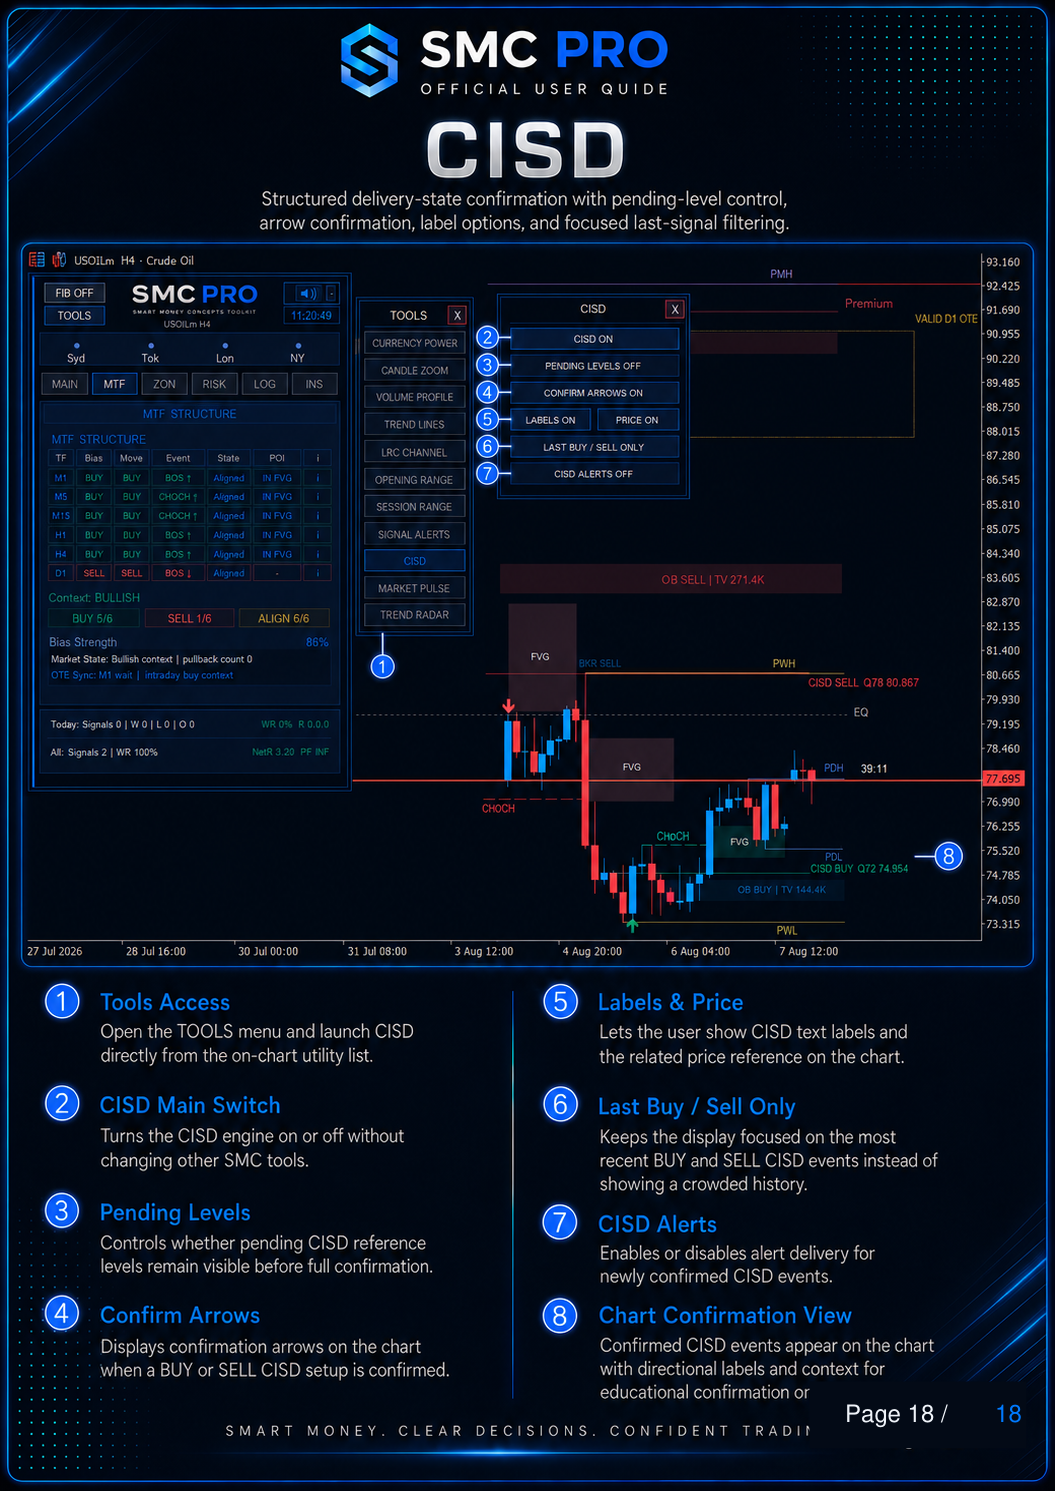
|
Documentation Information
Product: SMC Pro ToolKit
Platform: MetaTrader 5
Guide Version: 2.00
Last Updated: August 2026
This guide will be updated as new tools, improvements, and workflow features are introduced.