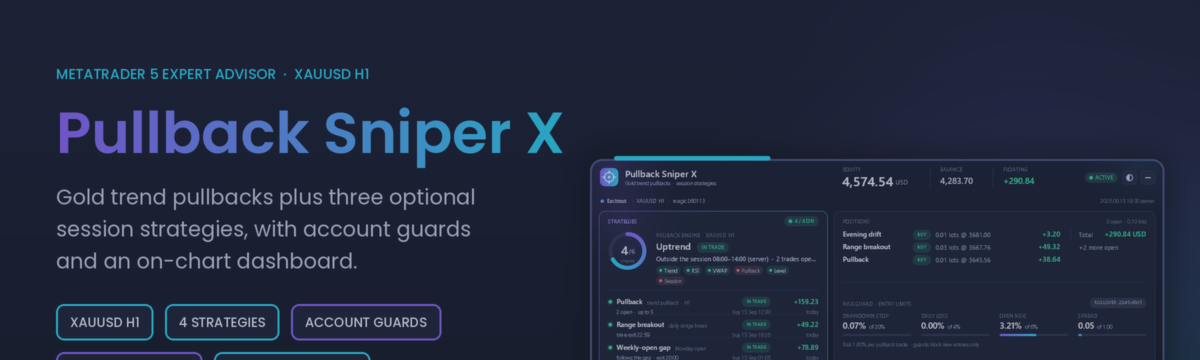

The sections below are the earlier presets and the tests that produced them. They stay in this post as an archive. The recommended set (the default inputs, apart from the drawdown stop) is in the main post, Pullback Sniper X on Gold (2021-2026): One Recommended Set, How I Tested It, and Why the Optimiser Lost. The product page is Pullback Sniper X.
Other / earlier sets
These results use a different test setup from the recommended set. The four sets were tested on Dukascopy real ticks with a 10,000 USD start, from 1 January 2021 to 23 October 2026. Balanced Plus, Balanced Max and the three add mode sets were tested with a 3,000 USD start, on Dukascopy and on Capital Point. They trade the pullback core only (add mode adds extra entries outside the main session). They do not use the range breakout, weekly-open gap, evening drift or the account guards described in the main post. The original tables are kept. Wording that named a product version or a "build" was removed.
A note on the set files. Each earlier set is attached as a converted copy ("Pullback Sniper X - Earlier - ..."). The converted copy lists every input of the current Expert Advisor, with the range breakout, gap, drift, account guards and drawdown stop switched off, so it trades exactly as in the tests below. I checked this: on Capital Point data (January to June 2025) each converted copy gave the same deals, deal by deal, as the previous Market file with the original set file. The add mode inputs keep their names (InpOffSessionAdds, InpOffSessionRiskMult, InpOffSessionMaxTrades). The original files list only the pullback inputs, so loading one of them into the current Expert Advisor would leave the other strategies and guards at their current values (on, with the defaults). Use the converted copies.
Add mode, about 12 trades a month
The four sets and the Balanced Plus / Max profiles trade about 5 times a month; add mode roughly doubles that. New trades still start only in the 8 to 14 session. Outside it, a signal is taken only as a half-size add to an open trade in the same direction, while fewer than 5 trades are open. It is off by default, so the other sets trade as before.
Three sets use it: Balanced Plus with add mode on, InpMaxTrades 8 and a risk / open-risk cap of 1.6% / 6% (Safe), 2.9% / 7% (Standard) and 3.25% / 8% (Aggressive). Tests as for Balanced Plus: 3,000 USD, compounding, Dukascopy (Duka) real ticks, Capital Point (CP) 1 minute OHLC; tuning 2021 to June 2024, unseen from July 2024. DD = equity drawdown.
| Safe | Trades/mo | PF | Max DD | Rel DD |
|---|---|---|---|---|
| Duka tuning | 12.9 | 1.71 | 12.8% | 17.2% |
| Duka unseen | 11.1 | 2.02 | 16.1% | 16.1% |
| Duka full | 12.2 | 1.89 | 12.1% | 17.2% |
| CP full | 12.7 | 1.82 | 14.2% | 19.3% |
| CP unseen | 11.8 | 1.98 | 14.3% | 14.6% |
| Standard | Trades/mo | PF | Max DD | Rel DD |
|---|---|---|---|---|
| Duka tuning | 12.5 | 1.70 | 20.9% | 28.8% |
| Duka unseen | 10.9 | 1.93 | 18.4% | 20.0% |
| Duka full | 11.8 | 1.89 | 19.6% | 28.8% |
| CP full | 12.2 | 1.79 | 22.2% | 29.4% |
| CP unseen | 11.5 | 1.80 | 21.6% | 21.6% |
| Aggressive | Trades/mo | PF | Max DD | Rel DD |
|---|---|---|---|---|
| Duka tuning | 12.6 | 1.69 | 23.3% | 32.8% |
| Duka unseen | 11.0 | 1.85 | 21.5% | 22.1% |
| Duka full | 11.9 | 1.85 | 21.8% | 32.8% |
| CP full | 12.2 | 1.74 | 24.8% | 33.1% |
| CP unseen | 11.4 | 1.75 | 24.4% | 24.4% |
- The adds are linked. They join a move that is already running, so several can stop out together. Resampling each full-period trade list 20,000 times in whole weeks (to keep those clusters) gave a chance of a 40% or deeper drawdown of 0.2% (Safe), 18% (Standard) and 31% (Aggressive).
- A later week-block Monte Carlo (20,000 runs) of the same Standard and Aggressive trade lists gave a 60% and 76% chance of a 30% drawdown, against 4.5% for Safe. That test is in "Higher risk is a different product" above.
- Most of the profit is compounding. With risk on a fixed 3,000 USD, the same rules made about 1,439, 2,183 and 2,526 USD a year on Dukascopy (PF 1.90 to 1.94). Compounding turned that into 21,789, 159,426 and 252,959 USD, mostly in the 2024 to 2025 gold rally.
- Safe stayed below 20% on both DD measures in every test. Standard and Aggressive reached 29.4% and 33.1% relative DD: high risk.
Backtests only; test on a demo account first.
Balanced Plus and Balanced Max
Balanced has the highest profit factor of the four sets (1.97) with a low drawdown, so I tested what happens when it simply trades bigger. The result is two profiles. Both are the Balanced set with only two inputs changed, InpRiskPercent and InpPortRiskCapPct (plus the name shown on the dashboard). The entries, exits, filters and session hours are exactly the same as Balanced.
- Balanced Plus: 2.6% risk per trade, 4% cap on the total open risk.
- Balanced Max: 3.25% risk per trade, 5% cap on the total open risk.
Why the cap has to go up with the risk. Balanced skips any new trade that would push the total open risk above InpPortRiskCapPct, and lot sizing by volatility can make a single trade up to 1.75 times the base risk. With the 2% cap left in place, a higher risk mostly blocks trades: from January 2021 to June 2024, 2.6% risk with a 2% cap took 26 trades and 3.25% risk with a 2% cap took 2, against 269 for Balanced. So the cap was raised together with the risk.
How it was tested. Same Expert Advisor and same Dukascopy XAUUSD data as the rest of this archive (99% real ticks, H1, leverage 1:100), but with a 3,000 USD start instead of 10,000, so Balanced appears below with its 3,000 USD result. The risk and cap pairs were compared on 1 January 2021 to 30 June 2024 only. The period from 1 July 2024 to 23 October 2026 was then used only to check the shortlisted pairs, so the settings never saw it. As a second check I ran the same set files on a broker's own data: Capital Point Trading XAUUSD, 1 January 2021 to 8 November 2026. That broker's real tick history only starts in January 2025, so these runs use the "1 minute OHLC" model.
MT5 reports two equity drawdown figures, and both are shown: "Maximal" (the largest drop in money, as a % of the peak before it) and "Relative" (the largest drop in %). Full period, 3,000 USD start:
| Profile | Risk / cap | Data | Net profit | PF | Max equity DD | Relative DD | Trades |
|---|---|---|---|---|---|---|---|
| Balanced | 1.3% / 2% | Dukascopy, real ticks | +7,568 | 1.94 | 7.01% | 9.46% | 403 |
| Balanced Plus | 2.6% / 4% | Dukascopy, real ticks | +34,970 | 1.96 | 14.18% | 18.72% | 376 |
| Balanced Max | 3.25% / 5% | Dukascopy, real ticks | +62,990 | 1.92 | 17.70% | 22.94% | 370 |
| Balanced | 1.3% / 2% | Capital Point, 1 minute OHLC | +7,704 | 1.90 | 7.46% | 9.91% | 420 |
| Balanced Plus | 2.6% / 4% | Capital Point, 1 minute OHLC | +32,902 | 1.84 | 14.81% | 19.39% | 385 |
| Balanced Max | 3.25% / 5% | Capital Point, 1 minute OHLC | +60,394 | 1.82 | 18.49% | 23.94% | 381 |
The unseen period only (1 July 2024 to 23 October 2026 on Dukascopy, to 8 November 2026 on Capital Point), run as a separate test with a fresh 3,000 USD start:
| Profile | Data | Net profit | PF | Max equity DD | Relative DD | Trades |
|---|---|---|---|---|---|---|
| Balanced | Dukascopy, real ticks | +2,001 | 2.06 | 7.97% | 7.97% | 124 |
| Balanced Plus | Dukascopy, real ticks | +6,077 | 2.04 | 12.55% | 16.18% | 137 |
| Balanced Max | Dukascopy, real ticks | +8,872 | 1.97 | 16.70% | 19.67% | 134 |
| Balanced Plus | Capital Point, 1 minute OHLC | +6,396 | 1.95 | 13.68% | 13.68% | 147 |
| Balanced Max | Capital Point, 1 minute OHLC | +8,562 | 1.82 | 17.14% | 17.14% | 144 |
What the numbers say:
- Same trades, bigger size. The profit factor stays at 1.92 to 1.96 on Dukascopy against 1.94 for Balanced, and at 1.82 to 1.84 on Capital Point against 1.90. The edge does not change; only the size does.
- Drawdown grows with the risk. Doubling the risk from 1.3% to 2.6% took the maximal equity drawdown from 7.01% to 14.18%. Profit grows faster than that, because compounding works on bigger trades.
- Balanced Plus stayed below 20% on both drawdown measures in every test: the tuning period, the unseen period and the full period, on both data sources. Its highest figure was 19.39% relative on Capital Point.
- Balanced Max stayed below 20% maximal equity drawdown everywhere (highest 18.49%), but its relative drawdown went over 20%: 22.94% on Dukascopy and 23.94% on Capital Point. Treat it as the high-risk choice.
- The second broker gave the same picture. On Capital Point the profit was 6% lower for Balanced Plus and 4% lower for Balanced Max than on Dukascopy, with slightly higher drawdown.
Please read this before you use them. These are backtests, not live results and not a guarantee of anything. Bigger lots on a real account can get more slippage and wider spreads than the tester models, and that is not included here. Neither profile fits typical prop-firm drawdown limits. Test them with your broker's data and on a demo account first, and only use risk you can afford to lose.
Test setup for these sets
- Data: Dukascopy XAUUSD tick history, imported into MT5 as a custom symbol. The tester reported 99% real ticks.
- Period: 1 January 2021 to 23 October 2026, H1 chart.
- Account: 10,000 USD start, leverage 1:100.
- Position size: risk % per trade, calculated from the current equity. So the lot grows as the account grows and shrinks after losses (compounding).
- Models: the searches ran on "1 minute OHLC" because it is fast. Every finalist was then re-run on "Every tick based on real ticks". The real-tick results came out roughly 5 to 10% below the 1-minute ones, and all numbers in this archive are the real-tick ones unless a table says otherwise.
- In-sample / forward split: the optimiser only saw 2021 to 2024. The period from 1 January 2025 to 23 October 2026 was kept apart as a forward test on data it had never seen.
For reference, the default inputs did not do well on this data: about -1,232 USD, profit factor 0.97, 27.9% drawdown over 3,909 trades (1-minute OHLC). That is the honest starting point, and the reason the search was needed at all.
Round 1: finding a stable family
The first genetic optimisation covered 14 inputs and ran 5,418 passes. A second, narrower run around the best area added 3,683 passes. A clear pattern came out of it: VWAP filter on, trading only in a morning-to-midday window (roughly 7 to 9h until 14h server time), trailing stop off, stop loss around 2.75 to 3 ATR.
I took four candidates and did a neighbour sweep on each: every input moved two steps up and two steps down, one at a time. I only want settings that sit on a plateau, not on a spike. All neighbours stayed profitable in both periods, without sudden jumps. The survivors were then checked on real ticks.
Round 2: trying harder for more profit
Then I wanted to see if there was something clearly more profitable. Round 2 opened the ranges much wider: trailing on/off with a 1 to 3 ATR trail, reward:risk 1 to 3, stop 1.5 to 4 ATR, up to 6 trades, any session window or none, VWAP on/off, EMA filter 50 to 400 and trigger 10 to 100, slope lookback 5 to 40. Two genetic runs with two different goals (maximum balance, and maximum recovery factor) gave 5,002 and 9,235 passes. Together with round 1 that is roughly 23,000 combinations.
Two new families looked good at first. Both passed their neighbour sweeps and were profitable in the forward period. But when I compared them with round 1 at the same drawdown, neither one was better:
| At about the same drawdown | Net profit | Max equity DD | Trades | 2021 |
|---|---|---|---|---|
| Round 1 set C at 1.0% risk | +26,016 | 11.25% | 586 | +374 |
| Round 2 family F at 0.35% risk | +16,654 | 11.14% | 1,361 | -1,169 |
| Round 2 family E at 0.25% risk | +14,703 | 10.62% | 1,804 | -403 |
Their extra profit came only from more exposure (up to 6 trades, reward:risk near 2.9), and both lost money in 2021. Trailing was never selected in any of the good results. So I kept the round 1 strategies, and got more profit the simple way: by raising the risk on set C, which had the best profit per unit of drawdown and was positive in every year.
Round 3: can each level trade more?
About 586 trades in almost six years is not a lot, so I went back once more with a different question. For each risk level, is there a strategy of its own that trades more often and makes more money at the same drawdown? Raising the risk on one strategy is easy, but I wanted to see if each level could have its own settings. Round 3 ran six more genetic searches aimed at 1,000 trades or more: up to 8 open trades, any session window or none, and the trailing stop on or off. The best candidates went through the same neighbour sweeps, and the finalists were run on real ticks at the risk that gave the same drawdown as the current set.
| Level | Set | Net profit | PF | Max equity DD | Trades |
|---|---|---|---|---|---|
| Conservative | A at 0.5% (kept) | +4,554 | 1.53 | 4.87% | 396 |
| Balanced | C at 1.0% (kept) | +26,016 | 1.45 | 11.25% | 586 |
| Balanced | K02 at 0.5% | +22,448 | 1.29 | 14.20% | 1,824 |
| Aggressive | C at 1.5% (kept) | +55,204 | 1.44 | 16.99% | 586 |
| Aggressive | K02 at 0.8% | +54,825 | 1.26 | 16.55% | 1,824 |
| Optional | C at 2.0% (previous) | +99,172 | 1.42 | 22.51% | 586 |
| Optional | K02 at 1.1% (kept) | +106,230 | 1.24 | 22.43% | 1,824 |
For Conservative nothing came close. The best higher-trade candidate (one trade at a time with a trailing stop) dropped to a profit factor of 1.05 on real ticks. On a 10,000 USD account the 0.01 minimum lot distorts low-risk sets that hold several trades, so I also ran Conservative and Balanced on 50,000 USD. The answer was the same: set A made +25,279 at 5.40% drawdown against +3,988 at 6.32% for the best new one, and set C at 1% made +140,619 at 11.72% against +124,019 at 16.43% for K02 at 0.5%.
For Aggressive, K02 at 0.8% came out almost equal to set C at 1.5%, with three times the trades but a clearly lower profit factor. In a tie I prefer the higher profit factor, so Aggressive stays on set C.
Only the Optional level changed. K02 at 1.1% made about 7% more than set C at 2% at the same drawdown, traded about three times as often and was profitable in every year. Its neighbour sweep was clean too: every neighbour stayed profitable in both periods. The price for that is a lower profit factor (1.24 against 1.42), so each trade earns less on average and spreads and commission take a bigger bite. So Optional is now its own strategy, and Balanced and Aggressive stay on set C.
Round 4: new rules for Conservative and Balanced
Optional rules were then added to the Expert Advisor: break-even, partial close, lot sizing by volatility, entries only at nearby price levels, a regime score and a cap on the total open risk. All of them are off by default, so set files that do not set those inputs trade as before (checked on real ticks: the Balanced set made 25,981 USD after those rules were added, against 26,016 before, and the other sets were within a few USD). Two more searches with about 266 variants used the new rules.
Conservative moves to a set with risk 1.0%, a trailing stop from 2R, break-even at 1R and a 50% partial close at 0.5R. Balanced moves to a set with risk 1.3%, lot sizing by volatility, entries only at swing and EMA-band levels and a 2% cap on the total open risk. Aggressive and Optional stay as they were: the new candidates for them cut the drawdown, but they also cut the profit, and I did not want to change them for that.
| Level | Set | Net profit | PF | Max equity DD | Trades | PF 2021-2024 / 2025-2026 |
|---|---|---|---|---|---|---|
| Conservative | previous A at 0.5% | +4,554 | 1.53 | 4.87% | 396 | 1.53 / 1.52 |
| Conservative | new at 1.0% | +6,055 | 1.60 | 4.64% | 619 | 1.61 / 1.56 |
| Balanced | previous C at 1.0% | +26,016 | 1.45 | 11.25% | 586 | 1.41 / 1.51 |
| Balanced | new at 1.3% | +27,878 | 1.97 | 7.05% | 378 | 1.99 / 1.94 |
Part of the Balanced gain comes from the higher risk per trade, and with 266 variants tested some of it is likely luck. Its profit also changes a lot with InpPortRiskCapPct: in the 1 minute OHLC model about 13,800 USD at 1.35% and about 36,800 USD at 2.65%, against about 31,400 USD at 2%. Conservative had a small loss in 2026 so far (-316 USD).
Fixed lots or compounding?
The Expert Advisor already compounds when you use risk %: the lot is sized from the current equity (on set C at 1%, the risk per trade stayed near 1% while the account grew from 10k to about 33k). For a fixed lot you set InpRiskPercent to 0 and the EA uses InpFixedLot.
I tested both on the same strategies:
| Set C | Net profit | PF | Max equity DD | Net / DD |
|---|---|---|---|---|
| Compounding 1.0% | +26,016 | 1.45 | 11.25% (4,215 USD) | 6.17 |
| Fixed 0.07 lot | +20,541 | 1.48 | 16.98% (4,700 USD) | 4.37 |
| Fixed 0.10 lot | +29,344 | 1.48 | 19.04% (6,714 USD) | 4.37 |
| Compounding 1.5% | +55,204 | 1.44 | 16.99% (11,699 USD) | 4.72 |
| Fixed 0.14 lot | +41,083 | 1.48 | 20.72% (9,400 USD) | 4.37 |
Compounding gave more profit per unit of drawdown for every strategy I tried (sets A and B, and the round 2 families too). The reason is simple: gold was around 1,800 in 2021 and around 4,000 now, so the same stop in ATR is worth far more dollars today. A fixed lot that looks reasonable now over-risks a small account in 2021 and 2022, and that is where most of its drawdown came from. With compounding the drawdown in dollars is larger near the end of the test, but only because the account is larger by then (on 1.5%, 11.7k USD of drawdown on an account of about 65k).
The four sets
The two higher-risk Balanced profiles, Balanced Plus and Balanced Max, are covered in their own section above; the table below is the original four sets on a 10,000 USD start.
All four use compounding risk %. Conservative and Balanced are the round 4 sets and use the optional rules added in that round (break-even, partial close, volatility sizing, price-level entries, open-risk cap). Those inputs have to be present in the Expert Advisor for the sets to apply them. Aggressive is round 1 set C at 1.5%. Optional is a different strategy from round 3 (K02) that trades about three times as often.
| Set | Risk | Net profit | PF | Max equity DD | Trades | 2021-2024 | 2025-2026 |
|---|---|---|---|---|---|---|---|
| Conservative (round 4) | 1.0% | +6,055 | 1.60 | 4.64% (782) | 619 | +4,261, PF 1.61 | +1,793, PF 1.56 |
| Balanced (round 4) | 1.3% | +27,878 | 1.97 | 7.05% (2,666) | 378 | +17,244, PF 1.99 | +10,635, PF 1.94 |
| Aggressive (C) | 1.5% | +55,204 | 1.44 | 16.99% (11,699) | 586 | +25,612, PF 1.39 | +29,592, PF 1.50 |
| Optional (K02) | 1.1% | +106,230 | 1.24 | 22.43% (31,792) | 1,824 | +43,455, PF 1.28 | +62,776, PF 1.22 |
Net profit per year in USD (10,000 USD start, 2026 until 23 October):
| Set | 2021 | 2022 | 2023 | 2024 | 2025 | 2026 |
|---|---|---|---|---|---|---|
| Conservative 1.0% | +1,441 | +1,161 | +758 | +901 | +2,110 | -316 |
| Balanced 1.3% | +964 | +3,252 | +4,976 | +8,051 | +8,648 | +1,987 |
| Aggressive 1.5% | +388 | +7,314 | +3,489 | +14,421 | +23,087 | +6,505 |
| Optional 1.1% (K02) | +828 | +5,932 | +18,147 | +18,547 | +46,660 | +16,116 |
The main inputs (everything else is at its default; "-" means the default value):
| Input | Conservative (round 4) | Balanced (round 4) | Aggressive (C) | Optional (K02) |
|---|---|---|---|---|
| InpRiskPercent | 1.0 | 1.3 | 1.5 | 1.1 |
| InpMaxTrades | 3 | 5 | 4 | 5 |
| InpEMAFilterPeriod | 150 | 200 | 200 | 170 |
| InpEMATriggerPeriod | 50 | 40 | 40 | 40 |
| InpSlopeLookbackBars | 10 | 15 | 15 | 10 |
| InpATR_SL_Mult | 2.75 | 3.00 | 3.00 | 2.75 |
| InpRR | 2.50 | 2.25 | 1.75 | 1.40 |
| InpUseVWAPFilter | true | true | true | true |
| InpUseSessionFilter | true | true | true | true |
| Session hours (InpSessionStartHour-InpSessionEndHour, server time) | 9-14 | 8-14 | 8-14 | 2-21 |
| InpUseTrailing | true | false | false | false |
| InpATR_Trail_Mult | 2.0 | - | - | - |
| InpTrailStartR | 2.0 | - | - | - |
| InpRearmATR | 1.5 | - | - | - |
| InpRearmMaxBars | 12 | - | - | - |
| InpAddMinProfitR | 0.5 | - | - | - |
| InpAddRiskMult | 0.25 | 0.5 | - | - |
| InpBE_TriggerR | 1.0 | 1.0 | - | - |
| InpBE_LockR | 0.0 | - | - | - |
| InpPartialAtR | 0.5 | - | - | - |
| InpADXMin | 15.0 | - | - | - |
| InpHTFMode | 1 | - | - | - |
| InpEqMAPeriod | 40 | - | - | - |
| InpVolSizeMode | - | 1 | - | - |
| InpVolPower | - | 0.5 | - | - |
| InpVolMultMax | - | 1.75 | - | - |
| InpStructMode | - | 1 | - | - |
| InpStructLevels | - | 6 | - | - |
| InpZoneATR | - | 0.25 | - | - |
| InpStructArmBars | - | 4 | - | - |
| InpRegRiskLo | - | 0.75 | - | - |
| InpPortRiskCapPct | - | 2.0 | - | - |
Balanced Plus and Balanced Max use the Balanced column, with InpRiskPercent 2.6 and 3.25 and InpPortRiskCapPct 4.0 and 5.0.
Deposits I would start with: 10,000 USD for all four sets. At today's gold price a 0.01 lot already risks about 35 to 70 USD per trade with these stops. On a smaller account InpAllowMinLotOverRisk (true in the sets) means the EA will still open 0.01 lot, so the real risk per trade will be higher than the % you set.
The dashboard on these sets
The Expert Advisor has an on-chart dashboard. It only displays information; adding it did not change the trading rules (checked: the Balanced set gives exactly the same real-tick result, 27,878 USD and 378 trades).
It shows:
- the set name
- the status (active, paused by the daily loss guard, or algo trading off)
- equity, balance and floating profit
- the closed profit for today, this week and this month
- the open trades with their open risk
- the maximum equity drawdown since start
- market regime
- RSI
- VWAP side
- session and spread
- the conditions for the next trade
- the last entry and a curve of the closed trades
A click on the header folds it, and InpShowDashboard switches it off. All nine of these set files have it switched on. (This describes the dashboard at the time these sets were published. The current dashboard is the one described in the main post; it shows the product name, not a set name.)
Notes on these results
- Drawdown on the bigger sets. Aggressive 1.5% had 17% max equity drawdown and Optional (K02 at 1.1%) had 22.4%. These do not fit typical prop-firm limits. Conservative (4.6%) and Balanced (7.1%) stayed below a 10% maximum-loss rule in this test.
- Balanced Plus and Balanced Max are the same trades as Balanced at a bigger size. On a 3,000 USD start they had 14.2% and 17.7% max equity drawdown on Dukascopy (18.7% and 22.9% relative), and Balanced Max went over 20% on the relative measure on both data sources. Slippage and spread at the bigger lots were not modelled beyond the tester.
- Most of the profit came in 2024 and 2025. 2021 was close to flat for set C and for K02, and 2026 so far is slightly negative for Conservative (-316 USD). Gold rose strongly over the whole period, and the trend helped.
- The Optional set is more sensitive to costs. K02 trades about three times as often as set C with a profit factor of 1.24, so commission and wider spreads take a bigger share of its edge. Test it with your broker's real costs before you use it.
- Session hours are server time of the Dukascopy feed. If your broker uses a different GMT offset, shift the hours. This matters, because the edge of sets A and C depends on that morning-to-midday window, and the Optional set uses a 2 to 21 window.
- No commission or extra slippage was modelled in these earlier tests. Only the spread in the Dukascopy bid/ask data. Your broker's spread, commission and fills will change the results.
- Optimisation always contains some luck. The forward period, the neighbour sweeps and the real-tick checks reduce that, but they cannot remove it.
- Past results do not guarantee future results. This is a backtest on historical data, not a promise of anything.
Files
Earlier set files, converted to the current input names:
- Pullback Sniper X - Earlier - Conservative.set
- Pullback Sniper X - Earlier - Balanced.set
- Pullback Sniper X - Earlier - Aggressive.set
- Pullback Sniper X - Earlier - Optional K02 1.1pct.set
- Pullback Sniper X - Earlier - Balanced Plus 2.6pct.set
- Pullback Sniper X - Earlier - Balanced Max 3.25pct.set
- Pullback Sniper X - Earlier - Add Mode Safe 1.6pct.set
- Pullback Sniper X - Earlier - Add Mode Standard 2.9pct.set
- Pullback Sniper X - Earlier - Add Mode Aggressive 3.25pct.set
Every one of these files lists every input, so it does not matter what was loaded before.




