Trade the Truth: USD Economic Strength Index
Trading currency pairs or gold without knowing what is happening behind the scenes is like driving with your eyes closed. Most indicators only look at past price bars, which creates lag. The USD Economic Strength Index changes that by processing real-time macroeconomic news events directly on your chart.
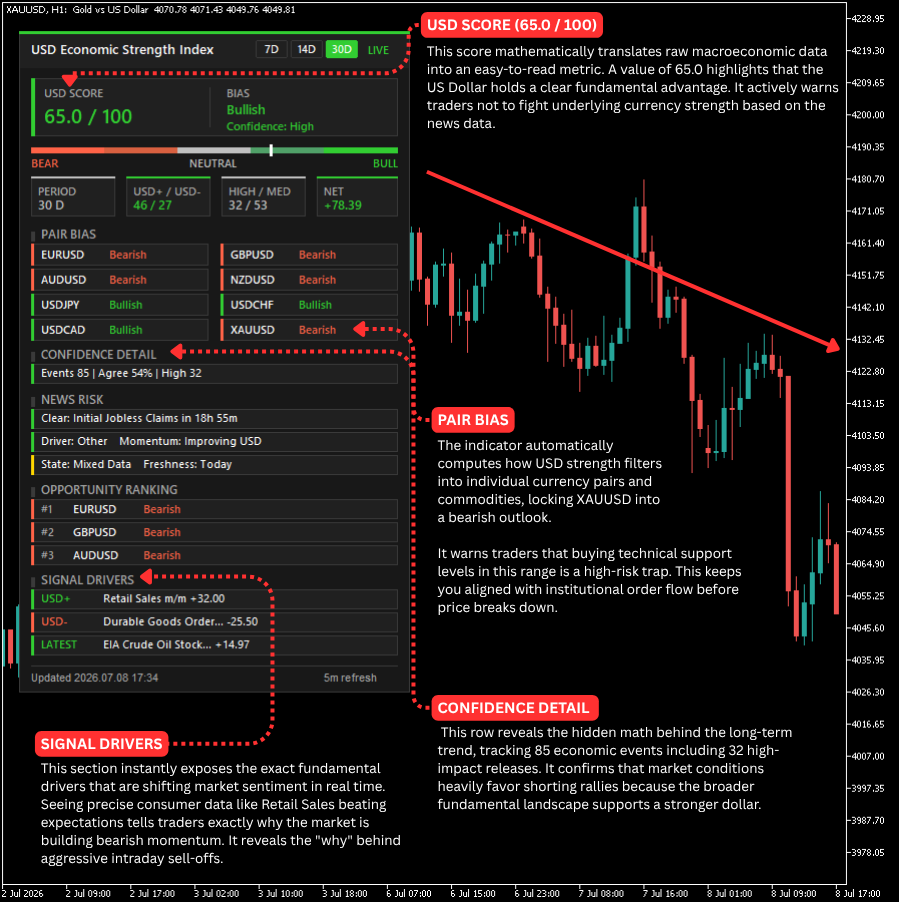
Look at the chart below to see how this fundamental data accurately predicted a massive drop in Gold (XAUUSD).
The Core Matrix: Reading the USD Engine
USD Score (65.0 / 100)
This score turns raw economic data into one simple number. A score of 65.0 shows that the US Dollar is fundamentally strong. When the score is this high, you know not to buy assets that go down when the dollar goes up.
Bias (Bullish | Confidence: High)
The bias tells you the overall trend direction based on economic reports. A high-confidence bullish bias means the data points strongly to a stronger dollar. This filters out false technical moves on the chart.
USD+ / USD- (46 / 27)
This metric tracks the win-loss record of economic reports over the lookback period. Out of 73 tracked events, 46 reports beat expectations while only 27 missed. This shows steady buying pressure for the USD.
High / Med (32 / 53)
This label breaks down the importance of the economic releases. It shows the indicator processed 32 high-impact events and 53 medium-impact events. It ensures that minor news doesn't distort your market view.
NET (+78.39)
The NET value is the total mathematical surprise of all news events combined. A positive score of +78.39 acts as institutional fuel. It explains why the price of Gold broke down so aggressively on the right side of the chart.
Why Every Trader Needs This Indicator
Instead of trying to read complicated financial calendars during live market hours, this algorithm does the heavy math for you. It updates automatically to keep you on the same side as institutional bank flows.