
Dealing with Dynamic Grids: How the Murrey Math HUD Dashboard Solves the "Redrawing" Problem

Dealing with Dynamic Grids: How the Murrey Math HUD Dashboard Solves the "Redrawing" Problem
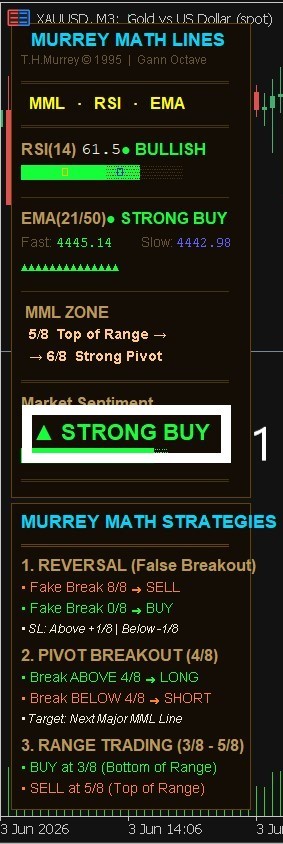
1. Dynamic Grid vs. Dashboard Score
Yes, when the market creates a massive new High or Low, the Murrey grid must re-calculate to adapt to the new market octave. However, you do not just blindly trade the lines. The HUD Dashboard uses a Multi-Indicator Confluence (including RSI, EMA, and Volatility filters). A true Overbought/Oversold signal is only confirmed when the mathematical lines, trend direction, and momentum all align perfectly.
2. Higher Timeframe (HTF) Anchor
To avoid getting trapped when lines change on small timeframes (like M5 or M15), always look at the Higher Timeframes (H4 or Daily) on the dashboard. HTF Murrey levels are incredibly strong and change very rarely. If H4 shows a major reversal at 0/8 or 8/8, that zone is highly reliable.
3. What else to consider (The Confluences):
- Market Structure: Look for price action confirmation (like a rejection candlestick pattern) when the price hits a key Murrey line.
- Dashboard Trend Sync: Only take Buy trades if the higher timeframe dashboard trend turns Green, and Sell trades if it turns Red. This ensures you are never fighting the macro trend.
- 👉
- 👉 Get Murrey Math Classic on MQL5 Market
- 👉
-
How the Indicator Works | Complete Strategy Overview
Murrey Math Classic: From Theory to Chart Precision
Why Murrey Math Classic Beats Traditional Indicators


")

")