

Pivot Lines Indicator for MetaTrader 5
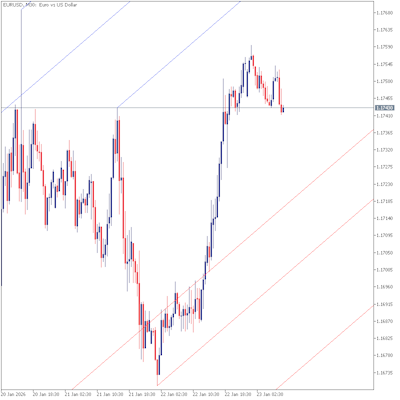
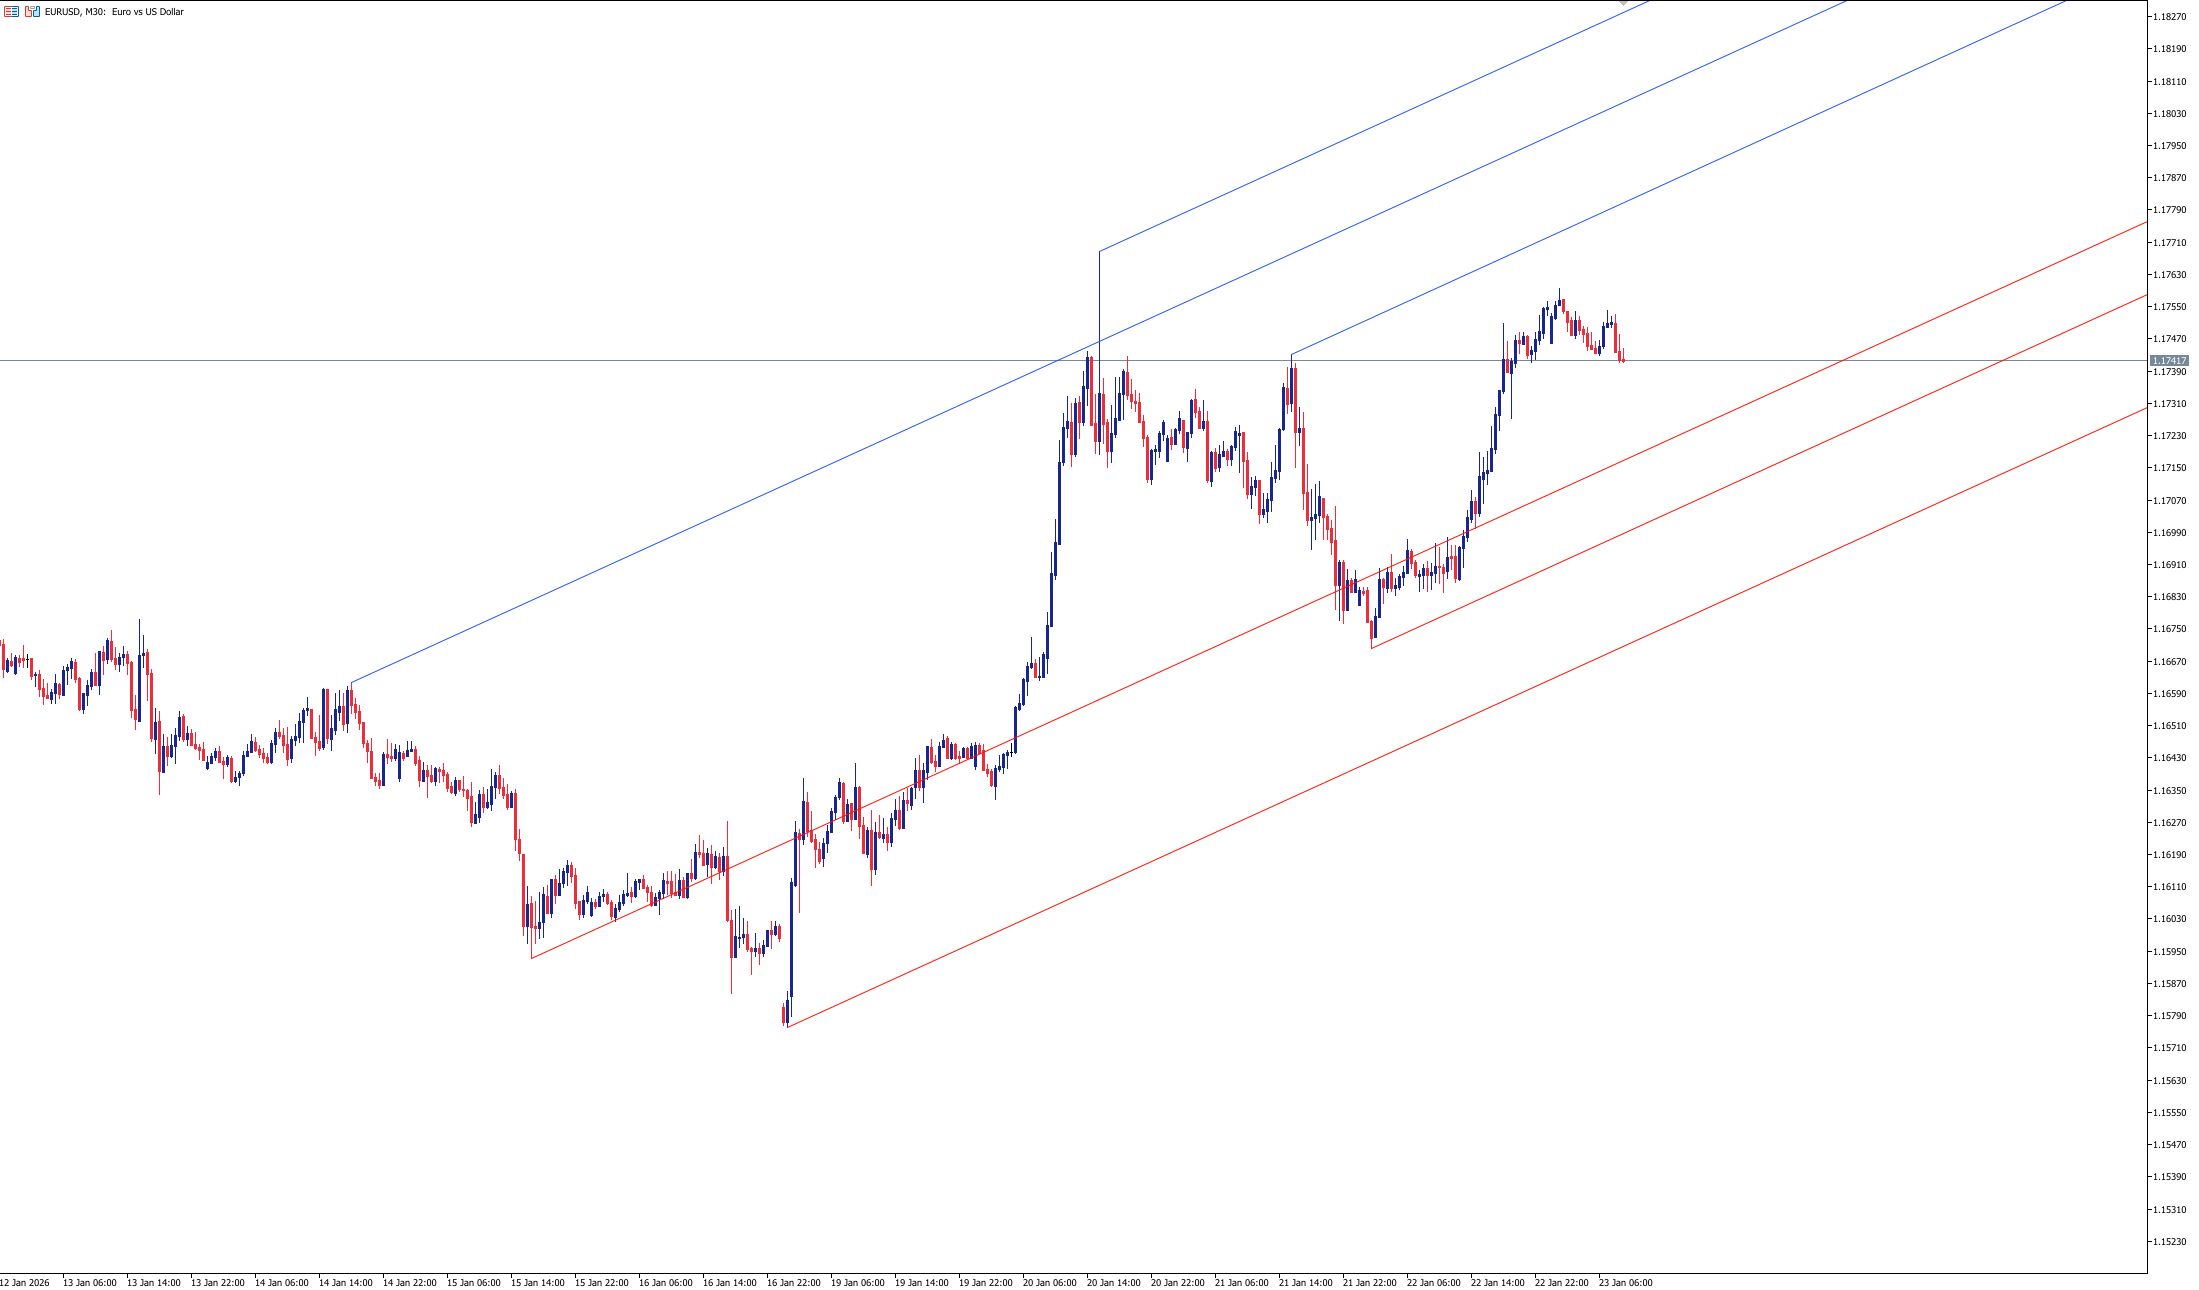
The Pivot Lines Indicator is a technical analysis tool for MetaTrader 5 designed to display parallel pivot-based price levels directly on the chart. It helps traders analyze price behavior within structured pivot channels instead of relying on isolated horizontal levels.
Indicator Logic
The Pivot Lines Indicator calculates pivot reference points and projects them as parallel lines across the chart. These lines form adaptive channels that reflect recent price action and changing market conditions. The logic allows traders to visually identify potential support and resistance zones created by pivot structures.


Key Features
- Automatic calculation of pivot-based price channels.
- Clear visualization of dynamic support and resistance zones.
- Helps analyze market structure in trending and ranging conditions.
- Works on all symbols and timeframes.
- Fully compatible with MetaTrader 5.
Recommended Use
The Pivot Lines Indicator is best used as a market structure and support-resistance analysis tool. Traders often combine it with price action or higher timeframe analysis to identify potential reaction zones, pullbacks, and breakout areas before entering trades.


")
