
Quantitative Trading Analysis Toolkit : Stop guessing, start measuring

Transform Your Trading From Guesswork to Data-Driven Decisions
Most traders rely on intuition, chart patterns, or market rumors. The result? Inconsistent performance and avoidable mistakes. Professional institutions, on the other hand, rely on quantitative analysis — measuring, testing, and managing risk with hard data.
The good news? You no longer need a team of quants or access to a trading desk to apply these methods. With the Quantitative Trading Analysis Template, any trader can unlock the power of professional-grade analytics directly inside Excel.
💡 “In trading, what gets measured gets managed. Start measuring what matters.”
This toolkit is original, copyrighted, and built for traders who want to understand market behavior, volatility, liquidity, and trading opportunities at a deeper level. It connects seamlessly with MetaTrader 5 (or any OHLCV data source) and turns raw market data into actionable insights — with just a few clicks.
Link to MT5 version : https://www.mql5.com/en/market/product/150569
Download Free Quant Level Indicator : https://www.mql5.com/en/market/product/151184
MQL5 Channel (share updates, analysis and requests) : https://www.mql5.com/en/channels/quantrading
Why Quantitative Analysis Matters
This toolkit is based on the same approach investment banks teach their first-year analysts: stop guessing, start measuring. It’s the essential first step in professional trading education — learning to read markets through data, not speculation.
What’s Inside the Toolkit
🔑 1. Multi-Source Data Integration
-
Works with any timeframe and market (FX, Indices, Commodities, Crypto).
- Direct OHLCV export from MetaTrader 5.
-
Compatible with external data sources (websites, other platforms).
-
Recommended for H1 and Daily data for best accuracy.
📈 2. Advanced Quantitative Analysis
-
Instant distribution analysis with histograms.
-
Automatic return calculations for every candle/bar.
-
Risk metrics: volatility, standard deviation, and behavioral insights.
-
One-click professional reporting.
⏰ 3. Session Volatility & Strategy Bias
-
Identify the most bullish/bearish sessions.
-
Strategy guidance: breakout vs. range trading by session.
-
Best and worst trading hours for profitability.
-
Weekly and daily time-based trading tendencies.
4. Time-Based Price Behavior
-
Bullish/bearish tendencies by hour of the day.
-
Strong trend days vs. quiet, low-volatility days.
-
Volatility comparison by month and potential seasonality cycles.
💧 5. Volume & Liquidity Analytics
-
Real broker volume integration (futures or FX).
-
Liquidity maps by hour and day.
-
Volume–price correlation: how volume impacts returns.
-
Volume–volatility relationship to spot strong momentum.
⚡ 6. Advanced Support & Resistance Engine
-
Two proven quantitative methods to calculate S/R levels:
-
Range Division Theory.
-
Volume-Weighted Levels.
-
-
Levels automatically exported to MT5 via a free included indicator.
-
Filters to focus on only the most significant levels.
🕯️ 7. Candlestick Pattern Analysis
-
Automatic detection of 20+ major candlestick formations.
-
Historical success rates & average returns per pattern.
-
Market-specific performance insights.
-
Reversal vs. continuation signal detection.
Why Traders Choose This Template
✅ Built by a market professional with years of trading and research experience.
✅ Makes bank-level quantitative methods accessible to both beginners and pros.
✅ Simple, clear tables and charts — no coding needed.
✅ Helps traders replace intuition with statistical evidence.
What’s Included
-
📊 Main Excel Template with all analysis tools.
-
📥 MT5 Data Export Script.
-
🎯 Free MT5 Indicator to visualize support/resistance levels.
-
🔄 Lifetime updates & improvements.
Licensing & Protection
To keep this tool exclusive, it uses a secure licensing system. Traders provide their MT5 account number and Windows username to activate their copy. This ensures full protection against unauthorized sharing.
Update to v1.1
We added Summary Analysis
- Get a quick overview of your quantitative performance, including descriptive statistics, distributions, volatility, liquidity, time, and Baie analysis — all in one place.
- Easily compare results across different markets for faster insights and decision-making.
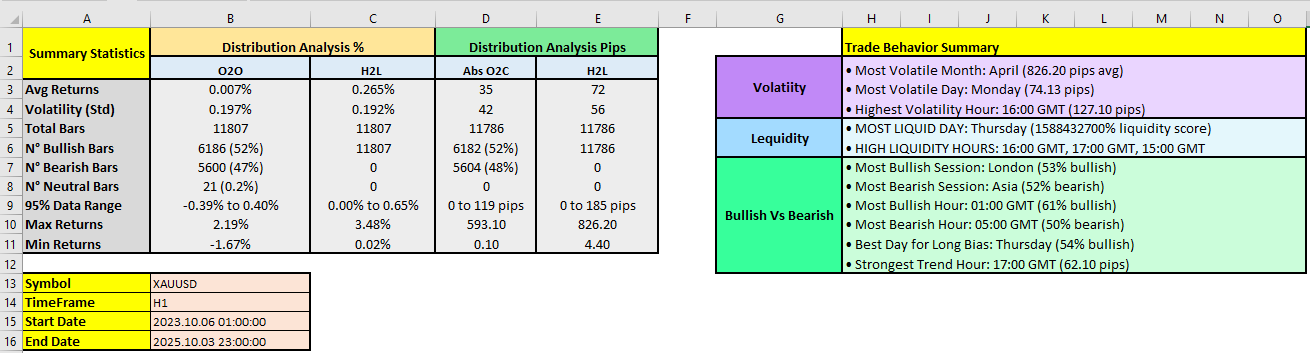
EURUSD H1 Last 2 Years, Quant summary


 Trading Guide")

