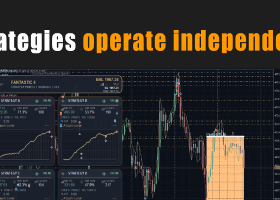

MT4 Version: MACD Strategy Multicurrency EA MT4
MT5 Version: MACD Strategy Multicurrency EA MT5
Complete User Documentation — MT4 & MT5
1. OVERVIEW
The MACD Strategy Multicurrency EA automates trading across multiple currency pairs from a single chart, using the MACD indicator as its core signal engine. It doesn't just show you MACD crossovers — it lets you choose from six distinct entry strategies and seven exit strategies, plus divergence detection, all while managing risk with ATR-based trailing stops, breakeven, and group-level stop-losses. The real problem it solves is the hassle of manually monitoring MACD signals on a dozen pairs and trying to execute trades fast enough — this EA handles the scanning, signal filtering, and order placement for you.
Who Should Use It: Active retail forex traders who rely on MACD for entries and exits but want to automate multi-pair execution without writing a single line of code.
Main Benefit: You get a fully automated, multi-strategy MACD trading system that can run on up to 28 pairs simultaneously, with sophisticated risk controls and multiple exit methods — all configurable from one chart.
2. INPUT PARAMETERS & SETTINGS
This product shares a common set of general input settings with all Multi-Currency Scanner Dashboard products in this series. The following sections are covered in the common guide: General Settings (pairs list, dashboard colors, panel size), Timeframe Signal Settings (individual TF scan per symbol), Timeframe Confluence Settings (multi-TF confluence scan), and Alert Settings (popup, push notification, email). For full details refer to the Common Multi-Currency Scanner Dashboard Settings Guide. The sections below cover only the product-specific inputs unique to this product.
General Settings
These settings control how the EA displays virtual stop-loss and take-profit lines on the chart, how it handles group-level risk, whether swap costs are included in profit calculations, and whether historical trade data is recorded for backtesting analysis.
| Setting Name | Type | Default Value | Description | Example |
|---|---|---|---|---|
| Chart lines for virtual SL/TP (never drawn during optimization) | bool | false | When enabled, the EA draws horizontal lines on the chart showing where your hidden stop-loss and take-profit levels sit. Useful for visual confirmation during live trading, but it's automatically suppressed during optimization runs to avoid clutter. Most traders leave this off unless they're manually monitoring positions. | true — Enable this only during live trading when you want to see your hidden SL/TP levels on the chart. |
| Group Stoploss Amount | double | 0 | Sets a maximum total loss in account currency for all positions opened by this EA across all pairs. When the combined floating loss hits this amount, all trades are closed. This is your "circuit breaker" — critical for protecting your account during volatile conditions. Set to 0 to disable. | 500 — Close all EA trades if total floating loss reaches $500 on a $10,000 account. |
| Include Swap charges in Profit | bool | true | When true, the EA factors overnight swap fees into its profit calculations for features like breakeven and trailing stop activation. Leave it on for realistic profit tracking, especially if you hold trades overnight. Turn it off only if you want to ignore swap costs in your risk logic. | true — Keep this enabled for accurate profit calculations on swing trades held for several days. |
| Enable history for backtests or optimization | bool | false | When enabled, the EA records detailed trade history data that can be analyzed after backtesting or optimization runs. This is purely for analysis — it has no effect on live trading. Enable it during optimization to get richer data for comparing parameter sets. | true — Turn this on when running optimization to capture detailed trade logs for later analysis. |
Atr Trailingstop Settings
These settings configure an ATR-based trailing stop that dynamically adjusts your stop-loss based on market volatility, using the Average True Range indicator to set activation thresholds, trail distance, and increment steps.
| Setting Name | Type | Default Value | Description | Example |
|---|---|---|---|---|
| Use ATR Trailing Stop | bool | false | Master switch for the ATR-based trailing stop feature. When enabled, the EA will dynamically adjust your stop-loss based on market volatility rather than a fixed pip distance. This is particularly useful in volatile markets where a fixed stop might get hit by noise. | true — Enable this on volatile pairs like GBP/JPY to let the stop adjust to market conditions. |
| ATR Timeframe | ENUM | PERIOD_CURRENT | Selects the timeframe used to calculate the ATR value for the trailing stop. Using a higher timeframe like H4 gives a smoother, more stable ATR, while the current chart timeframe reacts faster. Choose based on your trading style — slower for swing, faster for scalping. | PERIOD_H1 — Use H1 ATR for a balance between responsiveness and stability on a 15-minute chart. |
| ATR Period | int | 14 | The number of bars used to calculate the ATR value. A period of 14 is standard and works well for most markets. Increase it (e.g., 20) for smoother ATR that's less sensitive to recent spikes, or decrease it (e.g., 7) for faster reaction to volatility changes. | 14 — The default works for most pairs; try 20 on smoother pairs like EUR/USD. |
| Activation (ATR multiplier) | double | 2.0 | The profit level (in ATR units) that must be reached before the trailing stop activates. A value of 2.0 means the trade must be 2 ATRs in profit before trailing begins. Higher values reduce whipsaw but may miss some profit — lower values activate sooner but risk premature trailing. | 2.0 — Good starting point; increase to 3.0 for trend-following strategies on strong trends. |
| Trail distance (ATR multiplier) | double | 1.0 | The fixed distance (in ATR units) that the stop-loss trails behind the current price once activated. A value of 1.0 means the stop is placed 1 ATR away from the current price. Smaller values lock in profit faster but risk being hit by normal pullbacks. | 1.0 — Standard setting; use 0.8 for tighter trailing on fast-moving pairs. |
| Trail increment (ATR multiplier) | double | 0.5 | The minimum price movement (in ATR units) required before the trailing stop is adjusted upward. A value of 0.5 means the stop only moves after price advances by 0.5 ATR. This prevents the stop from being adjusted on every tiny tick, reducing unnecessary updates. | 0.5 — Good default; increase to 1.0 for less frequent adjustments on slower pairs. |
Grid Settings
This single setting controls whether the EA attempts to recover losses from all grid trades by closing them as a group when total profit reaches a target.
| Setting Name | Type | Default Value | Description | Example |
|---|---|---|---|---|
| Recover profit from all grid trades | bool | false | When enabled, the EA calculates the total net profit across all open grid trades and closes the entire grid when that profit reaches a predefined target. This is useful for grid strategies where individual trades may be in loss but the overall grid is profitable. Leave disabled for standard single-trade management. | true — Enable this if you're running a grid strategy and want to close all trades when the grid as a whole is profitable. |
Safeguard Settings
These settings act as safety nets for your account, including maximum loss limits and backtesting-only filters for minimum profit, trade count, and inactivity periods.
| Setting Name | Type | Default Value | Description | Example |
|---|---|---|---|---|
| Max Loss from initial balance [0: disable] | double | 0.0 | Sets a maximum drawdown limit as a percentage of the initial account balance. If the floating loss reaches this percentage, all trades are closed and the EA stops trading. This is your emergency stop — critical for preventing catastrophic losses. Set to 0 to disable. | 20 — Stop all trading if losses reach 20% of the starting balance on a $5,000 account. |
| Minimum Profit Percent [backtesting only] [0: disable] | double | 0 | A backtesting filter that rejects any optimization result where total profit is below this percentage. Useful for quickly discarding underperforming parameter sets during optimization. Has no effect on live trading. Set to 0 to disable. | 10 — Only consider optimization results with at least 10% total profit over the test period. |
| Minimum Trades [backtesting only] [0: disable] | double | 0 | A backtesting filter that rejects optimization results with fewer than this many trades. Helps avoid overfitting by ensuring the strategy has been tested on a sufficient number of trades. Set to 0 to disable. | 50 — Only accept results with at least 50 trades to ensure statistical significance. |
| Max inactive days [backtesting only] [0: disable] | int | 0 | A backtesting filter that rejects optimization results where the EA was inactive (no trades) for more than this many consecutive days. Useful for ensuring the strategy remains active during the test period. Set to 0 to disable. | 30 — Reject results where the EA didn't trade for more than 30 consecutive days. |
Macd Settings
These are the core MACD parameters — timeframe, short/long periods, signal period, applied price, and the entry/exit strategy selection that defines how the EA interprets MACD signals for trade decisions.
| Setting Name | Type | Default Value | Description | Example | ||||||||||||||||||||||||||||||||
|---|---|---|---|---|---|---|---|---|---|---|---|---|---|---|---|---|---|---|---|---|---|---|---|---|---|---|---|---|---|---|---|---|---|---|---|---|
| Macd Timeframe | ENUM | PERIOD_CURRENT | Selects the timeframe on which the MACD indicator is calculated. Using a higher timeframe (e.g., H4) gives more reliable signals but fewer opportunities, while the current chart timeframe reacts faster. Choose based on your trading horizon — higher for swing, lower for intraday. | PERIOD_H1 — Use H1 MACD for swing trading on a 15-minute chart to filter out noise. | ||||||||||||||||||||||||||||||||
| Macd Short Period | int | 12 | The fast EMA period used in the MACD calculation. A shorter period (e.g., 8) makes the MACD line more responsive to recent price changes, generating earlier signals but with more false positives. The default 12 is a good balance for most forex pairs. | 12 — Standard setting; try 8 for faster signals on volatile pairs like GBP/JPY. | ||||||||||||||||||||||||||||||||
| Macd Long Period | int | 26 | The slow EMA period used in the MACD calculation. A longer period (e.g., 30) smooths out the MACD line more, reducing false signals but also delaying entries. The default 26 works well for most strategies; increase it for stronger trend confirmation. | 26 — Standard; increase to 30 for smoother signals on slower-moving pairs like EUR/USD. | ||||||||||||||||||||||||||||||||
3. HOW IT WORKS Core Calculation & LogicThe EA calculates the MACD line, signal line, and histogram for every symbol in your list, on every tick. It compares the current MACD value against the signal line and the previous bar's values to detect crossovers, crossunders, and momentum shifts. The core math is the standard MACD formula — fast EMA minus slow EMA, with a signal SMA applied to that difference — but the EA applies it across multiple pairs from a single chart, which is where the real power lies. What you're really getting here is a systematic scanner that checks each pair against your chosen entry strategy (see below) and opens a trade the moment conditions align. It doesn't just show you signals on a dashboard — it acts on them. The EA also supports divergence detection (strategy 7), which looks for price-MACD divergences over a configurable lookback window, a setup many traders overlook because it's tedious to spot manually across multiple pairs. Entry Strategies ExplainedThe EA includes seven distinct entry strategies, selected via the Macd Entry Strategy parameter. Each one defines a different set of conditions for entering a trade. You'll want to pick the one that matches your trading style and the current market environment. Strategy 1 — MACD Crossover (Standard)BUY Signal: The MACD line crosses above the signal line on the current bar, and the MACD value is above zero (positive histogram). SELL Signal: The MACD line crosses below the signal line on the current bar, and the MACD value is below zero (negative histogram). Best For: Trending markets where you want to catch the early part of a move. This is the classic MACD crossover setup most traders learn first. Strategy 2 — MACD Crossover (Zero-Line Filter)BUY Signal: MACD line crosses above the signal line, but only when the MACD is above zero. This filters out weak crossovers that occur below the zero line. SELL Signal: MACD line crosses below the signal line, but only when the MACD is below zero. Best For: Strong trends where you want to avoid counter-trend signals. I prefer this one when I'm trading higher timeframes like H4 or daily. Strategy 3 — MACD Histogram ReversalBUY Signal: The histogram (MACD - signal) turns from negative to positive on the current bar. SELL Signal: The histogram turns from positive to negative on the current bar. Best For: Quick counter-trend moves or range-bound markets where crossovers are too slow. The histogram changes direction before the lines cross, so you get earlier entries — but also more false signals. Strategy 4 — MACD Histogram Divergence (Simple)BUY Signal: Price makes a lower low, but the histogram makes a higher low (bullish divergence). SELL Signal: Price makes a higher high, but the histogram makes a lower high (bearish divergence). Best For: Reversal spotting at the end of a trend. This is a simpler divergence check than strategy 7 — it only looks at the histogram, not the MACD line itself. Strategy 5 — MACD Line DivergenceBUY Signal: Price makes a lower low, but the MACD line makes a higher low. SELL Signal: Price makes a higher high, but the MACD line makes a lower high. Best For: More reliable divergence signals compared to histogram divergence, since the MACD line is smoother. Use this when you want fewer but higher-probability reversal setups. Strategy 6 — MACD Zero-Line CrossoverBUY Signal: The MACD line crosses above the zero line. SELL Signal: The MACD line crosses below the zero line. Best For: Trend confirmation. This is a lagging signal — you enter after the trend is already established — but it keeps you out of choppy sideways markets. Strategy 7 — MACD Divergence (Advanced, with Lookback Control)BUY Signal: Bullish divergence detected using the MACD line, with configurable lookback bars (default 50), minimum bar distance between divergence points (default 20), and a minimum price gap in pips (default 15). SELL Signal: Bearish divergence detected using the same parameters. Best For: Traders who want fine-grained control over divergence detection. The extra parameters let you filter out minor divergences that don't have enough price separation or are too close together. This is the most customizable strategy in the EA. Step-by-Step WorkflowStep 1: Attach the EA to a chart. Any chart will do — the EA doesn't trade the chart's symbol unless you include it in the symbol list. Use a low-load pair like EURUSD to minimize CPU usage. Step 2: Set your symbol list. In the SYMBOLS parameter, enter the pairs you want to trade, separated by commas. The default is EURUSD,GBPUSD,USDCHF — you'll probably want to expand that to 8-12 pairs for proper diversification. Step 3: Choose your entry strategy. Set Macd Entry Strategy to one of the seven options above. Start with Strategy 1 (standard crossover) if you're new to the EA. Step 4: Configure risk management. Set your lot size, stop loss, and take profit. If you're unsure, start with 0.01 lots and a 50-pip stop loss. You can always adjust later. Step 5: Enable or disable hidden SL/TP. The HIDDEN_SL_TP parameter lets you hide stop loss and take profit from the broker (virtual SL/TP managed by the EA). This is useful if your broker doesn't allow stops within a certain distance of the market. Step 6: Run a backtest first. Before going live, test the EA on at least 6 months of data with your chosen settings. Pay attention to drawdown and number of trades — you want enough trades to be statistically meaningful. Step 7: Go live on a demo account. Run the EA on a demo for at least 2 weeks. Monitor how it behaves during news events and market opens. Only then consider moving to a live account. 4. RISK MANAGEMENT FEATURESThe EA includes several risk management options that go beyond basic stop loss and take profit. Here's what each one does and when you'd use it.
5. IMPORTANT NOTES & WARNINGSKnown Limitations
Settings Beginners Should NOT Change
Dashboard Usage Tips
Quick Start GuideFollow these steps to get started in under 5 minutes:
|