Speculator's diary, entry №11 (04.12.2023). Yield 43'393 %.
Deal with XAU/USD. Yield 43'393,00%.
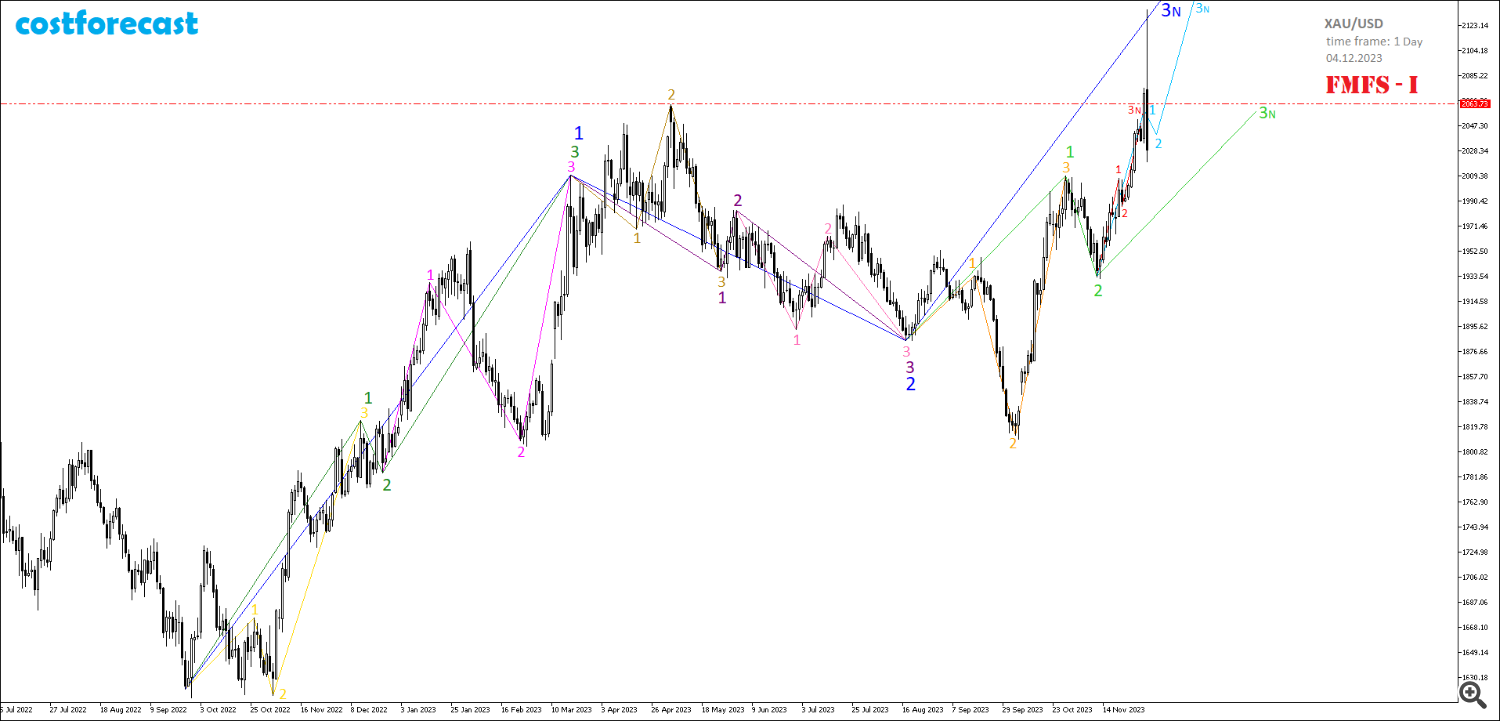
A long position on the XAU/USD instrument with a volume of 0.03 lot at a quote of 1988.71, opened on 10/20/2023 on the “costforecast” account, was closed on 12/04/2023 at a quote of 2137.78 with a sharp explosive increase in gold quotes (Fig. 11-1).
The sharp growth gave way to an equally sharp fall, and when the level reached $2108.65 per ounce, a long position with a volume of 0.06 lot was opened.
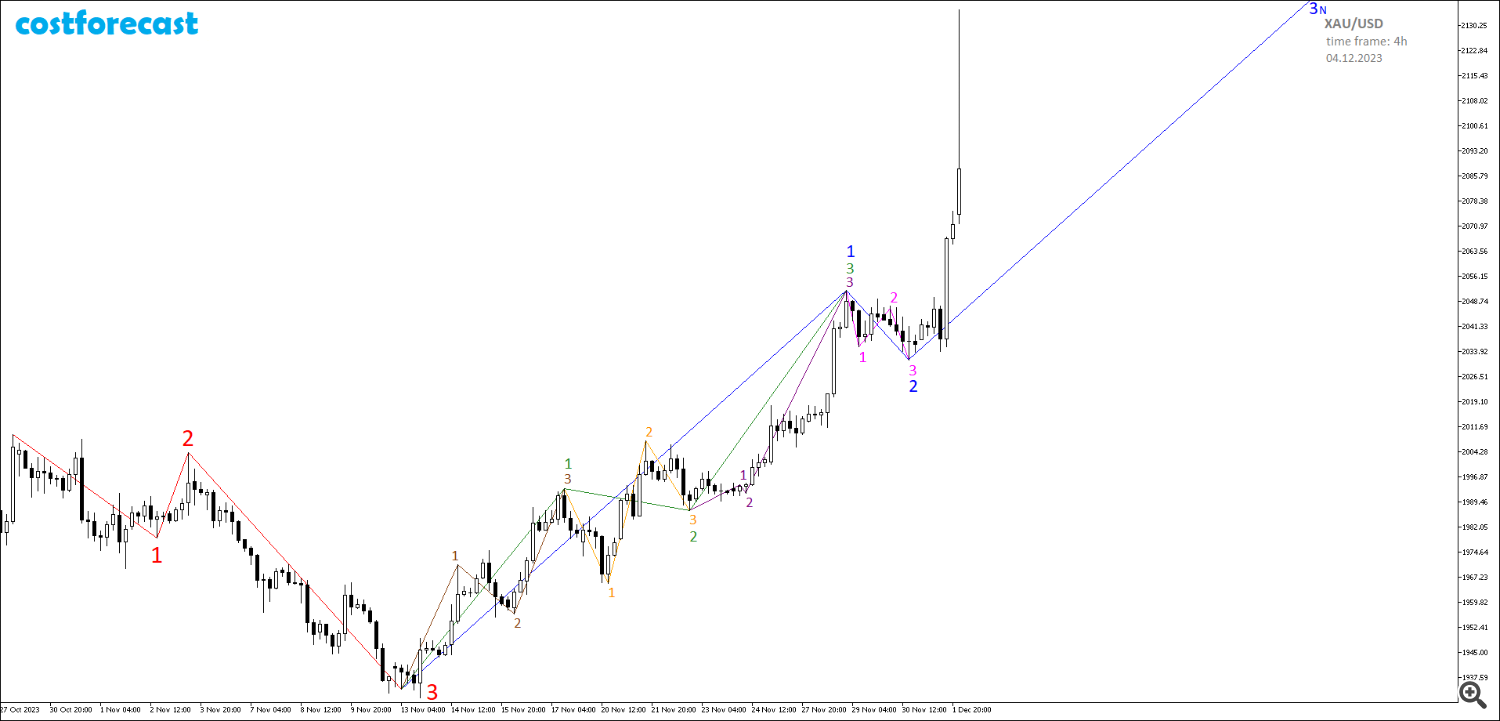
The purchase decision was based on the assumption that at the time interval (11/29/2023_00:00; 11/30/2023_16:00) the formed fractal F№23, which is indicated in pink, represents the 2nd segment of the forming fractal of one higher order, indicated in blue color (Fig. 11-2). Moreover, the 1st segment of the blue fractal was formed on the time interval (11/13/2023_04:00; 11/29/2023_00:00).
The formation of a blue fractal is based on the assumption that in the time interval (10/27/2023_20:00; 11/13/2023_04:00) a fractal of a higher order was formed, which is indicated in red on the graph.
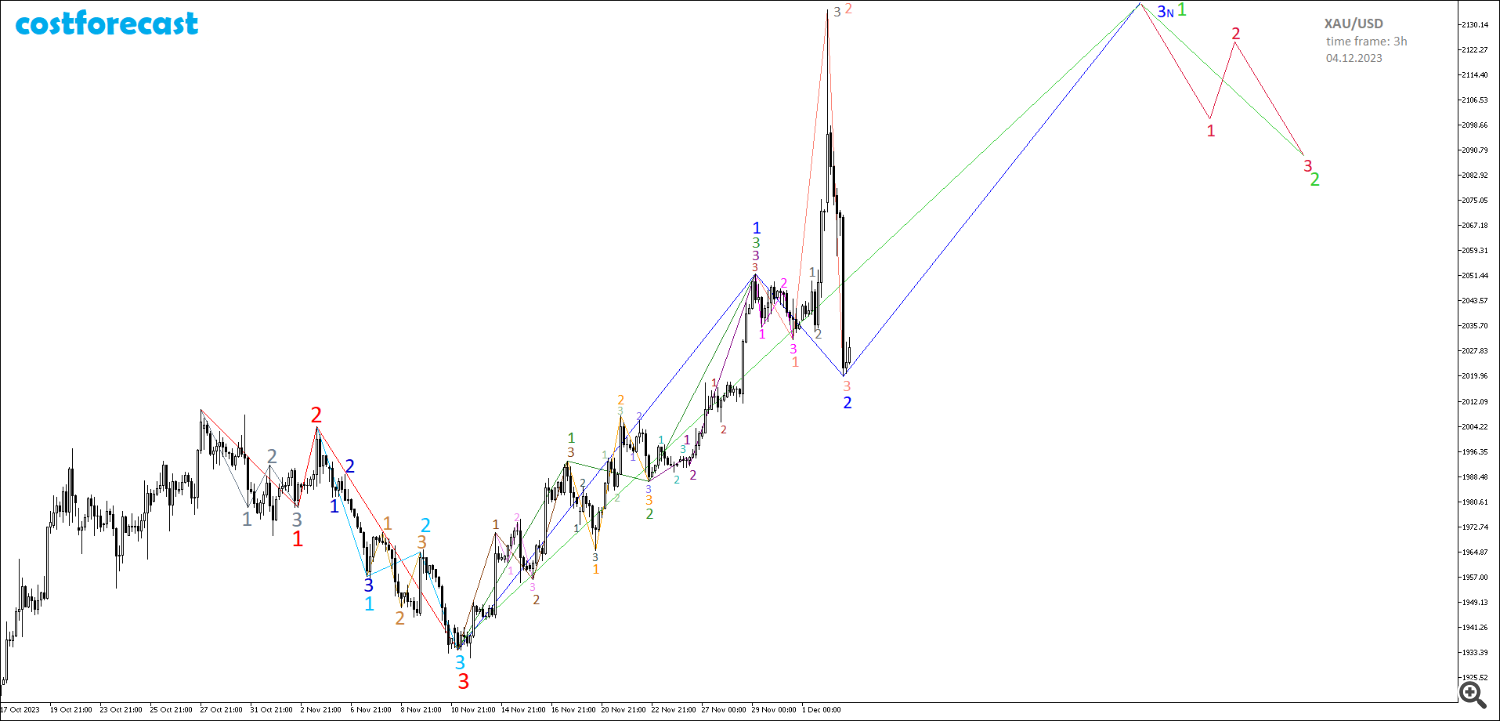
Closing the day on 12/04/2023 showed that the pink fractal on the time interval (11/29/2023_03:00; 11/30/2023_15:00) cannot be the 2nd segment of the blue fractal (Fig. 11-3).
The existing fractal structure of the chart at the end of the trading day still suggests that the dynamics of gold quotes takes place within the framework of the formation of a blue fractal.
The assumption will be correct if the growth of gold prices continues with the update of the maximum indicated on the chart.
Opening a long position after a sharp rise in quotes is always associated with high risk (Fig. 11-4), but the picture of the global fractal structure of the chart allows us to accept this risk and expect the continuation of the upward trend.

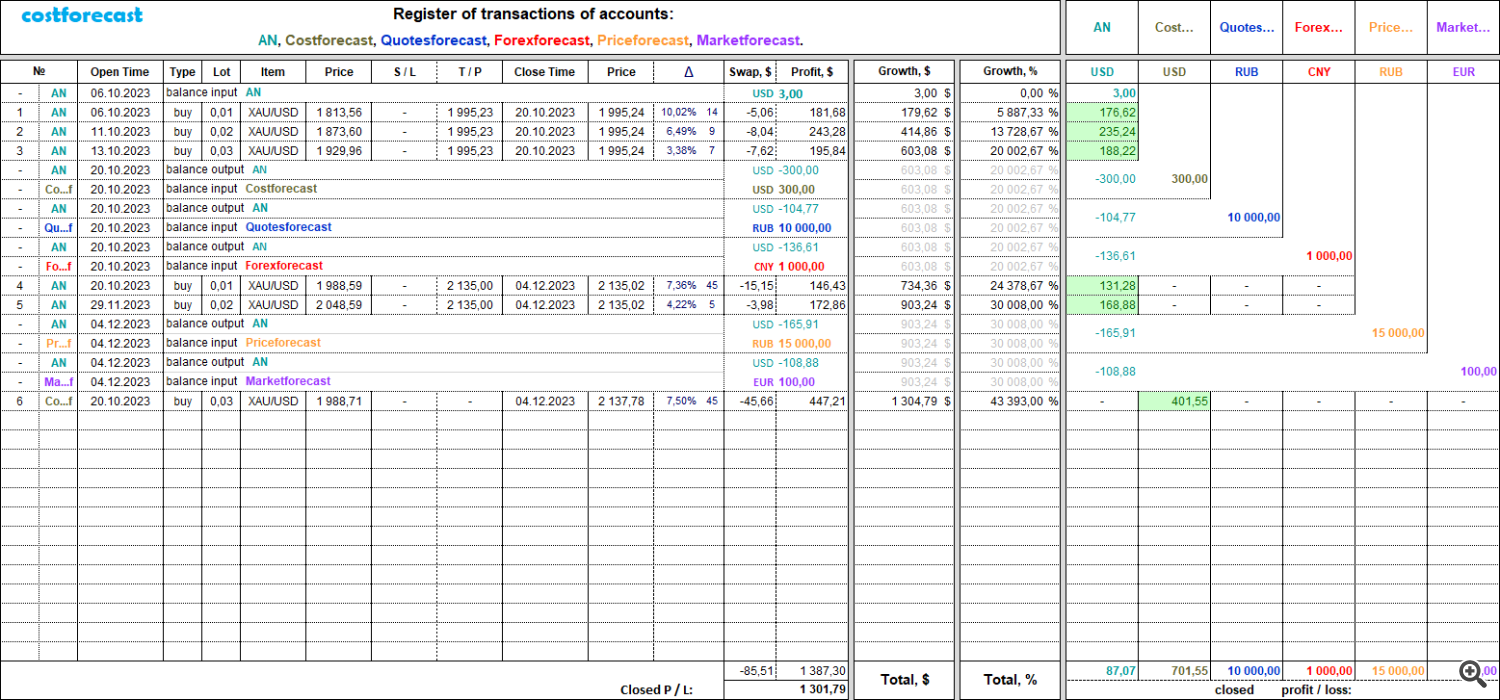
A trade with a volume of 0.03 lot brought a profit in the amount of 401.55USD due to a price change of 7.50% within 45 days and allowed the trade profitability indicator to rise to a value of 43393.00% (Fig. 11-5).
More to come.
You can learn about the modeling method in the article “Apophenia as an apologist for clairvoyance in capital markets”.
You can familiarize yourself with the alphabet for reading graphs by watching the short video “Alphabet of Niro Attractors”.
You can monitor transactions carried out on your accounts online by following the links posted on the costforecast website in the “trading signals” section: https://costforecast.bitrix24.site/tradingsignals-en/
Read all Diary entries on the costforecast website at the link: https://costforecast.bitrix24.site/blog1-2-en/
