
Bill Williams Advanced is designed for chart analysis using Bill Williams' "Profitunity" system. The indicator analyzes the signals of the AO and AC indicators on four time frames at once and places it(signals) in the panel in the upper left corner of the chart. In addition, using hot keys, the indicator instantly displays/hides the AO and AC indicators.
The indicator is available only for the fifth version of the trading terminal:
Disclaimer:
- It will not work on instruments where there are less than 37 bars on the timeframe it analyzes.
- The indicator is available only for the fifth version of the trading terminal:
The indicator is written based on the "Profitunity" system by Bill Williams. To fully understand the logic of using the indicator, it is recommended to read the book “New Trading Dimensions” by Bill Williams. It is not recommended to use the indicator for traders unfamiliar with "Profitunity" system.
How does the indicator panel work?
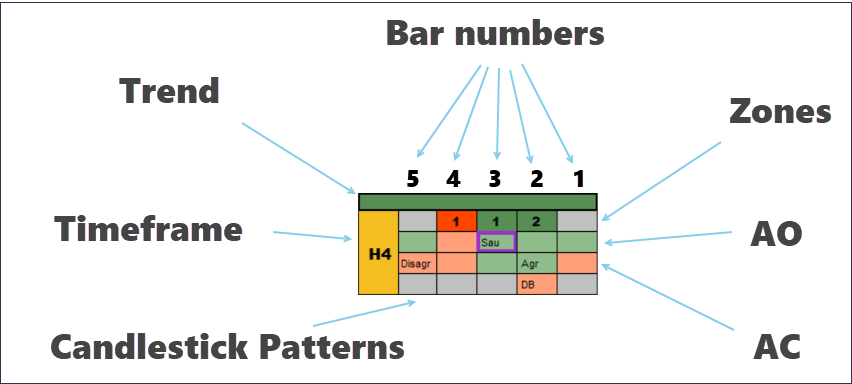
- Columns. The bars from right to left (marked with numbers) correspond to the last five closed bars on the price chart.
- 1 line. Displays signals of Zones of the "Profitunity" system.
- 2nd line. Displays signals from the AO (Awesome Oscillator) indicator.
- 3 line. Displays the signals of the AC (Accelerator Oscillator) indicator.
- 4 line. Candlestick Patterns, including Pin Bar, Outside Bar, PPR, and Divergent Bar.
- Timeframe. The time frame is displayed on the left. If the timeframe is current, it is painted yellow.
- Trend(Added in latest update). It can be either green (ascending) or red (descending). Determined by the Alligator indicator.
Signal types
The "Bill Williams Advanced" indicator duplicates the classic signals of the "Profitunity" system. All signals on the indicator panel are determined by closed bars. There are four types of such signals: Zone signals, AO signals, AC signals, Reversal signals.
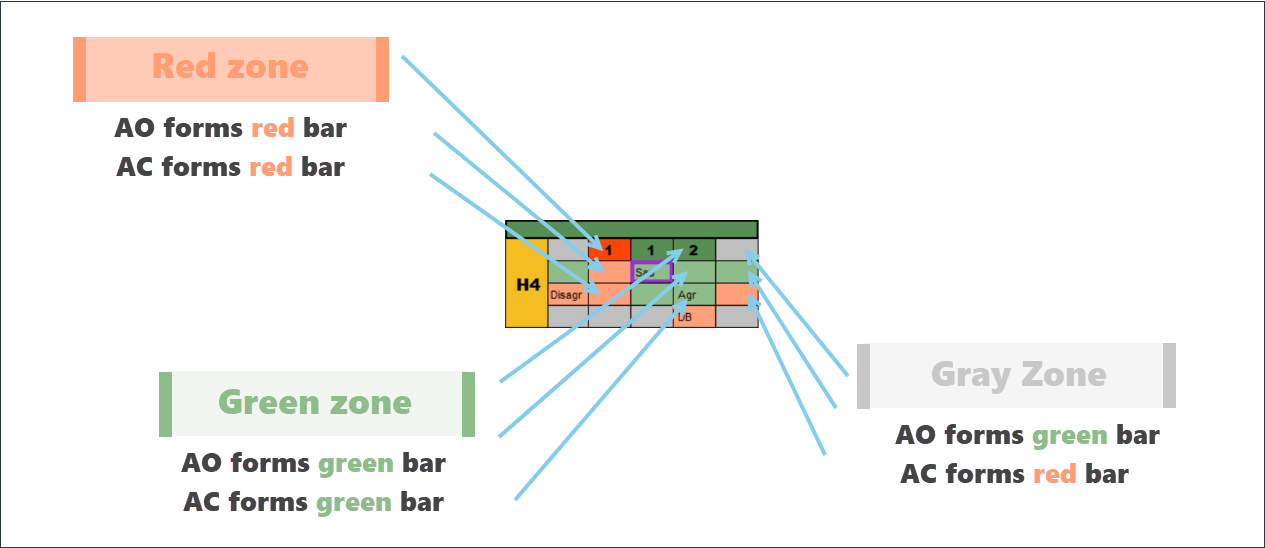
- The red zone is a situation where the AO and AC indicators simultaneously move in a downward direction and form red bars at the moment the bars close.
- The green zone is a situation where the AO and AC indicators simultaneously move in an upward direction and form green bars at the moment the bars close.
- The gray zone is a situation where the AO and AC indicators move in different directions. For example, AC might be green and AO might be red.
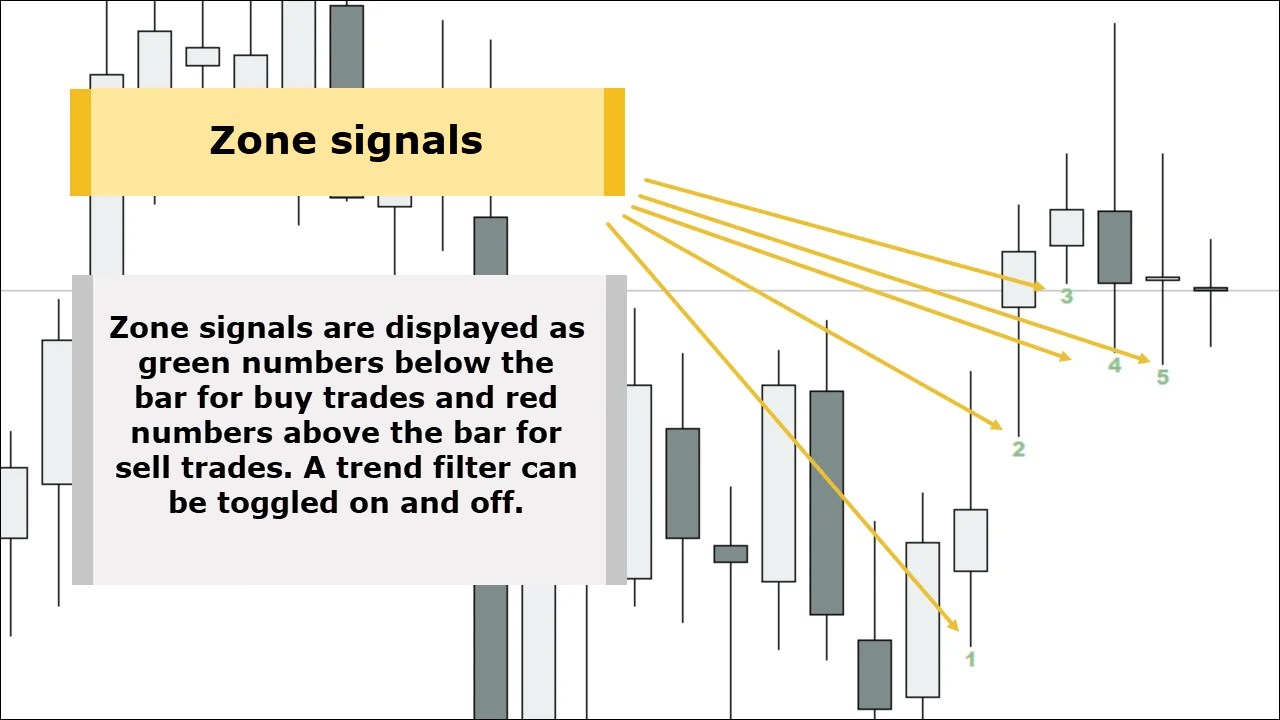
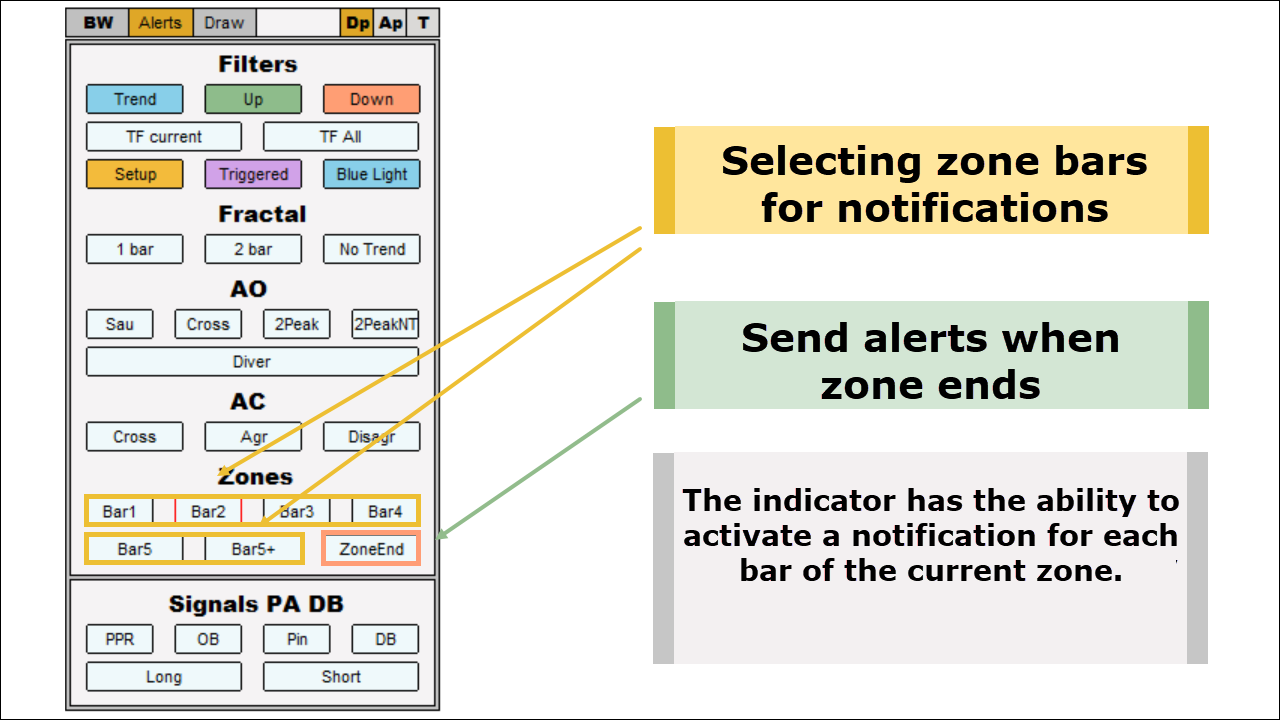
1.1 Zone duration
The duration of the formation of the zone is marked with numbers: 1 - the first bar of the zone, 2 - the second bar of the zone, etc. Only red and green zones are marked with numbers; the gray zone (absence of a trend) is not marked in any way. In the example below, the indicator indicated a strong uptrend (the green zone lasted 4 bars in a row).

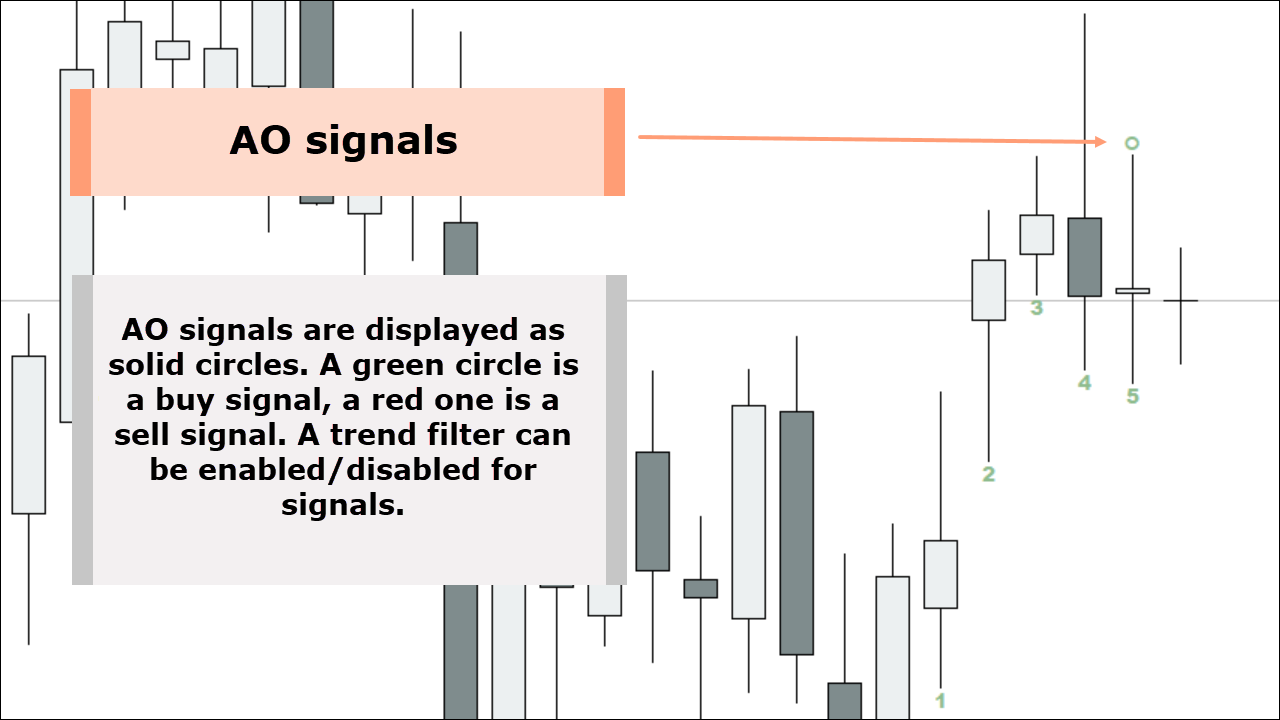
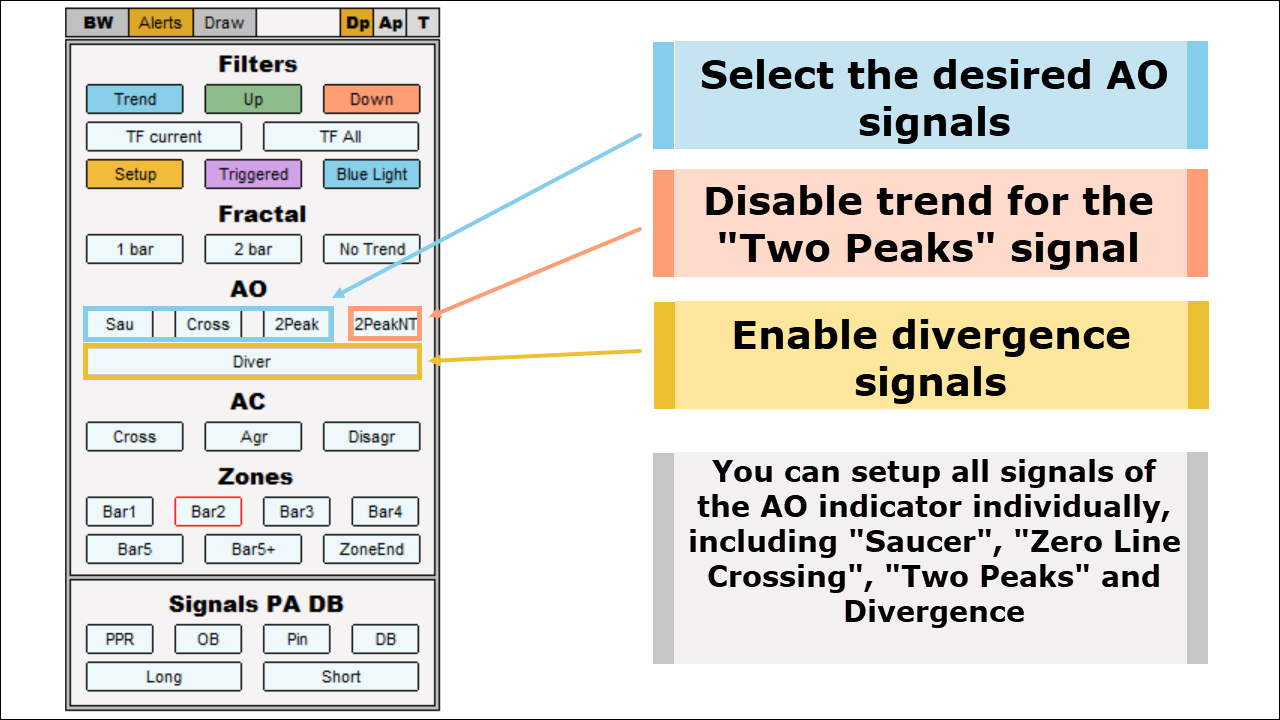
2. AO signals
Within the "Profitunity" system there are three types of signals that the AO indicator gives:
- "Saucer" - marked on the indicator panel as "Sau"
- "Crossing the zero line" - marked on the indicator panel as "Cross"
- "Two peaks" - marked on the indicator panel as "2peak"
Below you can see the hourly chart of the GBP/USD currency pair, where the "Crossing the zero line" signal was formed on the AO indicator.
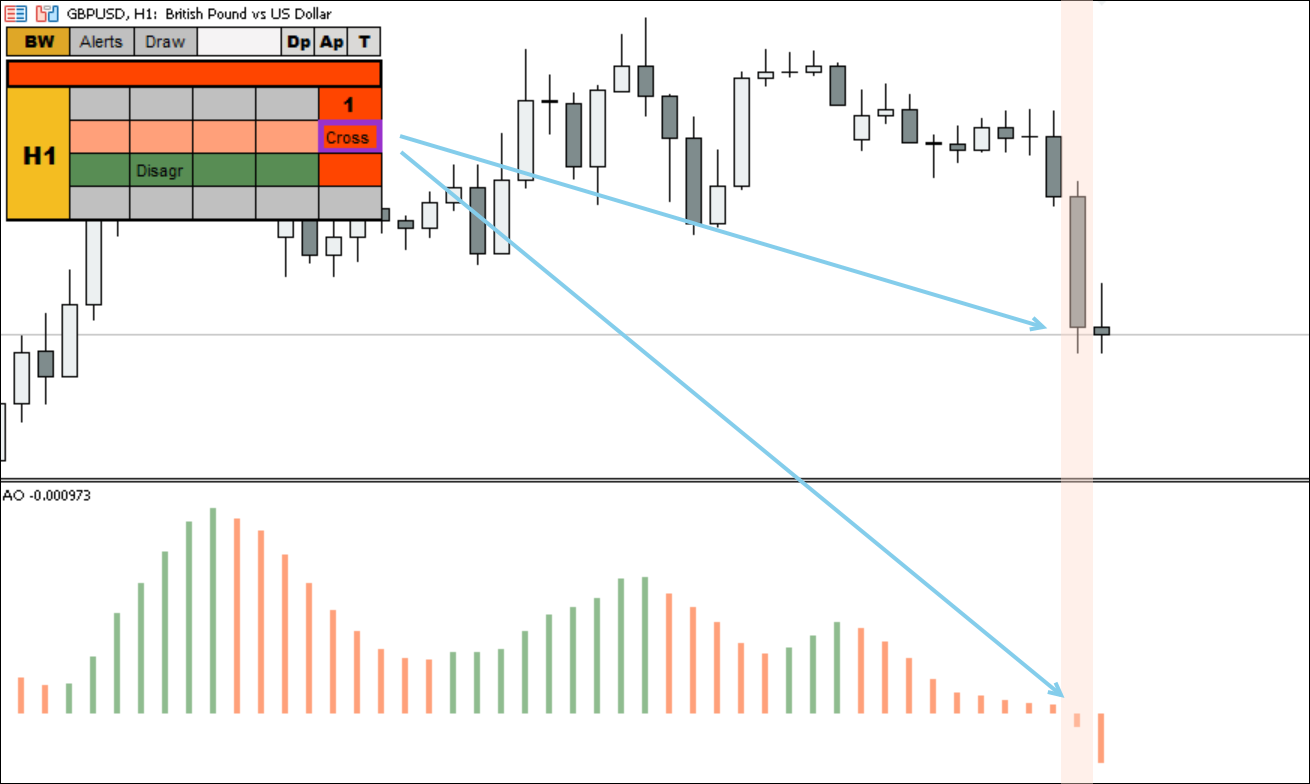
To trade AO signals, the Profitunity system recommends using pending orders. For example, in the picture above, it would be necessary to place a Sell Stop below the low of the signal bar.
It's recommended to trade signals ("Crossing the zero line" and "Saucer") only with the trend, which is determined using the Alligator indicator. The "Two Peaks" signal is a reversal signal and can be traded both with and against the trend.
Exceptions to the rules (when you can trade a countertrend):
- “5 bullets that kill a trend” is a setup that appears at the moment of reversal of major movements.
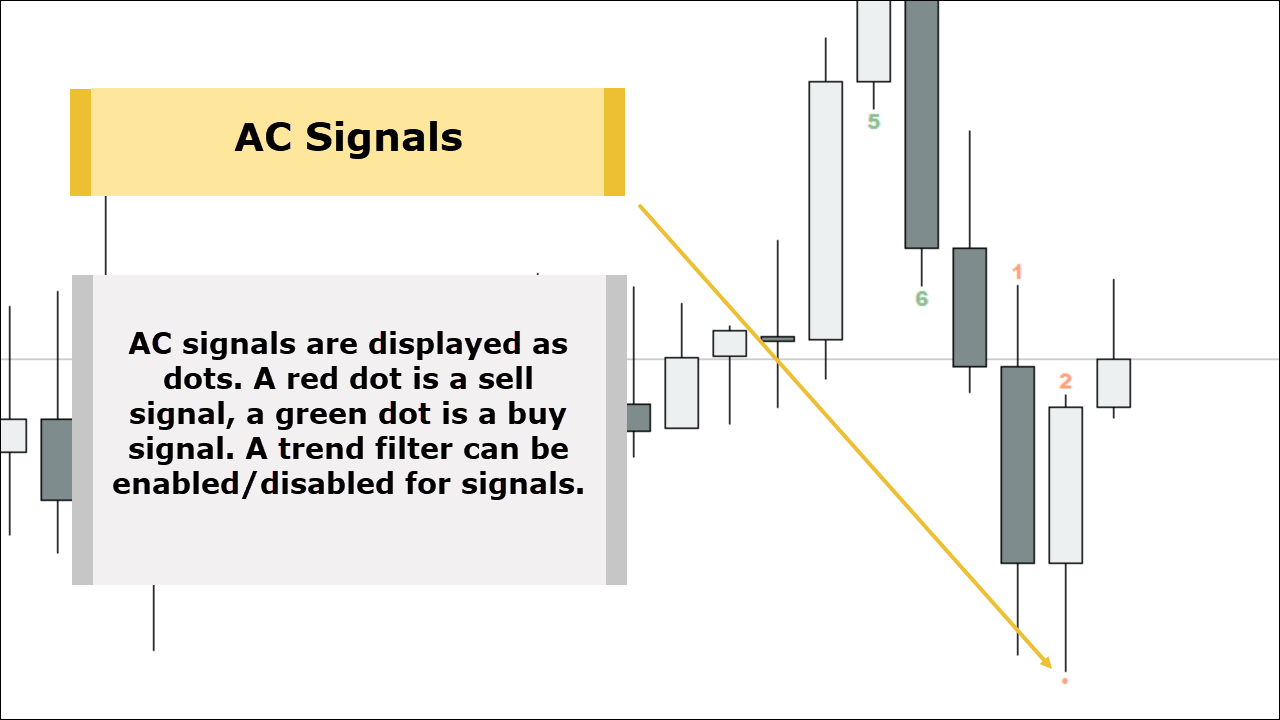
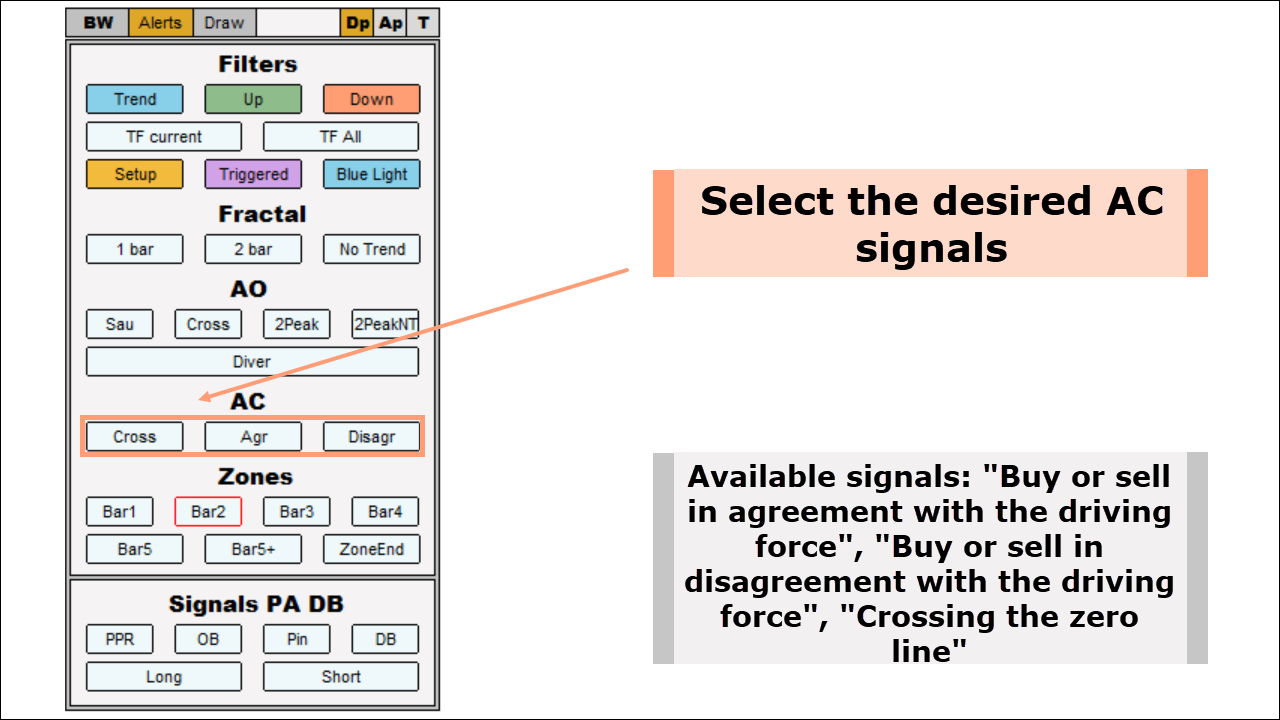
3. AC signals
The AC indicator also gives three types of signals:
- "Crossing the zero line" - marked on the indicator panel as "Cross"
- "Buying or selling in accordance with the driving force" - marked on the indicator panel as "Agr"
- "Buying or selling in disagreement with the driving force" - marked on the indicator panel as "Disagr"
As with AO, the direction of the signal is indicated by color. For example, if a signal appears in a red box, then it is for sale, and if in a green box, it is for buy.
In the example below, the AC indicator contains the signal “Buy in accordance with the driving force" - “Agr” on the indicator panel.
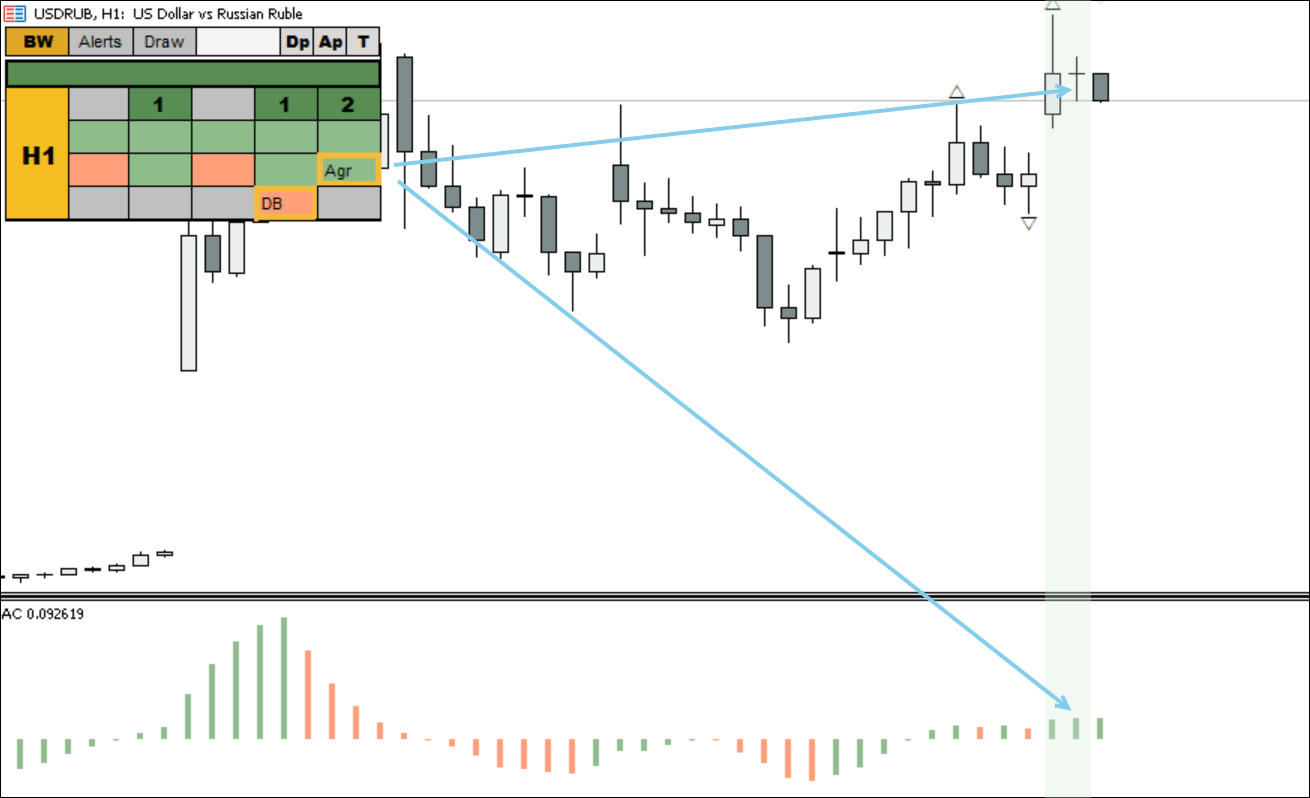
Within the "Profitunity" system, AC indicator signals are recommended to trade in the direction of the trend, which is determined using the "Alligator" indicator.
Exceptions to the rules (when you can trade a countertrend):
- The situation when the AC signal coincides with the “2 peaks” reversal signal on the AO indicator.
- “5 bullets that kill a trend” is a setup that appears at the moment of reversal of major movements.
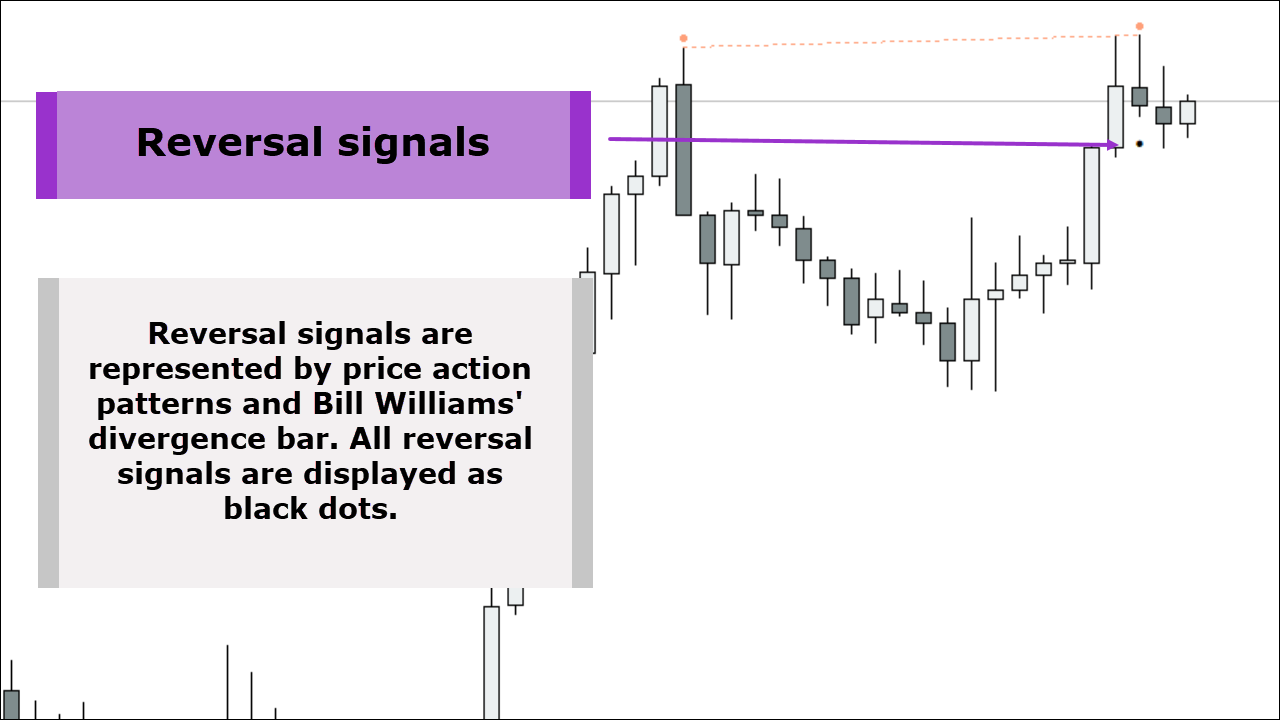
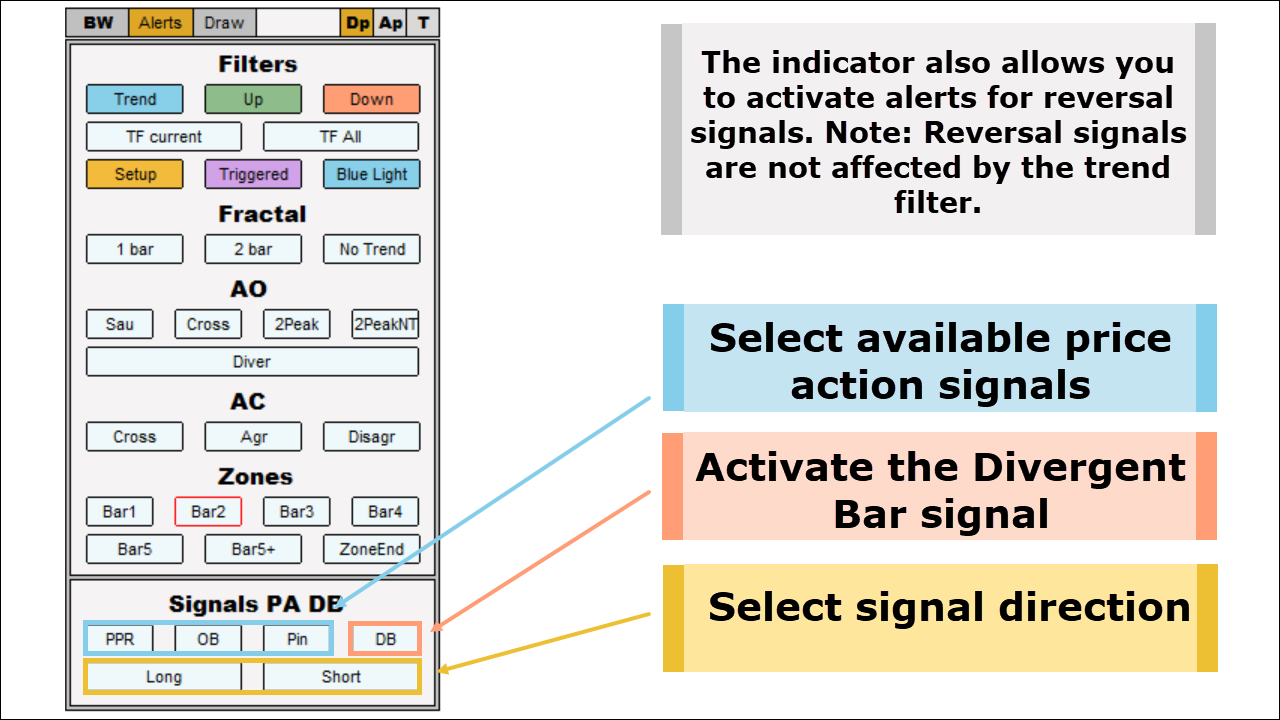
4. Reversal signals
Reversal signals originate from two different systems:
- Price Action system patterns. These include "Pin Bar," "Outside Bar," and "PPR." They are displayed on the panel as "Pin," "OB," and "PPR."
- "Bill Williams' Divergence Bar." Displayed as "DB" on the indicator panel.
The background of the cell where the pattern appears indicates the signal direction. A green background indicates an upward signal. A red background indicates a downward signal.
In the example below, a "divergent bar" signal to sell was found:

5. Divergence
The indicator also searches for divergences using the AO indicator. The detected signal is displayed on the Bill Williams Advanced indicator panel, on the price chart, and on the AO indicator histogram.

Outlining cells with signals
On the indicator panel, cells with signals are outlined in different colors. This was done in order to distinguish triggered signals from those that have not yet triggered.
Yellow outline - The signal has been formed and can be used (place a pending order beyond the high or low of the signal bar).

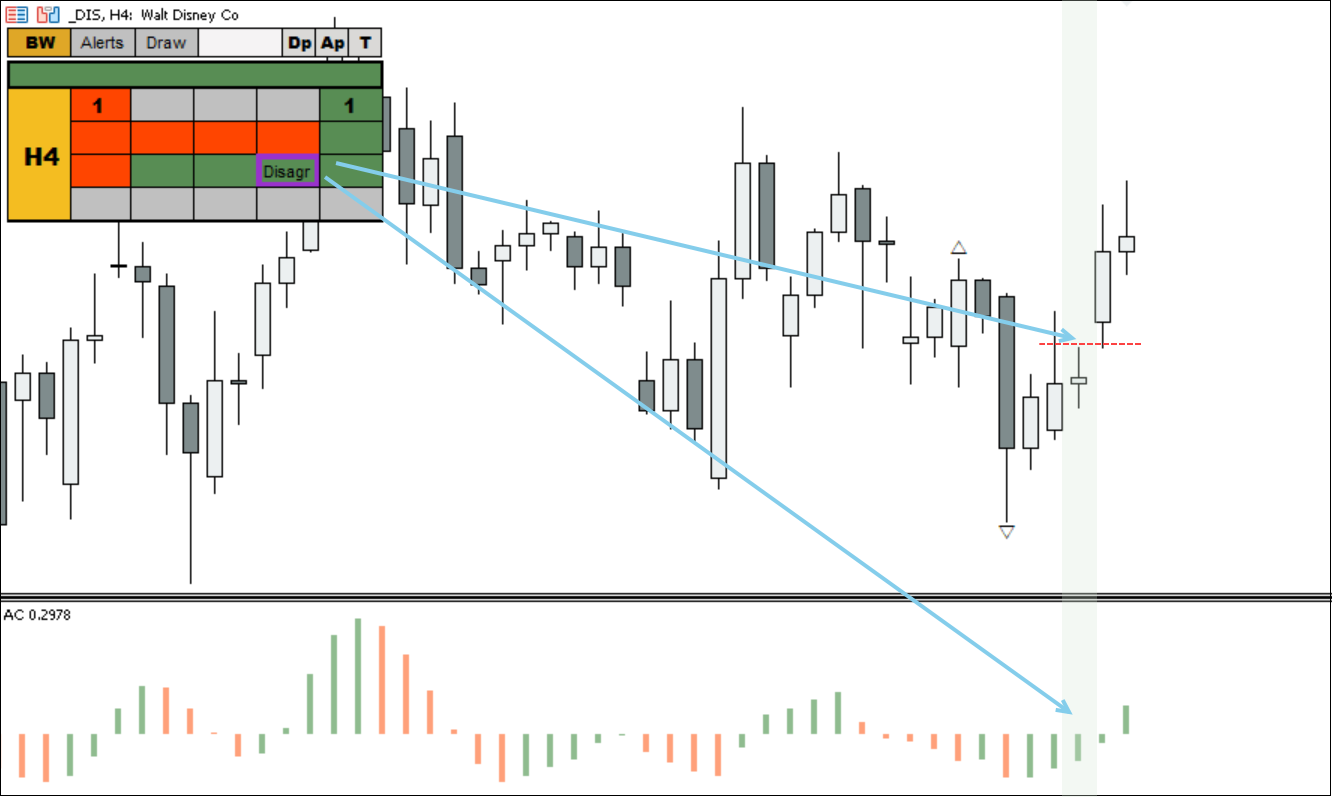
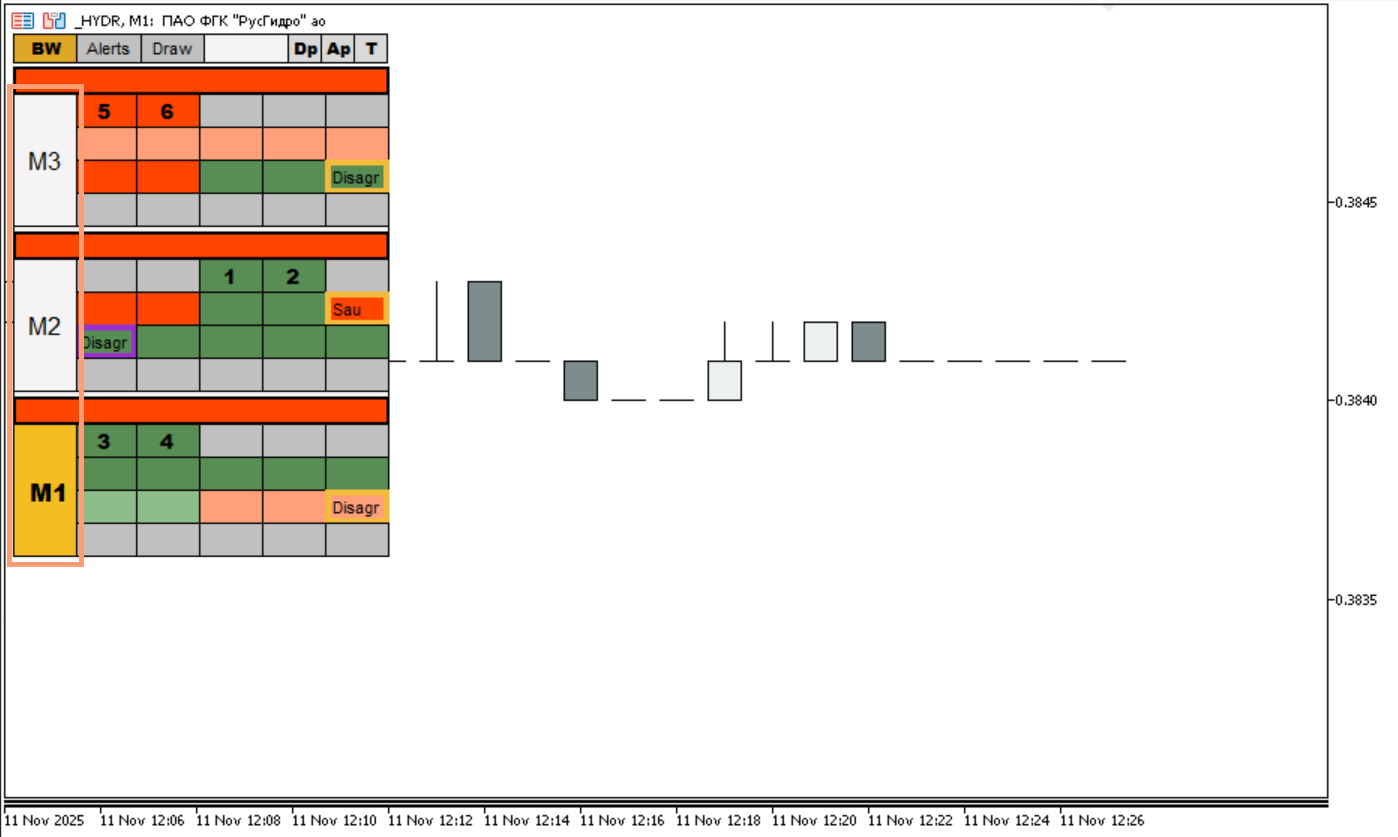
In the example below, a “Buy in disagreement with the driving force” signal was generated on AC. The maximum of the signal candle was broken, indicating activation of the signal. After breaking through the maximum, the signal turned purple on the indicator panel.

In the example above, a "Buying in accordance with the driving force" signal was generated on the ascending signal candle using the AC oscillator. The "Profitunity" system involves using a pending "Buy Stop" order beyond the signal candle's high. As can be seen in the example above, the candle following the signal candle failed to break the signal candle's high and closed below it, while maintaining the buy direction on the AC oscillator.
The signal on the indicator panel is highlighted in blue, indicating that the upward signal remains, but the pending order can be moved beyond the high of the next candle. This gives us a more favorable entry price.
Without outline - The conditions for generating the signal are no longer relevant, or it has already served its purpose.
In the example below, a buy signal “Buying in disagreement with the driving force” was generated for AC. The low of the signal bar was not broken, which means the signal did not work. After this, the AC direction changed to upward, which finally canceled the signal. In such a situation, the outline disappears.

Displaying signals on the price chart
The indicator displays all detected signals not only in the panel on the left side of the chart, but also on the chart itself. Signal display must be configured first. To do this, click the "Draw" button on the indicator panel.
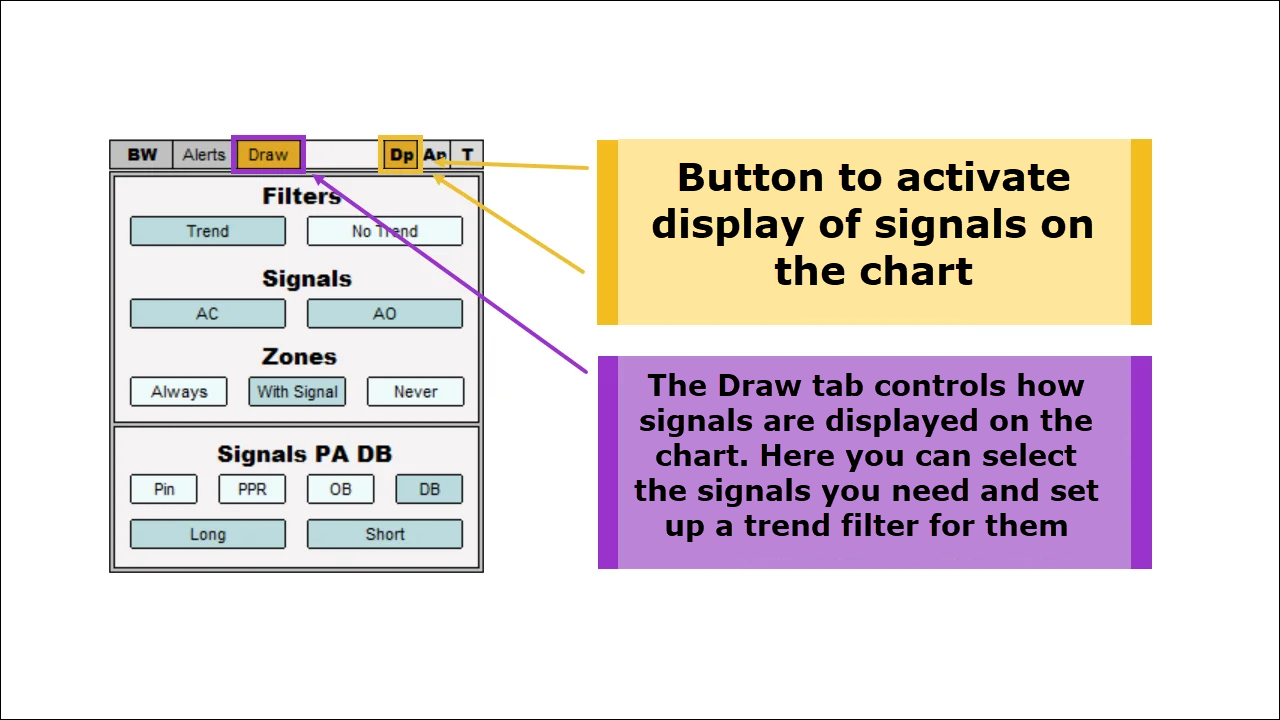
Filters:
- Trend - display only trending signals
- No Trend - display all existing signals
Signals:
- AC - display AC signals
- AO - display AO signals
Zones:
- Always - display zone numbers on the last five closed bars
- With Signal - display zone numbers only on bars with AO and AC signals
- Never - never display zone numbers
Reversal signals (Signals PA DB)
- Pin - display Pin bar
- PPR - display PPR
- OB - display Outside bar
- DB - display Divergent bar
- Long - display only buy patterns
- Short - display only sell patterns
1. Zone signals
2. AO signals
3. AC Signals
4. Reversal signals
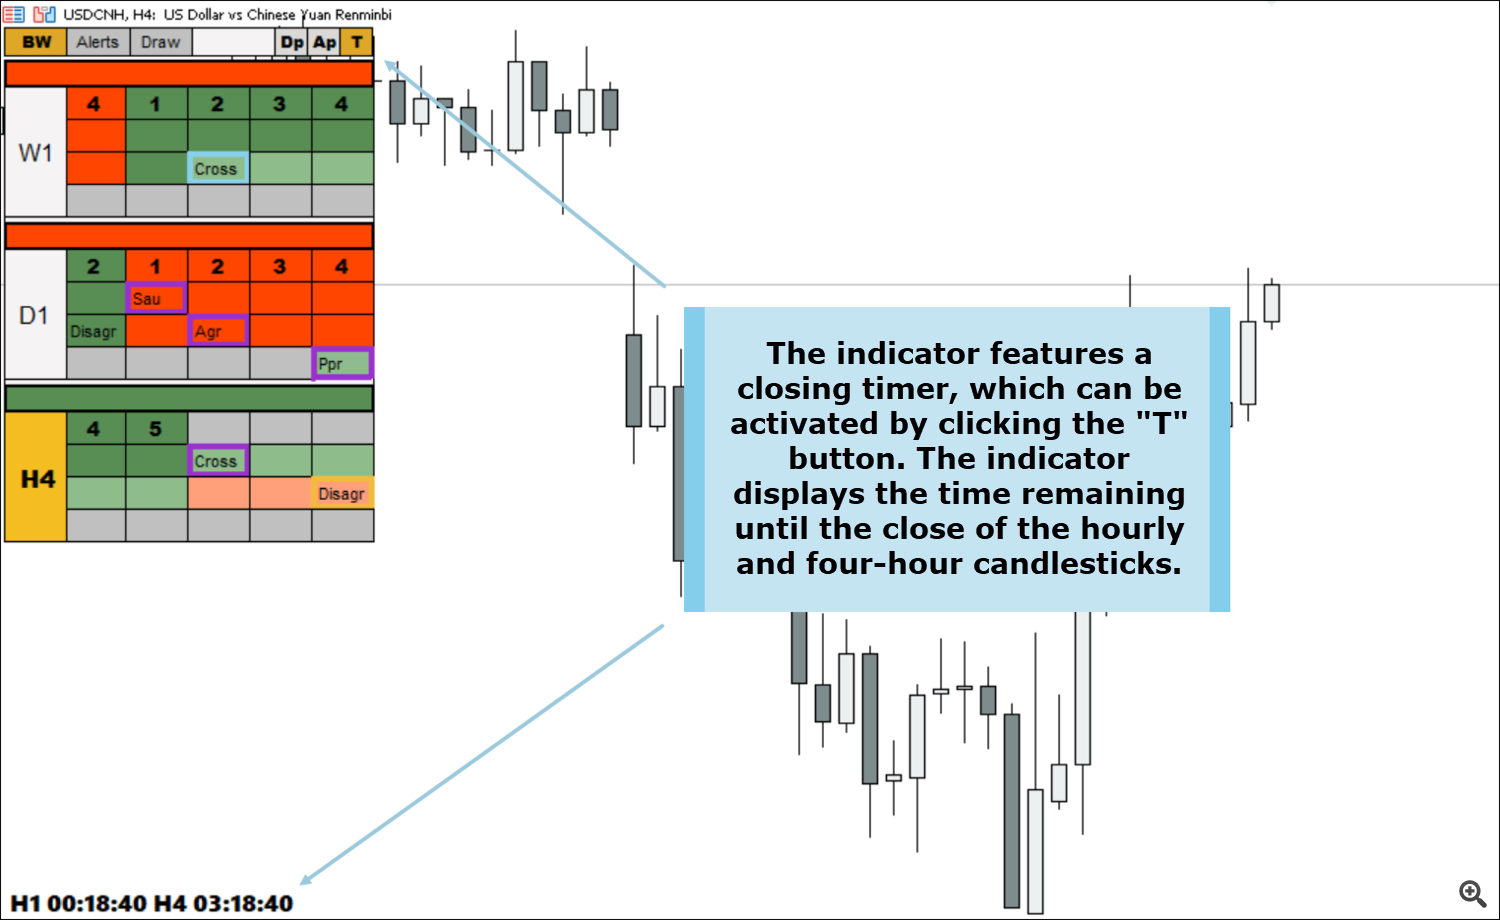
Timer
The Profitunity system's signals are tied to the candle's closing time. This means that a new system signal may appear at the close of, for example, an hourly or four-hour candle.
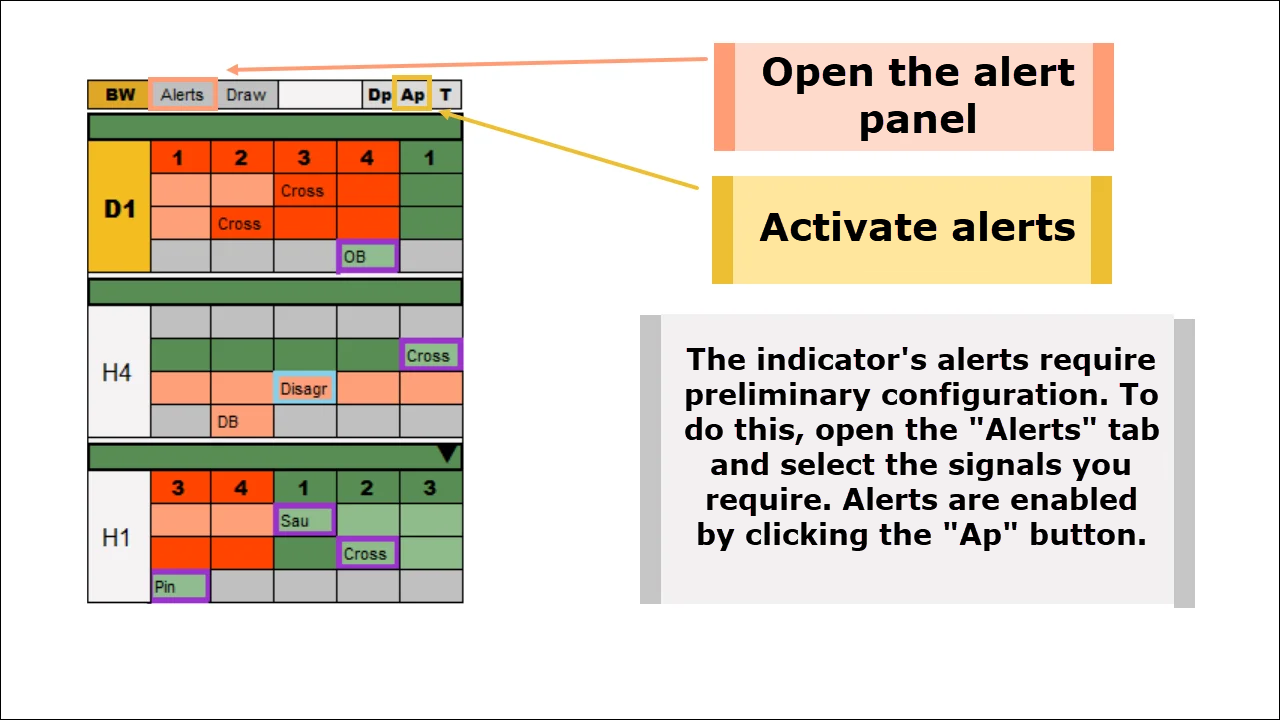
Alert system
The indicator features a highly flexible alert configuration system. You can configure only the system alerts you need. The images below describe the notification configuration logic.
Settings tab
Trending filters

Timeframe filters

Filters by signal type

Fractal alerts
- Fractal signal on 1 bar. The system will alert you about a fractal signal if, after a fractal high or low, there is one closed bar and one current (unclosed) bar on the chart.
- Fractal signal on 2 bars. The system will alert you about a fractal signal if, after a fractal high or low, there are two closed bars and one current (unclosed) bar on the chart.

Alrts by indicator AO
Alerts based on the AC indicator
Alerts for zone signals
Alerts for reversal signals
Multi-version of the indicator
By default, the indicator analyzes 4 timeframes simultaneously. Timeframes are arranged from bottom to top from low to high. The timeframe on which the user is currently located is painted in yellow.
You can change the number of simultaneously analyzed timeframes. The available options are: 1, 2, 3, 4. The “TFNumber” parameter is responsible for this. In the chart below, for example, I left only three timeframes:
Classic timeframes
By default, the indicator analyzes classic timeframes: m1, m5, m15, m30, H1, H4, D1, W1, Mn.
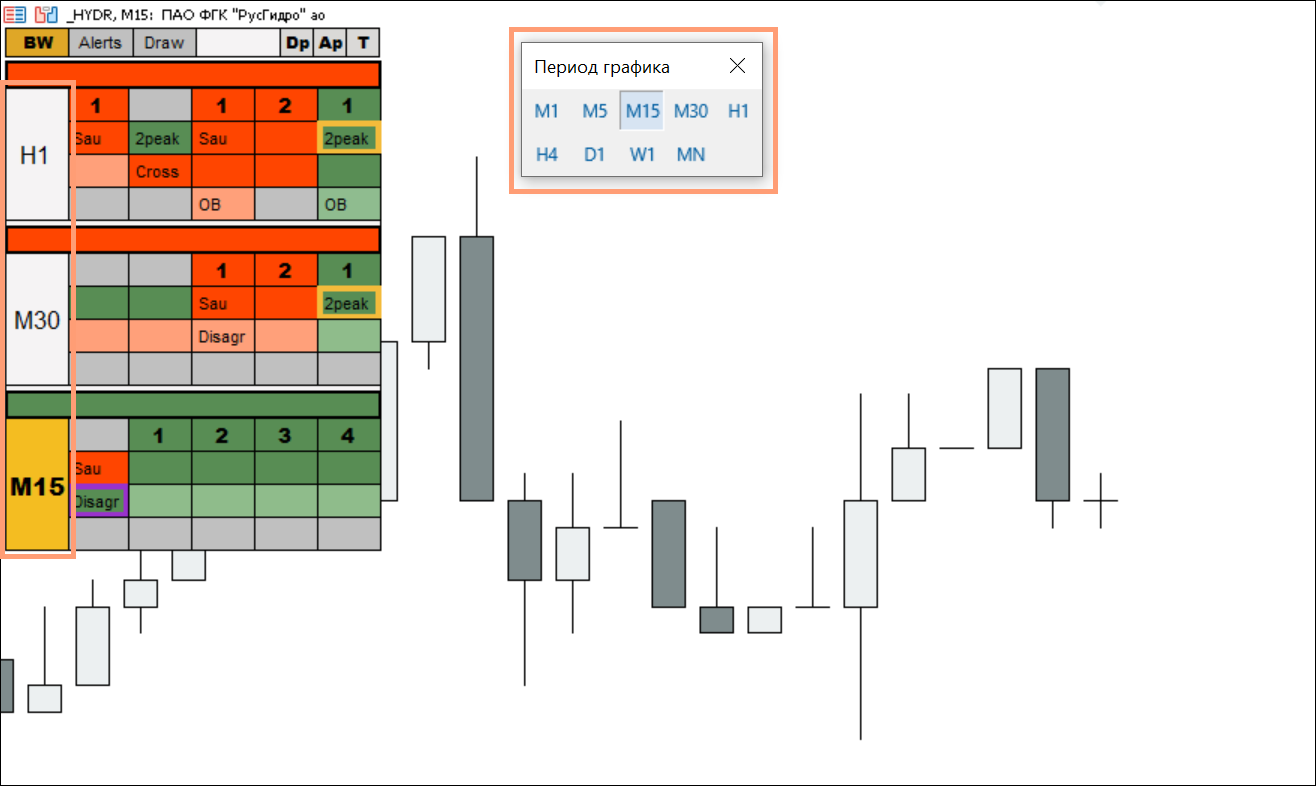
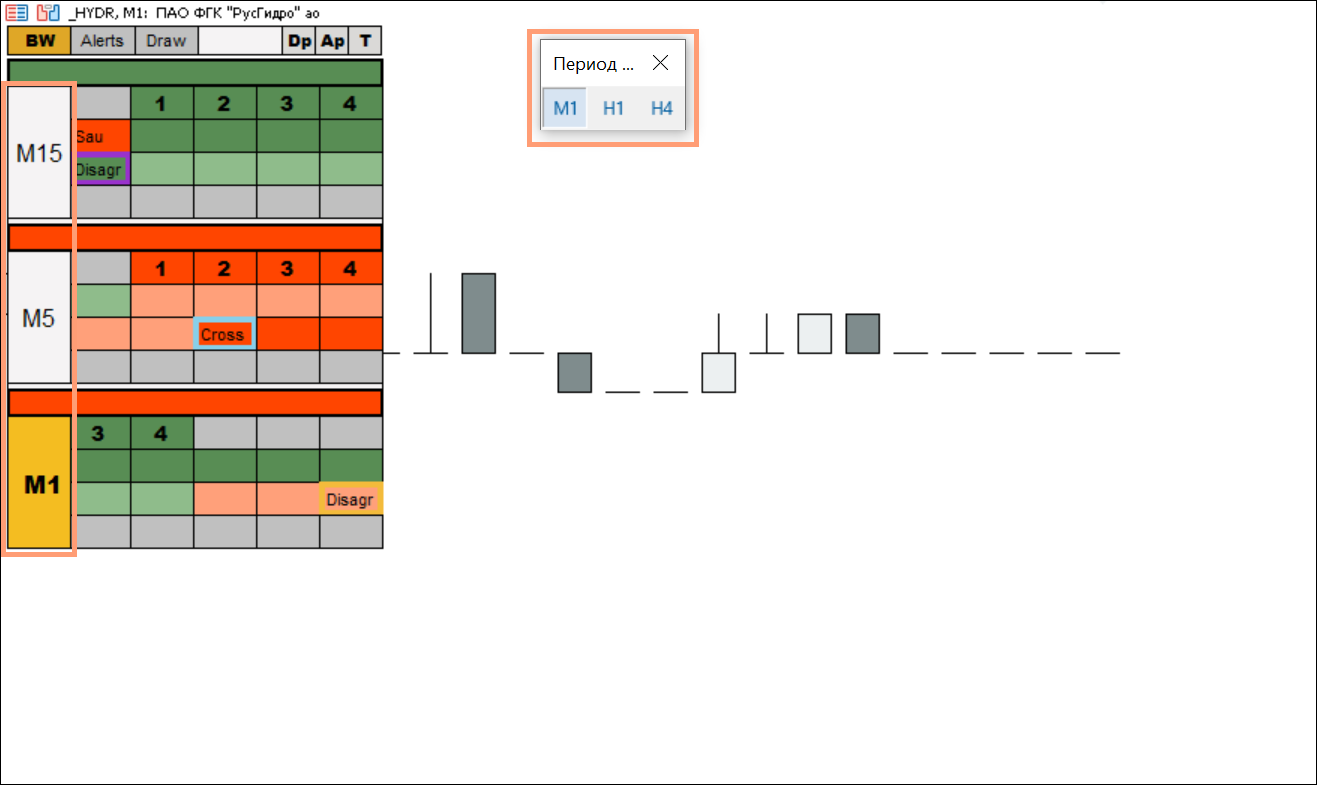
It should be noted that the indicator takes these timeframes not from the trading terminal panel, but from its own list. Accordingly, if you remove some timeframes from the terminal panel and leave, for example, only m1, H1 and H4, then when you are on m1 the indicator will still display timeframes m1 - m5 - m15. See example below:
In the fifth version of Metatrader, in addition to standard timeframes, exotic ones were added, which significantly increased the list of timeframes. To switch to using all existing time frames, change the "classicTF" parameter to "False". In this case, the indicator will display data on the following timeframes: m1, m2, m3, m4, m5, m6, m10, m12, m15, m20, m30, H1, H2, H3, H4, H6, H8, H12, D1, W1 , Mn. See example below:
As in the situation with classic timeframes, the indicator also takes information on all possible timeframes from its own list, and does not adapt to the user’s configured terminal. Therefore, you have two possible options for displaying indicator signals:
- m1, m5, m15, m30, H1, H4, D1, W1, Mn
- m1, m2, m3, m4, m5, m6, m10, m12, m15, m20, m30, H1, H2, H3, H4, H6, H8, H12, D1, W1, Mn
Setting up higher timeframes
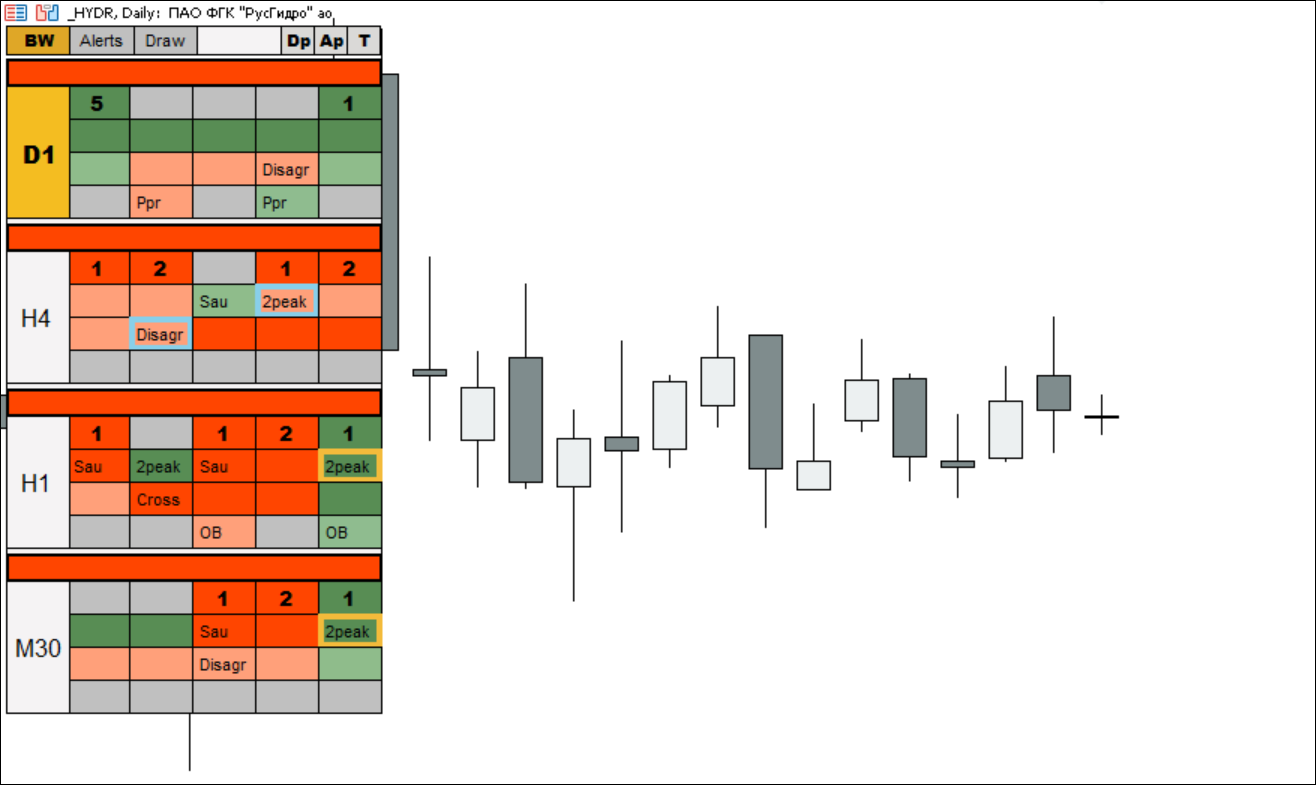
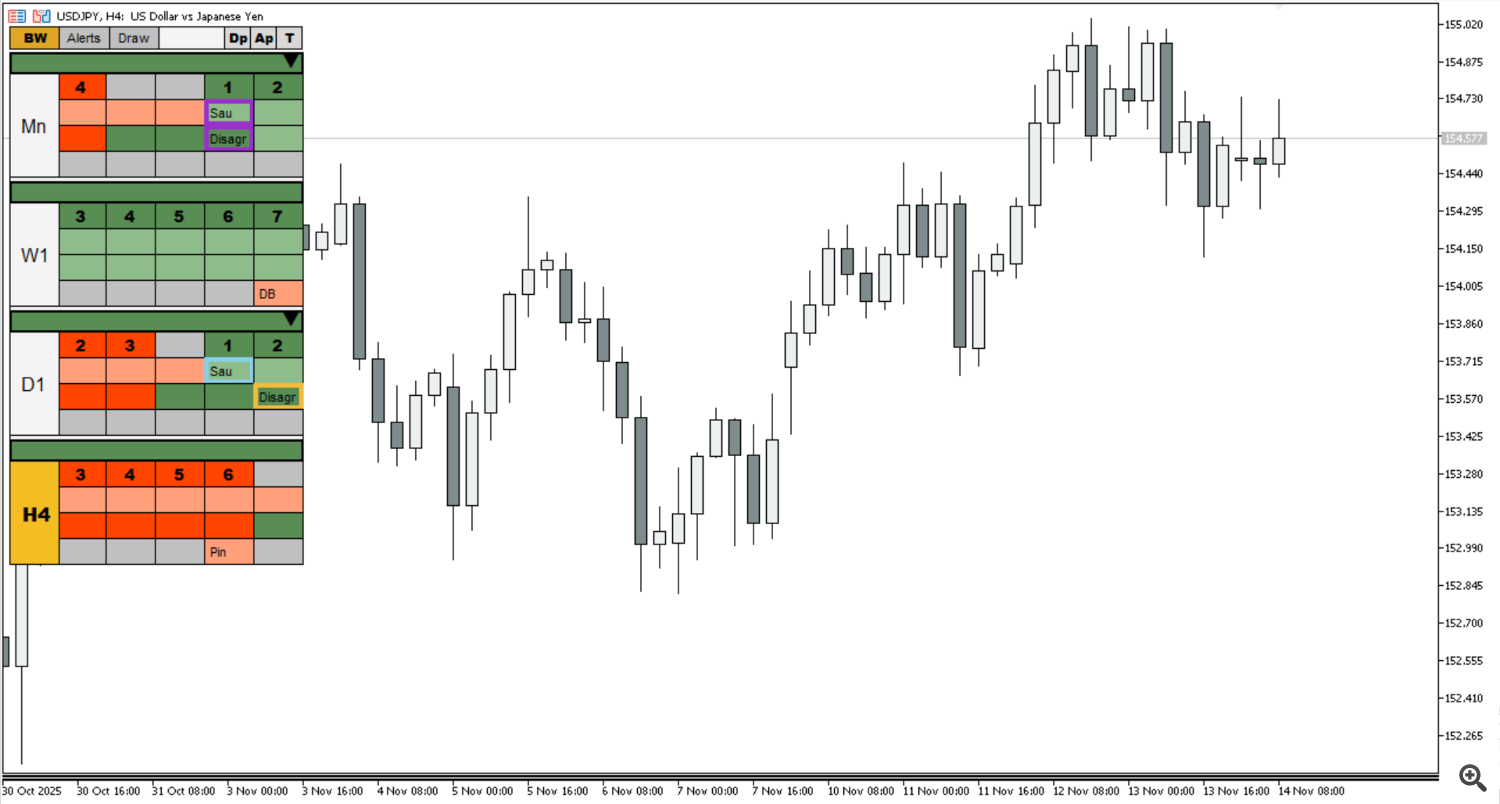
By default, the indicator displays timeframes in ascending order on the panel. For example, when on H4, we'll see the following:
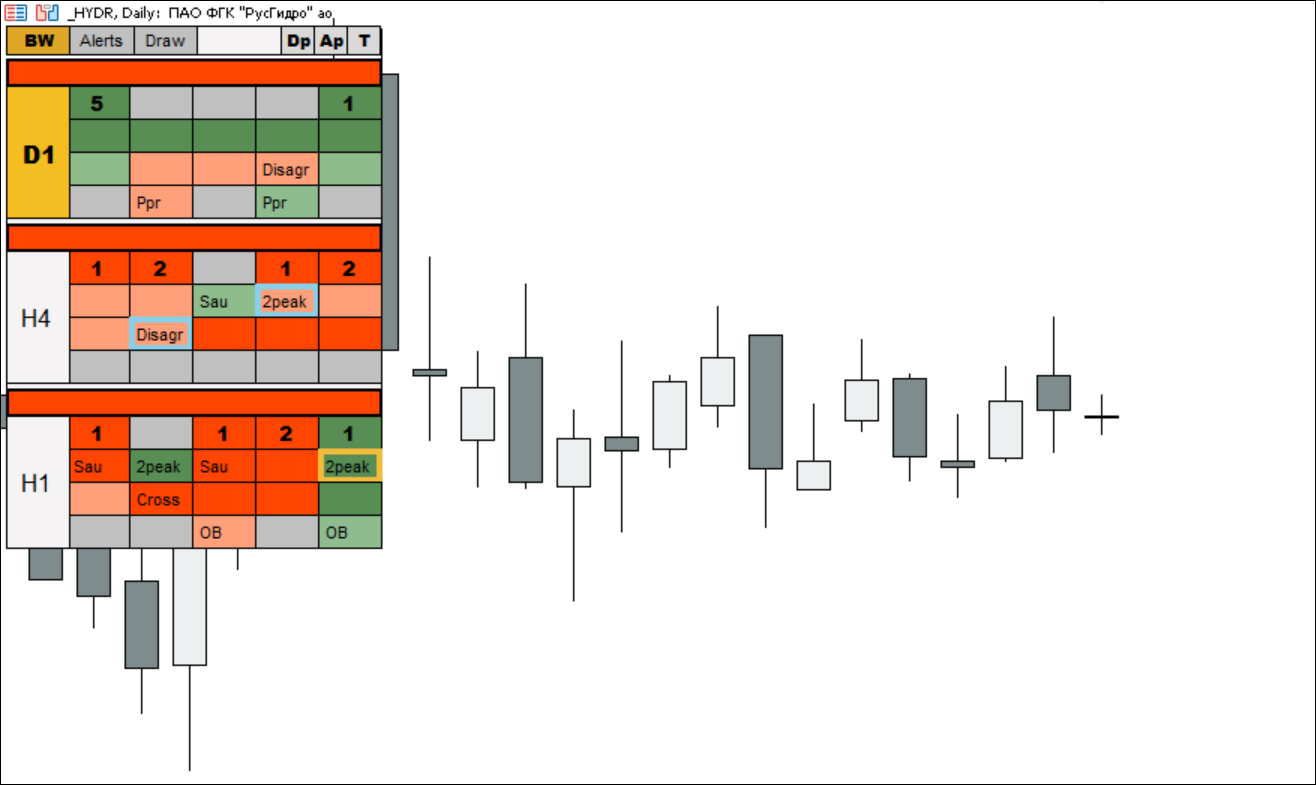
The problem is that signals from, for example, monthly and weekly charts are rarely relevant. And when trading on H4 or D1, it would be much more logical to see signals from the working timeframes on the indicator panel. For example, m30, H1, H4, and D1. Therefore, we added the ability to limit the upper timeframe. In the program's external settings, there is a parameter called HideMonthWeek. When enabled, you can hide either the monthly timeframe or the monthly and weekly timeframes. And regardless of the timeframe you're on, signals on the panel will not be displayed above the daily chart. See the example below:

Hotkey combinations
The main task of the "Bill Williams Advanced" indicator is to simplify the analysis as much as possible and remove all unnecessary things from the chart. For example, when using our indicator, there is practically no need for the AO and AC indicators, because their signals are already copied to the panel at the top of the screen.
But you shouldn’t completely abandon AO and AC. The AO indicator can be useful, for example, to determine the potential for divergence. That is why we have implemented a system in which the AO and AC indicators are not on the chart by default, but they can be displayed/hidden using hotkeys.
- "Shift + E" - Display the AO indicator on the chart
- "Shift + R" - Display the AC indicator on the chart
- "Shift + Q" - Display the AO and AC indicators on the chart
- "Shift + W" - Hide AO and AC indicators
In the picture below you can see how this function works:
After activating the hotkeys for the first time, you can customize the appearance of the AO and AC indicators. After the first setup, all subsequent times they will be displayed already painted in the colors you need.
First loading of the indicator. Quotes
For the multi-timeframe version of the indicator to work correctly, it needs instrument quotes. If you have been analyzing and trading on any instrument for a long time, then there will be no problems. The indicator will immediately install and display all signals.
But if you drag an instrument whose quotes are not available in the trading terminal onto a chart with an indicator, then during the loading process the indicator may display incorrect information. When they are fully loaded, the indicator’s operation returns to normal.
Minimum trading instruments requirements
In order for the indicator to work properly, it needs to have at least 37 bars on the chart of each analyzed time frame. These are the minimum requirements for the AO and AC indicators to operate. If on one of the timeframes there are less than 37 bars, the indicator will not work normally, since it will have nowhere to take data for analysis.This problem can occur in futures contracts, where most of the time the required number of bars on the monthly and weekly charts for the AO and AC indicators are missing.
Screen resolution:
Important! If the indicator panel is not displayed correctly or appears too small on your chart, here's how to resolve this issue.
By default, the indicator is adapted to a screen resolution of 1920 x 1080. With the "Scale and Layout" display setting set to 100%, all indicator elements will be displayed correctly.
If you have a wide monitor or a monitor with a very high screen resolution, the indicator may not display correctly on the chart.
In the example below, the indicator is loaded on a monitor with a display resolution of 3440 x 1440 and a "Scale and Layout" setting of 150%. As you can see, the indicator is displayed incorrectly and requires additional adjustments.

To ensure the indicator displays correctly, go to the program's external settings and find the "Zoom" parameter. By default, it's set to 1. As noted above, the "Scale and Layout" parameter in the example above is 150%. This is one and a half times higher than the default 100%.
This means we also need to multiply the "Zoom" parameter by 1.5. We enter 1.5 next to the "Zoom" parameter and get the following image:

External parameters:
- coordX - the panel's position along the X axis
- coordY - the panel's position along the Y axis
- Zoom - a parameter used to adapt the panel to non-standard monitors
- fontSizeZones - the font size for zone numbers
- fontSizeMainText - the font size for timeframes and divergence signals
- fontSizeText - the font size for AO, AC, and reversal pattern signals
- fontSizeAlertBtnText - the font size for buttons in the "Alerts" and "Draw" tabs
- fontSizeAlertMainText - the size of subheadings in the "Alerts" and "Draw" tabs
- classicTF - select between classic timeframes (m1, m5, m15, m30, H1, H4, D1, W1, Mn, and all possible timeframes)
- TFNumber - the number of timeframes the indicator analyzes
- HideMonthWeek - the ability to hide monthly and weekly charts
- colorFonMainTab - the background color Indicator tables
- HeadColor - Indicator header background color
- Tracing - Panel border color
- FontAOACColor - AO and AC signal font color
- FontAOACType - AO and AC signal font type
- FontZonesColor - Zone font color
- FontZonesType - Zone font type
- FontTFtype - Timeframe font type
- ZoneUPcolor - Upward zone color
- ZoneDownColor - Downward zone color
- NoZoneColor - No zone color
- LongLessThanZero - Color of ascending AO and AC bars below the zero line
- LongAboveThanZero - Color of ascending AO and AC bars above the zero line
- ShortLessThanZero - Color of descending AO and AC bars below the zero line
- shortAboveThanZero - Color of descending AO and AC bars above the zero line
- ApprovedSignalcolor - Border color of the confirmed signal cell signal
- SpecialBlueLight - the color of the Special Blue Light signal cell
- ActualAignalColor - the border color of the current signal
- ThiknessAS - the border thickness of the cell with the signal
- TrendBckgThikness - the border thickness of the rectangle with the trend
- TrendPrice - the Alligator trend detection method. Current - based on the current price, Close - based on the last closed candle
- UpTrendColor - Rectangle color for an uptrend
- DownTrendColor - Rectangle color for a downtrend
- SendPush - enable sending push notifications
- SignalColorUp - display color for buy signals based on AO and AC on the chart
- SignalColorDown - display color for sell signals based on AO and AC on the chart
- SignalZoneFontType - font type for zone numbers on the price chart
- OB_Choice - determine confirmation of an outside bar by overlapping the closing price or the high or low
- PinFractional - determine the position of the pin bar candle body relative to the entire candle
- PAColor - color of Price Action signals and divergence bars on the price chart
- AngAlligatorLine2 - Alligator line used to determine angulation
- CountOutsideBars - number of bars after the Alligator line is broken, after which the search begins divergent bar
- ClosePriceHalfThird - at what part of the candlestick do we determine the close of the divergent bar
- More BelowHorizon - whether to use only sharp angulation angles
- Lable Location - the position of the timer relative to the chart angles
- Font Size - the timer font size
- FontType - the timer font type
- Color - the timer font color
- MainLineColorUpAO - the color of the main upward divergence line on AO
- MainLineColorDownAO - the color of the main downward divergence line on AO
- MainLineThicknessAO - the thickness of the main divergence line on AO
- MainLineTypeAO - the type of the main divergence line on AO
- OldLineColorUpAO - the color of the minor upward divergence line on AO
- OldLineColorDownAO - the color of the minor downward divergence line on AO
- OldLineThicknessAO - the thickness of the minor divergence line on AO
- OldLineTypeAO - the type Minor divergence lines on AO
- MainLinePrice - Whether or not to display divergence on the chart
- MainLineColorPriceUp - Color of the upward divergence line on the chart
- MainLineColorPriceDown - Color of the downward divergence line on the chart
- MainLineTypePrice - Type of divergence line on the chart
- UPColorPanelDiver - Color of the upward divergence signal on the indicator panel
- DownColorPanelDiver - Color of the downward divergence signal on the indicator panel
- TypeSymbolpanelDiver - Divergence signal type
- CircleActivate - Enable or disable symbols for identifying highs or lows
- CircleColorUp - Color of symbols for identifying highs or lows for upward divergence
- CircleColorDown - Color of symbols for identifying highs or lows for downward divergence
- CircleSize - Size of the symbol for identifying divergence
- ShowLastFractal - The default number of bars to display the last Fractals
- ColorFractalHigh - Up fractal color
- ColorFractalLow - Down fractal color
- FractalIconSize - Fractal icon size
- FractalIconUp - Up fractal icon type
- FractalIconDown - Down fractal icon type
- Alligator - The basic parameters of the Alligator indicator have been transferred here
Author: Siarhei Vashchylka. For any questions, write to me in private messages. I also recommend subscribing to my updates. To do this, follow the link to my profile and click "Add to friends".


")
