From humble beginnings as a simple profit tracker to today's comprehensive trading analytics platform, PnL Calendar has evolved into an indispensable tool for serious MetaTrader traders. Version 2.0 represents not just an update, but a complete transformation that addresses every aspect of modern trading management.
Table of Contents
- The Journey: From Basic Tracking to Professional Analytics
- The Complete PnL Calendar Suite
- Enhanced P&L Calendar Panel - The Foundation
- Redesigned Account Information Panel
- Revolutionary Risk Analysis Dashboard
- Advanced Symbols Panel
- Comprehensive Open Trades Management
- Multi-Broker Export Feature
- Professional Export and Analysis Tools
- Technical Excellence and Platform Integration
- Complete Trading Workflow Integration
- Multi-Timeframe Analysis Capabilities
- Risk Management Philosophy Integration
- Practical Value Across Trading Levels
- The Evolution Continues ...
- Product Links
- P&L Calendar - User Guide
- Customize Main Panel
- Panel - Profit & Loss Calendar
- Panel - Account Information
- Panel - Risk Analysis Dashboard
- Panel - Symbols (to trade)
- Panel - Open Trades
- Button - Download History
- Button - View Closed Trades
- Styling and Formatting
- Disclaimer
- Addendum
| The Journey: From Basic Tracking to Professional Analytics |
Trading success has always required more than luck and intuition. The original PnL Calendar addressed traders' fundamental need to understand their performance patterns through calendar-based profit tracking. But as markets became more complex and retail trading more sophisticated, the demands grew beyond simple historical analysis.
Version 2.0 answers this evolution with a complete trading ecosystem that seamlessly integrates traditional performance tracking, real-time risk assessment, comprehensive trade management, and advanced analytics into one cohesive platform.
| The Complete PnL Calendar Suite |
| Enhanced P&L Calendar Panel - The Foundation |
| | The heart of PnL Calendar remains its signature calendar view, now enhanced with improved performance and flexible analysis options: |
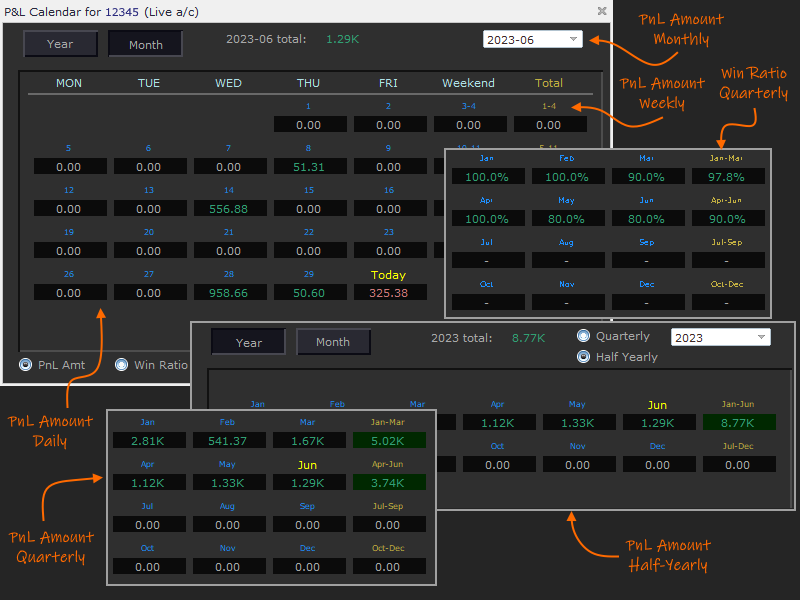
Dual Analysis Modes: Choose between P&L Amount tracking (traditional profit/loss values) or Win Ratio analysis (percentage-based success metrics) using intuitive radio button selection. This flexibility allows you to focus on either monetary performance or trading accuracy depending on your analysis needs.
Monthly Deep Dive: Select any month from your trading history to see day-wise and week-wise breakdowns. The calendar displays individual daily results while providing weekly totals and overall monthly performance. Current trading day shows as "Today" with real-time updates.
Annual Overview: Switch to yearly view for comprehensive quarterly and semi-annual analysis. Track seasonal patterns, identify peak performance periods, and understand long-term trends across your entire trading history.
| Redesigned Account Information Panel |
| | The Account Information panel showcases a modern, professional interface with enhanced visual hierarchy and intelligent alerts: |

Core Account Metrics:
- Balance: Current account balance with trend indicators
- Equity: Real-time equity including unrealized P&L from open positions
- Margin: Used margin with customizable threshold warnings and percentage-based color coding
Comprehensive P&L Summary: Track performance across multiple timeframes:
- Year-to-Date: Complete annual performance tracking
- Monthly: Current month progress with comparison to previous periods
- Weekly: Seven-day rolling performance analysis
- Complete trade history: Performance since the opening of the account (account trade history)
- Today: Current day results with start-of-day equity calculations
Start-of-Day Equity Integration: New in version 2.0, the system now calculates estimated start-of-day equity positions, accounting for overnight gaps, swap charges, and position rollovers. This ensures accurate daily P&L calculations that reflect true trading performance rather than market gaps.
Smart Risk Alerts: Margin usage displays in different colors based on customizable threshold percentages of account balance, providing early warning of potential margin issues.
| Revolutionary Risk Analysis Dashboard |
| | The centerpiece of version 2.0 introduces high-grade risk management to retail trading: |
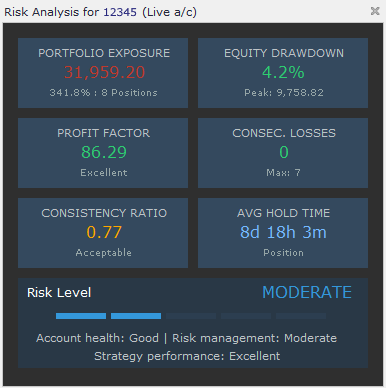
Six Professional Risk Metrics:
- Portfolio Exposure: Monitors total position value relative to account balance, calculating true leverage exposure across all open positions with multi-currency conversion.
- Equity Drawdown: Tracks current and maximum historical drawdown from equity peaks, providing crucial early warning for risk management adjustments.
- Profit Factor: Analyzes the mathematical relationship between gross profits and gross losses, evaluating fundamental strategy profitability.
- Consecutive Losses: Monitors current losing streaks with historical context, helping identify when strategy breaks might be necessary.
- Consistency Ratio: Measures trade-to-trade reliability, distinguishing between consistent performers and strategies dependent on occasional large wins.
- Holding Time Analysis: Automatically categorizes your trading style (Scalping, Intraday, Day Trading, Swing, Position) based on average position holding times.
Intelligent Risk Scoring: All metrics combine into a weighted risk score (0-100) with visual five-bar indicator showing Low, Moderate, High, Very High, or Critical risk levels.
Professional Color Coding: Emerald green (excellent) through light blue (good), orange (warning), muted red (danger), to dark red (critical) provides instant visual risk assessment.
![]()
| Advanced Symbols Panel |
| | The Symbols panel provides comprehensive symbol-based analysis and management: |
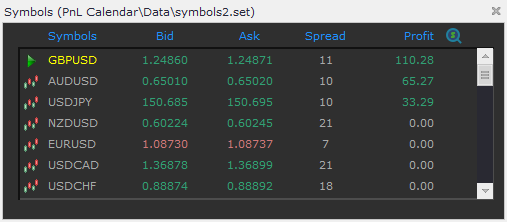
Real-Time Profit Breakdown: See running profits/losses categorized by individual symbols, helping identify which instruments are contributing to or detracting from overall performance.
Preferred Symbols Management: Save and load custom symbol sets for quick access to your most-traded instruments. The system highlights your current chart symbol and allows one-click symbol switching.
Performance Analytics: Each symbol shows not just current P&L but also includes historical performance data and contribution to overall account performance.
Smart Symbol Navigation: Click any symbol to instantly switch your chart to that instrument, streamlining multi-symbol analysis and trading workflows.
| Comprehensive Open Trades Management |
| | The Open Trades panel transforms position monitoring from basic information display to active trade management: |

Detailed Position Analysis:
- Symbol-Based Organization: View all open positions organized by symbol, with summary statistics for each instrument
- Individual Trade Details: Complete information for each position including entry price, current P&L, swap charges, and distance from current market price
- Portfolio Overview: Select "All" to see complete portfolio summary across all open positions
Advanced Chart Integration:
- Visual Trade Lines: Display open price, stop loss, and take profit levels directly on charts with customizable line styles and colors
- Average Price Indicators: Show average entry prices for multiple positions in the same instrument
- Background Shading Options: Choose from horizontal lines, lines from entry time, or full background shading for position visualization
Real-Time Updates: All position information updates continuously, showing current profit/loss, point distance from entry, and market impact of price movements.
Smart Position Grouping: When holding both buy and sell positions in the same instrument, the system shows separate average prices for long and short positions plus overall portfolio breakeven.
| Multi-Broker Export Feature |
The Multi-Broker Export feature, released with v2.1, elevates PnL Calendar into a complete portfolio management solution by automatically exporting account data to CSV files that Portfolio Aggregator reads in real time. Once enabled, PnL Calendar continuously writes your key metrics—equity, balance, margin, daily P&L, and risk levels—into a shared folder accessible by all MetaTrader terminals on your computer.
How It Works:

Enable Multi-Broker Export in PnL Calendar settings for each trading account you want to monitor. Each instance creates a unique CSV file (Broker_[AccountNumber].csv) in the shared Terminal\Common\Files\MultiBroker folder.
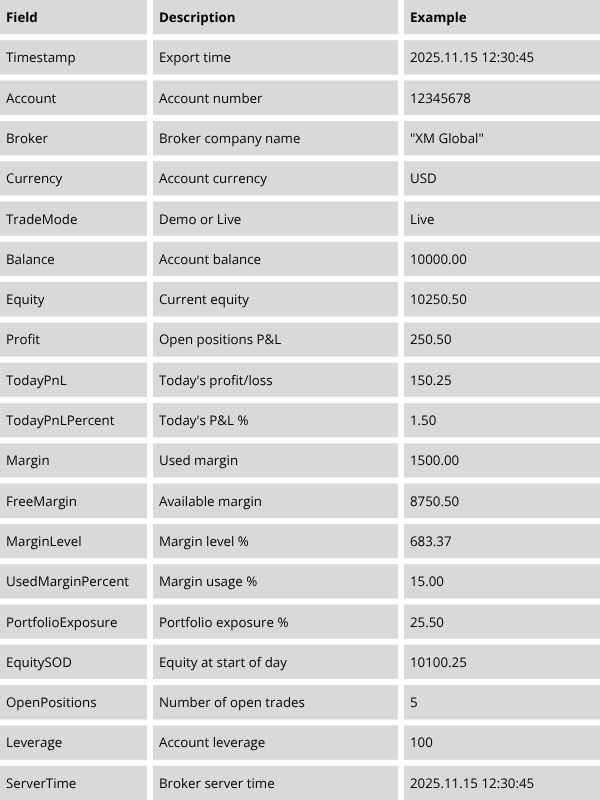
Portfolio Aggregator then reads all files from this folder and displays your complete portfolio—total equity, combined P&L, aggregate risk metrics, and individual account breakdowns—in a single, easy-to-read dashboard.
Performance Note: For optimal stability, PnL Calendar should be enabled on only one chart per trading account. Multiple instances will result in repeated file writes, which can affect performance and reliability. MT4 users also need to consider the Performance Note for MQL4 Users when installing Portfolio Aggregator indicator on the same chart.
Whether you’re balancing demo and live accounts, diversifying across brokers, or running distributed strategies, Multi-Broker Export delivers effortless, real-time portfolio consolidation with professional-grade accuracy.
| Professional Export and Analysis Tools |
![]()
![]()
Incremental History Downloads: Export trading history to delimited text files with intelligent incremental processing. The system tracks previously downloaded trades and adds only new positions, ensuring complete records even when MetaTrader archives old data.
Flexible File Formats: Choose from comma, exclamation, or pipe delimiters for seamless import into Excel, databases, or custom analysis tools. Each export includes comprehensive trade details: Market Maker, Ticket Number, Open/Close times, Trade Type, Symbol, Lot Size, Entry/Exit Prices, Points, Profit/Loss, Swap Fees, Net Profit, and Magic Numbers.
Chart-Based Trade Review: Display closed trades directly on charts with detailed tooltips showing complete trade information. Customize line styles, colors, and thickness for different visualization preferences.
| Technical Excellence and Platform Integration |
Cross-Platform Compatibility: Identical functionality across MQL4 and MQL5 with platform-specific optimizations for maximum performance.
Memory Optimization: Enhanced memory management with intelligent caching reduces resource usage while improving response times for large trading histories.
Native MetaTrader Integration: Leverages built-in panel functionality for familiar drag-and-drop positioning, minimizing, and window management.
| Complete Trading Workflow Integration |
PnL Calendar 2.0 supports every aspect of professional trading workflows:
Pre-Market Analysis: Review overnight risk changes, check equity positioning, and assess portfolio exposure before market open.
Active Trading Support: Real-time risk monitoring, position tracking, and instant symbol switching during active trading sessions.
Post-Market Review: Comprehensive performance analysis using calendar views, risk metrics, and export capabilities for detailed trade journaling.
Strategic Planning: Long-term pattern recognition through historical analysis, risk trend identification, and strategy optimization based on comprehensive performance data.
| Multi-Timeframe Analysis Capabilities |
The platform excels at multi-timeframe analysis:
Intraday: Real-time position monitoring, immediate risk alerts, and active trade management
Daily: Start-of-day equity calculations, daily P&L tracking, and risk metric updates
Weekly: Seven-day rolling analysis, week-over-week comparisons, and weekly risk assessments
Monthly: Calendar-based monthly reviews, monthly risk trends, and performance benchmarking
Quarterly/Annual: Long-term pattern recognition, seasonal analysis, and strategic performance evaluation
| Risk Management Philosophy Integration |
Version 2.0 embodies a holistic risk management approach where traditional performance tracking integrates seamlessly with modern risk analytics. The system recognizes that effective risk management requires understanding not just what happened, but why it happened and what it means for future trading decisions.
The platform provides both reactive capabilities (alerting to current problems) and proactive development (building disciplined risk awareness through consistent monitoring and analysis).
| Practical Value Across Trading Levels |
Beginner Traders: Learn professional risk management principles through clear visual feedback while building systematic trading habits with comprehensive trade tracking.
Intermediate Traders: Develop advanced strategy analysis capabilities using profit factor analysis, consistency measurements, and comprehensive export tools for external analysis.
Advanced Traders: Access institutional-grade analytics including sophisticated risk scoring, multi-timeframe analysis, and comprehensive portfolio risk assessment.
Professional Managers: Utilize complete audit trails, risk documentation, and comprehensive reporting capabilities for client reporting and regulatory compliance.
The Evolution Continues ...
PnL Calendar 2.0 represents a significant milestone in retail trading analytics evolution. By maintaining the intuitive interface and reliable functionality while adding sophisticated risk management and analysis capabilities, it bridges the gap between basic trade tracking and professional portfolio management.
The platform transforms routine trade monitoring into strategic decision-making support, helping traders understand not just their historical performance but their current risk positioning and future improvement opportunities.
Product Links:
- Understanding Risk Metrics in PnL Calendar 2.0 | A Professional Trader's Guide |
- MT5 Product Page | MT4 Product Page
| P&L Calendar - User Guide |
This section details the functionalities and is also a guide on how to configure the indicator.
| Customize the Main Panel on startup |
You can select the Panel to be shown on startup. Accordingly, the other will be considered as a sub-panel.
![]()
P&L calendar makes use of the MetaTrader's pre-installed functions of Panels. The main panel can be minimized whenever you need to hide the display of both panels.
The sub-panel can be dragged with the mouse independent to the main panel, but when the main panel is moved, the sub-panel moves along with it on the chart. The close button on the sub-panel will close it, while the close of the main panel will remove the expert advisor from the chart. As the sub-panel is tied to the main panel, it will also close. You need to insert/re-drag the expert advisor back to the chart.
If P&L Calendar is the Main panel, you can click on ![]() to open the Account Information panel and click on
to open the Account Information panel and click on ![]() to close it.
to close it.
If Account Information is the Main panel then click on ![]() to open the P&L Calendar panel and click on
to open the P&L Calendar panel and click on ![]() to close it.
to close it.
| Panel - Profit & Loss Calendar |
P&L Calendar accesses the closed trades from your Account History and displays them as a monthly or yearly (per quarter or half yearly) calendar.
Month view of your profits
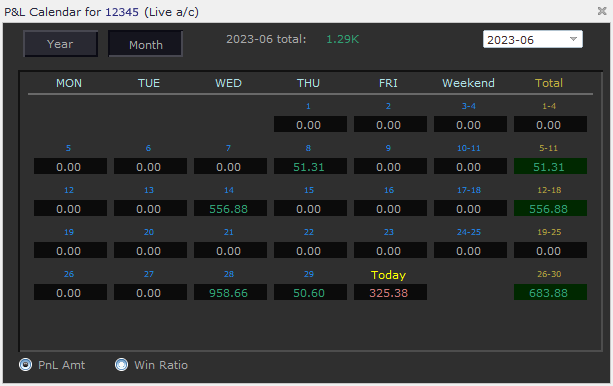
Clicking on the 'Month' button displays the day-wise and week-wise totals of your closed trades for the month selected from the combo list ![]() The month total is also displayed. The current date totals are displayed as 'Today'.
The month total is also displayed. The current date totals are displayed as 'Today'.
The list of months shown in the combo starts from the earliest month retrieved from the account history to the current month.
NOTE: P&L Calendar EA will only display trades as shown in the Account History tab. To show all trades from history, you need to choose "All History" on right clicking on the tab.

Year view of your profits
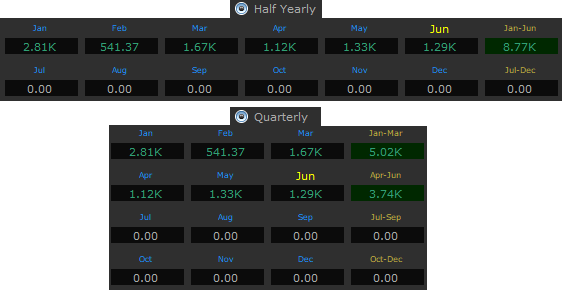
Clicking on the 'Year' button will allow you to choose ![]() for the selected year from the combo list. The list of years are as retrieved from the account history of closed trades.
for the selected year from the combo list. The list of years are as retrieved from the account history of closed trades.
The month, half yearly, quarterly and year totals are also shown in the panel.
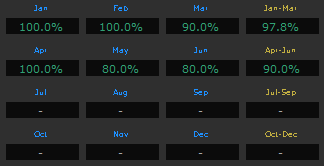
The panel also provides radio buttons ![]() to select if the P&L amount or the Win Ratio details needs to be displayed. Below is the example of how the quarterly Win Ratio is displayed.
to select if the P&L amount or the Win Ratio details needs to be displayed. Below is the example of how the quarterly Win Ratio is displayed.
| Panel - Account Information |
The Account Information panel highlights the current status of your open positions to take timely action. The buttons shown for the Account Information panel will differ based on the selection of Main Panel on startup.
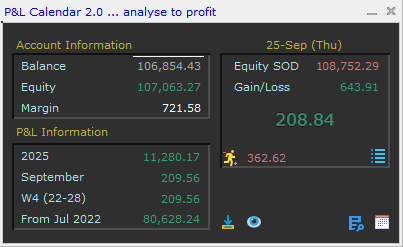
It shows the Account Balance, the Equity balance and the Margin of the open positions. The panel also shows the P&L real-time summary for Year, month, week and the current date. Also shown is the P&L since the earliest date in history.
Today's information shows the running account profit or loss, inclusive of the profit or loss for today's closed trades. The amount with ![]() icon shows the current running profit or loss.
icon shows the current running profit or loss.
With version 2.0, the system now calculates estimated start-of-day equity positions, accounting for overnight gaps, swap charges, and position rollovers shown as the "Equity SOD". The Gain/Loss amount is the current day's realized and unrealized P&L.
The Margin formatting can be customized by choosing the below options:

The colour for the Margin value will change once the defined threshold percentage of Account Balance is exceeded.
| Panel - Risk Analysis Dashboard |
The Risk Analysis Dashboard can be access by clicking the ![]() button on the Account Information Panel and
button on the Account Information Panel and ![]() to hide.
to hide.
Version 2.0 embodies a holistic approach of six profession risk metrics for risk management. Rather than focusing on individual metrics in isolation, the system emphasizes how various risk factors interact. High leverage combined with excellent profit factor and disciplined risk management may represent calculated strategy, while the same leverage with poor metrics signals serious danger.
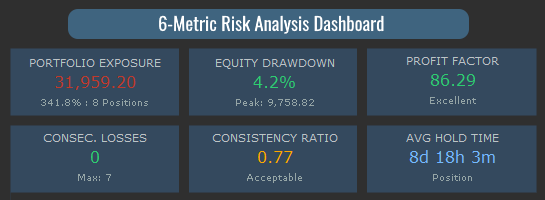
The dashboard provides both reactive and proactive risk management capabilities—alerting you to current concerns while helping you develop the discipline and awareness needed to prevent future problems.
Beyond individual metrics, the dashboard synthesizes all risk factors into a comprehensive risk assessment displayed through an elegant five-bar indicator and overall risk classification.

The five-bar visualization provides an immediate sense of your overall risk level, while the accompanying risk classification clearly states whether you're in Low, Moderate, High, Very High, or Critical risk territory. This overall assessment helps you understand when individual risk factors combine to create elevated account-level risk that might not be apparent from viewing metrics in isolation.
At the bottom of the dashboard, a concise two-line risk summary provides executive-level insight into your trading performance. The first line combines account health and risk management assessments, while the second line evaluates your strategy's performance. This summary distills complex risk analysis into actionable insights, telling you whether your account is healthy, your risk management is effective, and your strategy is performing well.
The dashboard updates in real-time as market conditions change and new trades are executed, ensuring you always have current risk assessment information. This continuous monitoring capability transforms risk management from a periodic exercise into an integral part of your daily trading routine.
I’ve created a companion Risk Analysis Metrics Guide that expands each concept into actionable insight. It provides complete transparency into how each metric is calculated and what the results mean for your trading decisions. Happy to share it — just message me.
| Panel - Symbols (to trade) |
The Symbols Panel displays a breakup of running profit for the symbols traded. The indicator shows the panel by clicking the ![]() button on the Account Information Panel and
button on the Account Information Panel and ![]() to hide.
to hide.
The Symbols Panel also allows a view of to your preferred symbols stored in a (set) file. The name of the file can be entered in the following input parameter.
![]()
The file is similar to the symbols set created from Market Watch. To know more on how to create the file, you can refer to the addendum section at the end of this user guide.
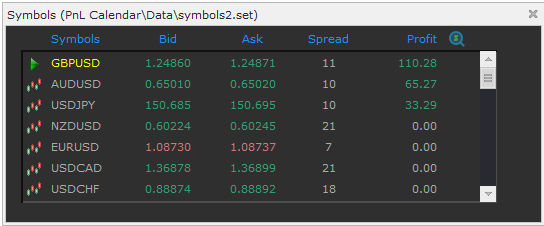
The ![]() icon highlights the current symbol of the chart. On clicking on
icon highlights the current symbol of the chart. On clicking on ![]() button, the current chart will change to a selected symbol.
button, the current chart will change to a selected symbol.
NOTE: The Symbols Panel button is shown only if "Account Information" is the default Main Panel on startup (input parameters).
You may click on ![]() to get detailed information on individual trades for symbols having open positions.
to get detailed information on individual trades for symbols having open positions.
| Panel - Open Trades |
Detailed information for the open positions can be viewed on the Open Trades panel by clicking ![]() icon on the Symbols Panel and
icon on the Symbols Panel and ![]() to hide it.
to hide it.
There are three sections on the Open Trades Panel. On the left, the list of symbols with open positions are shown. In addition to individual symbols, you may choose 'All' to show open positions for all symbols.
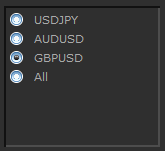
The selection of a symbol can be done by clicking the radio button. Accordingly, the detailed information of open positions for selected symbol will be shown on the right. In case of 'All', open positions for all symbols will be displayed. Along with the details of the trade, the current profit and points (distance) from the Bid/Ask price for each trade is shown.

Clicking on the checkbox on the right, will display the Open Price, Stop Loss and Take Profit price on the chart as below. Please note that the checkbox is shown only if the trade is for current chart symbol.

The indicator allows the configuration of the lines shown on the chart as below:

The available options for displaying the open trade lines on chart are:
- As Horizontal Lines » These are similar to the default lines shown by Metatrader wherein the lines extended on the left of the chart.
- Lines from open time » The lines will be drawn from the time when the trade was opened till the extreme right of the chart.
- Lines from open with background » In addition to the lines drawn from the trade open, a background with a specified transparency (opacity) will be displayed.
The specified transparency applies to the option of displaying a background to the profit and loss section of the trade.
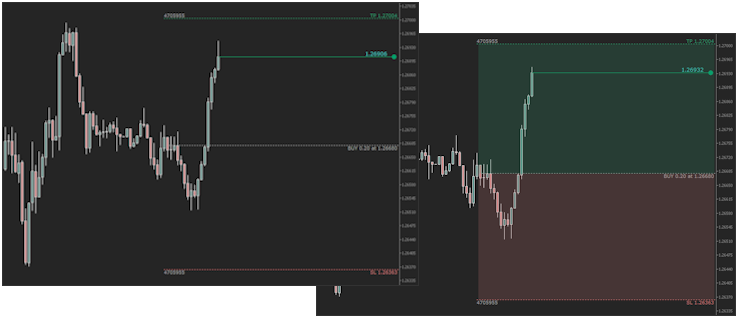
The bottom section on left of Open Trades panel shows Profit, the swap fees (if any) and totals for Buy and Sell positions for the selected symbol. Also shown is the volume (lot size) for each trade type and its total.

On the bottom right of the panel, the Breakeven price, Average Price for Buy and/or Sell for the open positions is shown.

Clicking on the checkbox will display the selected horizontal lines on the chart. Please note that the checkbox is only shown if the trade is for current chart symbol.

The line displays the distance in points from Bid price along with the average price. Closing the Open Trades panel or minimizing the Account Information Panel will not hide the line from the chart. To hide (erase) the average price, you may click on the ![]() icon.
icon.
In case there are both, Buy and Sell positions for a symbol, along with the breakeven price for all trades, the Panel will show Average Buy price for 'Buy trades' and the Average Sell price for 'Sell trades'.
| Button - Download History |
Clicking on ![]() button, download the trades closed post the previous download. The details of the download are highlighted in a Message Box confirming the download. Any error will be displayed as an Alert.
button, download the trades closed post the previous download. The details of the download are highlighted in a Message Box confirming the download. Any error will be displayed as an Alert.
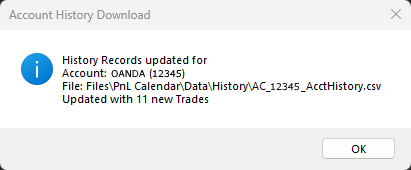
As the downloads are incremental the EA will check whether the trade is already existing in the download file and add it if missing. This will ensure that the trade exists in the file even if the Market Maker has archived it.
The EA allows you to the choose the delimiter used to separate the fields in the text file. The available options are as below:

NOTE: Please do not change the delimiter once decided, as incremental downloads may encounter issues. Do take regular backups of the downloaded file.
The following are the details of a row in the text file:
| Content | Name | Description |
|---|---|---|
| | Market Maker | Company where the Account has been opened |
| | Ticket No. | Ticket number for the trade |
| | Open Time | Time when trade was opened |
| | Trade Type | Type of Trade |
| | Symbol | Symbol for the trade |
| | Lot size | The Lot size |
| | Open Price | Price at which trade was opened |
| | Close Price | Price at which trade was closed |
| | Close Time | Time when trade was closed |
| | Points | Total points between close and open price |
| | Profit | Profit or Loss for the trade |
| | Swap Fees | Any commission, swap fees charged by Market Maker |
| | Net Profit | Net Profit or Loss for the trade |
| | Magic No. | The Magic number for the trade (in case an EA has been used to open trades) else is 0 |
| Button - View Closed Trades |
Click on ![]() button to view closed trades for symbol on chart and on
button to view closed trades for symbol on chart and on ![]() to hide them. The displayed line is shown from the trade open to close time. A tooltip displays the information for each trade.
to hide them. The displayed line is shown from the trade open to close time. A tooltip displays the information for each trade.
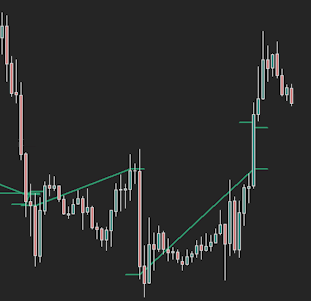

The styling of the line can be configured as below:
![]()
The line style has options as provided by MetaTrader. The Line thickness is defaulted to 1 in case the Line Style value is other than 'Solid'.
| Styling and Formatting |
Below explains on how you can configure the “Font and Color Settings” for the text and grid displayed on the panel
| | Configure the font style and size of text displayed on the panel. |
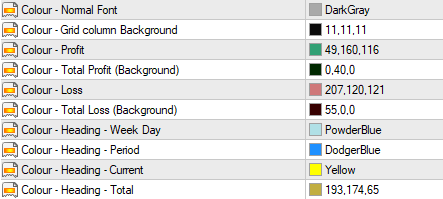 | Configure the colours used for display of text and grid columns on the panel. |
| Disclaimer |
Educational Content: The content in this blog post, including the PnL Calendar indicator guide and risk analysis explanations, is provided for reference and educational use only. It should not be considered financial advice, investment recommendations, or trading signals.
Trading Risks:
- Forex and CFD trading involve substantial risk of loss and may not be suitable for all investors
- Leverage can work against you as well as for you
- Past performance is not indicative of future results
- You may lose more than your initial investment
Risk Management: The risk analysis dashboard is designed to help users understand their trading patterns and risk exposure, but it cannot eliminate trading risks or guarantee profitable outcomes.
Professional Guidance: Users should conduct their own research and seek professional financial guidance before making trading decisions. The indicator and its metrics should supplement, not replace, proper risk management practices.
No Warranties: The indicator is provided "as is" without any warranties or guarantees of accuracy, completeness, or fitness for any particular purpose.
Broker Variations: Results and calculations may vary depending on your broker, trading conditions, and market circumstances.
Regulatory Compliance: Ensure your trading activities comply with local regulations and laws in your jurisdiction.
Liability Limitation: The provider is not responsible for any losses incurred through the use of this indicator or decisions made based on the information provided in this document.
| Users acknowledge that they understand these risks and use the indicator at their own discretion and responsibility. |
| Addendum |
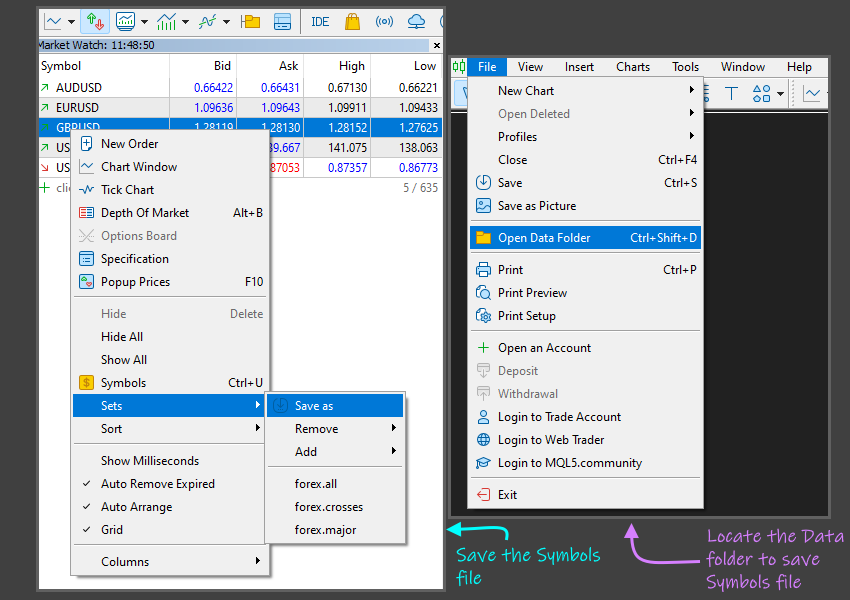
Create symbols.set file
Following are the steps to create the symbols set file.
- Add the desired symbols to the Market Watch
- Right click the mouse on the symbols section to get a popup
- Select the "Sets" and "Save as" option to save the file. You can select the following folder (C:\Users\<<your user directory>>\AppData\Roaming\MetaQuotes\Terminal\<<MetaTrader folder>>\MQL<version>\Files\PnL Calendar\Data)
- Enter the name of the file to the Inputs parameter of this expert advisor.
Installation and Setup
Simple drag-and-drop installation with immediate functionality. All panels are fully customizable and repositionable using standard MetaTrader interface controls. No complex configuration required - begin analyzing your trading performance immediately.

