Portfolio Aggregator is a professional-grade dashboard indicator designed for traders who manage positions across multiple MetaTrader terminals. Instead of juggling windows and manually reconciling data, traders can now monitor all their accounts from a single, unified panel. This tool consolidates real-time portfolio data across unlimited brokers, offering a clear and actionable overview of equity, margin, P&L, and risk metrics — all in one place — with automatic multi-currency conversion
It’s important to note that Portfolio Aggregator is not a standalone solution. It works in tandem with PnL Calendar, which must be installed and running on each broker terminal. PnL Calendar acts as the data engine, exporting account information that Portfolio Aggregator reads and visualizes.
| The Multi-Broker Challenge |
Professional traders often maintain multiple broker accounts for strategic and regulatory reasons. Whether it’s diversifying risk, separating strategies, complying with jurisdictional requirements, or accessing specialized instruments, the result is a fragmented trading environment.
Traditionally, monitoring these accounts involves switching between terminals, manually calculating exposure, and risking oversight of critical metrics like margin levels or floating losses. The problem compounds when accounts are denominated in different currencies — a common scenario that renders simple summation meaningless.
Portfolio Aggregator solves these challenges by offering real-time, consolidated visibility. It intelligently handles multi-currency portfolios, ensuring that every number on the dashboard reflects reality.
| Multi-Currency Portfolio Consolidation |
Traders operating accounts in USD, EUR, SGD, GBP, or any other currency can now view their entire portfolio in a single base currency of their choice. The system begins by detecting the currency of each broker account from the exported data. It then searches for the appropriate currency pair symbol on the terminal — accounting for broker-specific suffixes and custom naming conventions — and queries live exchange rates. All financial values are converted to the base currency, with conversion rates clearly displayed using [FX] indicators.
This process is both intelligent and resilient. If a currency pair symbol isn’t found, the system applies a 1:1 fallback rate and logs a warning. Once the symbol becomes available in Market Watch, conversion activates automatically.
Performance is optimized through caching mechanisms that reduce API calls and minimize CPU usage. Conversion occurs only during data refresh intervals, typically every 1–2 seconds.
The result is a dashboard that reflects true portfolio value, regardless of currency complexity.
| How it Works: The Two-Component System |
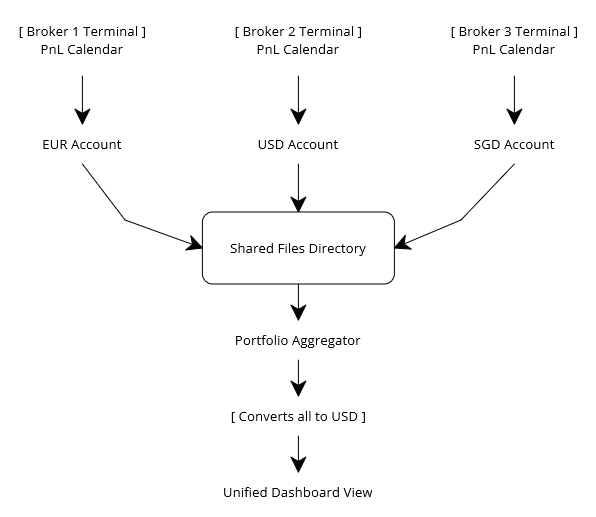
Portfolio Aggregator works in conjunction with PnL Calendar to create a complete portfolio management solution:
Component 1: PnL Calendar (Data Generator)
- Installed on each broker terminal you want to monitor
- Collects account data every second
- Exports to shared CSV files
- Works independently on each MT4/MT5 instance
Component 2: Portfolio Aggregator (Dashboard)
- Installed on one or more charts (any terminal)
- Reads CSV files from all broker accounts
- Converts currencies automatically
- Displays consolidated portfolio view
- Monitors data freshness with visual indicators
Data Flow:

| Portfolio Summary Dashboard |

At the core of Portfolio Aggregator is the Portfolio Summary — a clean, consolidated view of key metrics across all broker accounts. These include:
-
Total equity and balance
-
Unrealized profit/loss and daily P&L
-
Start-of-day equity baseline
-
Margin used and free margin available
-
Number of open positions
-
Count of active brokers
All values are converted to the base currency, ensuring consistency and clarity. The dashboard also displays the timestamp of the latest data update, helping traders verify that the information is current.
This summary provides a reliable snapshot of the portfolio’s health, enabling quick decisions without the need to dig through individual terminals.
| Risk Metrics Section |

Risk management is central to trading, and Portfolio Aggregator offers a dedicated section for portfolio-wide risk assessment. It calculates:
-
Average margin usage percentage
-
Average margin level (equity-to-margin ratio)
-
Average portfolio exposure
-
Overall risk status
-
Highest risk broker
Risk levels are classified into five categories — Excellent, Safe, Warning, Danger, and Critical — each with a corresponding color and icon. These thresholds are fully customizable, allowing traders to tailor the system to their risk tolerance and trading style.
Risk Indicators:
- ✓✓ Excellent – Very safe levels
- ✓ Safe – Comfortable buffer
- ✖ Warning – Attention needed
- ⚠ Danger – Immediate action required
- ⚠⚠ Critical – Margin call imminent
Color Coding:
- Green for safe levels
- Orange for warnings
- Red for danger/critical
This section provides immediate insight into whether the portfolio is balanced or approaching danger, helping traders act before problems escalate.
| Individual Broker Breakdown |

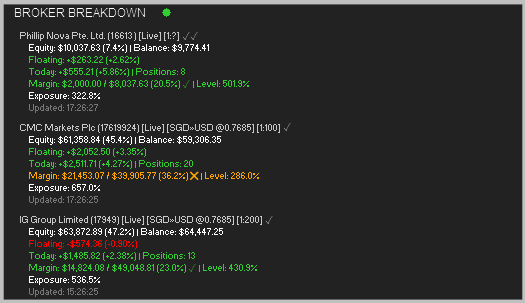
While the summary offers a bird’s-eye view, the Broker Breakdown dives into the details. For each connected account, the dashboard displays:
-
Broker name and account number
-
Currency conversion indicators (if applicable)
-
Trade mode (Live or Demo)
-
Leverage ratio (some brokers may not show the leverage or hide that information - will show as 1:?)
-
Equity and balance (converted to base currency)
-
Floating and daily P&L
-
Margin usage and margin level
-
Portfolio exposure
-
Number of open positions
-
Last update timestamp (Broker server time)
When an account uses a different currency than the base, the original value and conversion rate are shown for transparency. This helps traders understand how each account contributes to the overall portfolio and identify any imbalances or risks.
NOTE:
Visual confirmation that your data is fresh and updating.
How It Works: Green (🟢) or red (🔴) circles appear next to each section header:
- 🟢 Green: All broker data updated within last 5 refresh cycles
- 🔴 Red: One or more brokers have stale data
What Causes Red:
- Broker terminal closed
- PnL Calendar is not loaded, or data download has stopped / is not enabled.
- Network/connection issues
- File access problems
Instant visual confirmation that you're seeing live data, not stale information, which is critical for trading decisions.
| Minimize/Maximize Functionality |
Screen space is precious, especially during active trading. Portfolio Aggregator offers flexible panel states — maximized for full detail, and minimized for compact visibility.
In minimized mode, traders can choose what information to display. Options include:
-
Equity and P&L
-
Risk metrics
-
Position count
Margin: 31.6% ✓
-
Custom selection of metrics - Choose exactly which metrics to display.
The minimize button adapts to chart themes and screen DPI, and the panel’s state persists across sessions. This ensures that traders always have access to the information they need, in the format they prefer.
| Adaptive Color Schemes |
Visual clarity is essential, and Portfolio Aggregator delivers with adaptive color schemes. When enabled, the system detects the chart background and applies a matching theme — dark or light — for optimal contrast.
Each element of the panel, from headers to profit/loss indicators, can be customized. Traders can override the auto-adapt feature and define their own color palette, ensuring the dashboard aligns with their visual preferences.
Color updates occur dynamically when chart themes change, maintaining consistency throughout the trading session.
| Flexible Configuration |
Portfolio Aggregator is highly configurable, with over 40 input parameters organized into logical groups. Traders can adjust:
-
Panel layout and font settings
-
Display options for each section
-
Multi-currency conversion behavior
-
Minimize display modes and behavior
-
Risk thresholds
-
Color customization
This flexibility ensures that the dashboard can be tailored to any trading workflow, from minimalist setups to detailed analytical environments.
| Position Persistence |
To enhance usability, Portfolio Aggregator remembers its position and state across sessions. Using MetaTrader’s global variables, it stores:
-
Panel X/Y position on the chart
-
Minimized or maximized state
-
Custom minimize display selections
These settings are restored automatically on terminal restart, symbol change, or template application. Each chart maintains its own memory, allowing for independent setups across instruments.
| How Portfolio Aggregator Works |
Portfolio Aggregator relies on PnL Calendar to function. PnL Calendar tracks trading activity and exports account data in CSV format, which Portfolio Aggregator reads and visualizes.
The process is simple:
-
Install PnL Calendar on each broker terminal
-
Enable CSV export and configure the export path
-
Portfolio Aggregator scans the folder for broker files
-
It parses the data, performs currency conversion, and updates the dashboard
The system continuously monitors the folder, detecting new brokers, excluding removed ones, and warning about stale data. Refresh rates are configurable, ensuring timely updates without unnecessary load.
| Installation and Setup |
To get started, traders need:
-
MetaTrader 4 (build 1350+) or MetaTrader 5 (build 3280+)
-
PnL Calendar installed on each broker terminal
-
Portfolio Aggregator installed on the monitoring terminal
Setup Steps:
-
Install PnL Calendar and enable CSV export
-
Install Portfolio Aggregator and attach it to a chart
-
Configure basic settings (panel position, base currency, refresh rate)
-
Verify that brokers are detected and data is updating
-
Customize display, risk thresholds, and colors
| Troubleshooting Setup Issues |
-
If no brokers are detected, ensure that PnL Calendar is running and that CSV files exist in the correct folder. File names must follow the pattern Broker_[BrokerName].csv .
-
For currency conversion issues, check that the required symbols are available in Market Watch. Add them manually if needed, and verify the custom prefix setting.
-
If the panel doesn’t display, confirm that it’s attached to a chart with sufficient space and that chart object creation is allowed. Resetting the panel position may help.
-
Stale data warnings indicate that the export frequency may need adjustment or that the indicators should be restarted.
| Performance Note for MQL4 Users |
Portfolio Aggregator is optimized for MetaTrader 5 but fully compatible with MetaTrader 4.
Due to fundamental architectural differences between the platforms, MQL4 users may experience slower performance—file operations are 5-10x slower, and string processing is 2-3x slower on MQL4 compared to MQL5. This is not a code issue but an inherent platform limitation.
For optimal MQL4 performance, we strongly recommend running Portfolio Aggregator and PnL Calendar on separate charts, e.g.,
Chart 1: EURUSD with PnL Calendar,
Chart 2: GBPUSD with Portfolio Aggregator
This simple setup provides 50-70% better performance because each chart gets its own processing thread, preventing resource competition.
Additionally, consider increasing the refresh interval to 5-10 seconds and monitoring fewer broker accounts (5 maximum recommended).
If your broker supports MetaTrader 5, upgrading will provide the best experience with instant updates and smooth operation. Despite the performance differences, both platforms deliver the same accurate data and complete feature set—only the responsiveness differs.
| Disclaimer |
Portfolio Aggregator is a monitoring utility. It does not execute trades, offer brokerage services, or supply real accounts. The information provided in this article is for educational and product‑support purposes only, not financial advice. Trading in financial markets involves risk, including the potential loss of capital. Past performance does not guarantee future results. Users are responsible for ensuring compliance with local regulations and should seek independent financial advice before making trading decisions. The author assume no liability for losses or damages arising from the use of this product or reliance on the information provided.


