The Opening Range Breakout
This strategy can be used in theory on any instrument when there is anticipated momentum or strength expected. It is however particularly designed for the stock market indicies like the DAX, DOW, NASDAQ, FTSE and S&P500. There are also other indices you can trade like the JP225 etc. The reason it is so effective on those instruments is because we know when volatility will occur every day, this is at the market open.
The DAX opens at 8am in Frankfurt and the US indices open at 9:30am NY time.
The strategy can be easily traded manually but automation of it will benefit you as a trader as your emotions and potential blunders are removed from the equation.
There is an EA available https://www.mql5.com/en/market/product/90502/ which will automate this strategy for you.
Theory behind the strategy
At the open there is a flurry of activity as overnight orders get executed by banks and institutions which causes a larger than normal amount of volume and typically a larger candle to be formed. This initial activity will usually last somewhere between 5-15 minutes and is often referred to as the opening cash balance. This is where the "work for the day" is done which is the institutions actioning all the orders they have to place on behalf of their customers like hedge funds, commercial clients, pension funds etc...
After the initial opening cash balance is complete the large market participants then start their speculative trading activity which is where they use their funds to make money trading price movements.
The beauty of this strategy is that you get at least two opportunites a day to trade it. You can trade the open of Frankfurt on the DAX and the FTSE and you can trade the open of New York on the DOW, NASDAQ, S&P500 or the Russel 2000. There are other indices too and each has a slightly different way of opening but all have an initial cash balance entered where there is high volume and the breakouts of that activity are going to happen on them all. We just need to adjust our stops to allow for the different levels of price action on each accordingly.
What happens after the open
Once these initial movements are in we tend to then get one of two things happening.
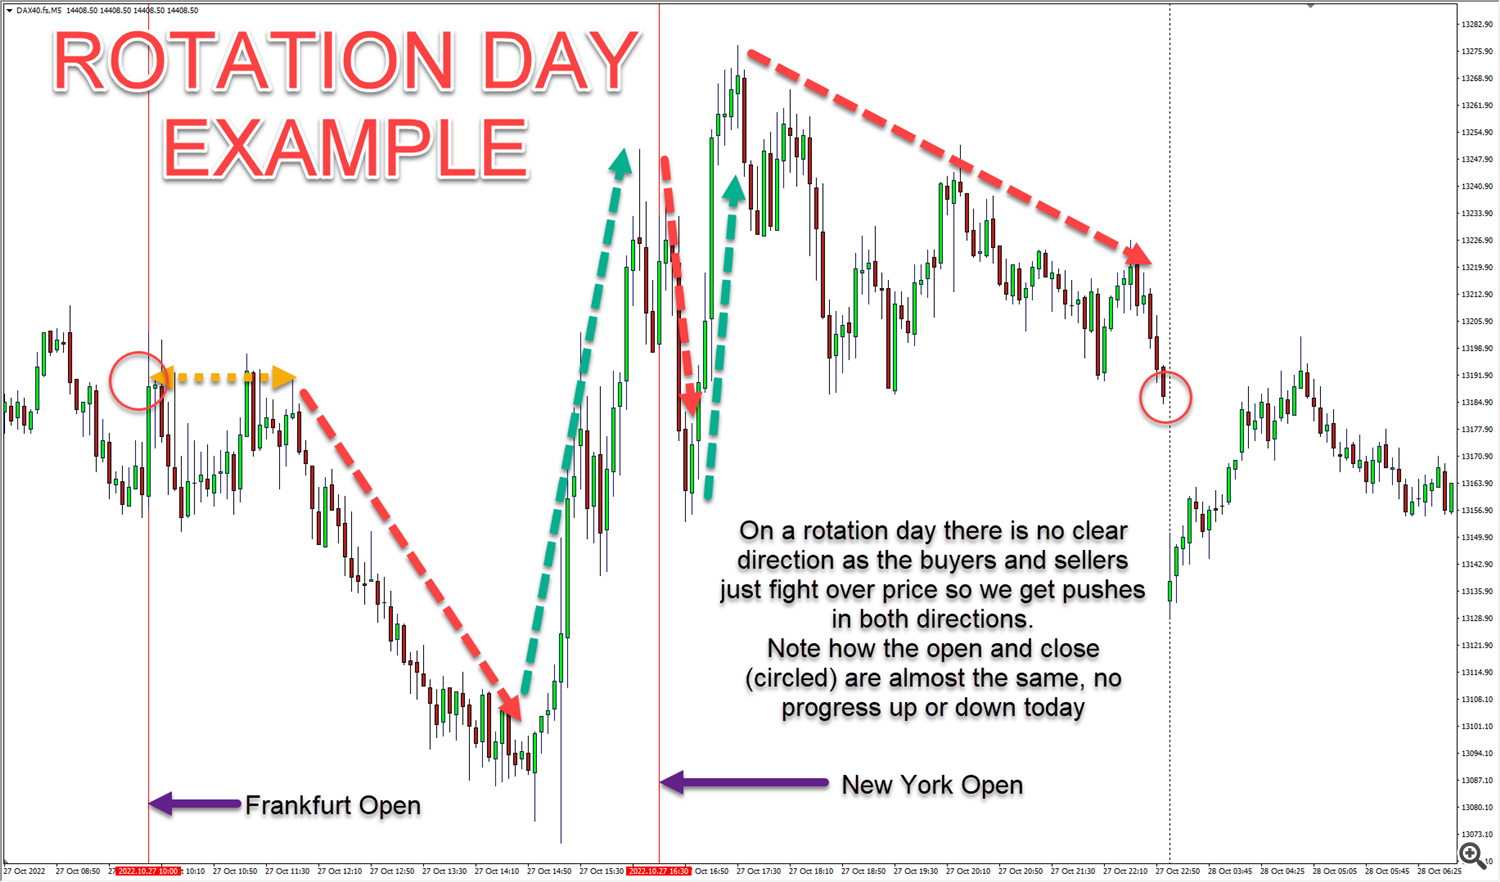
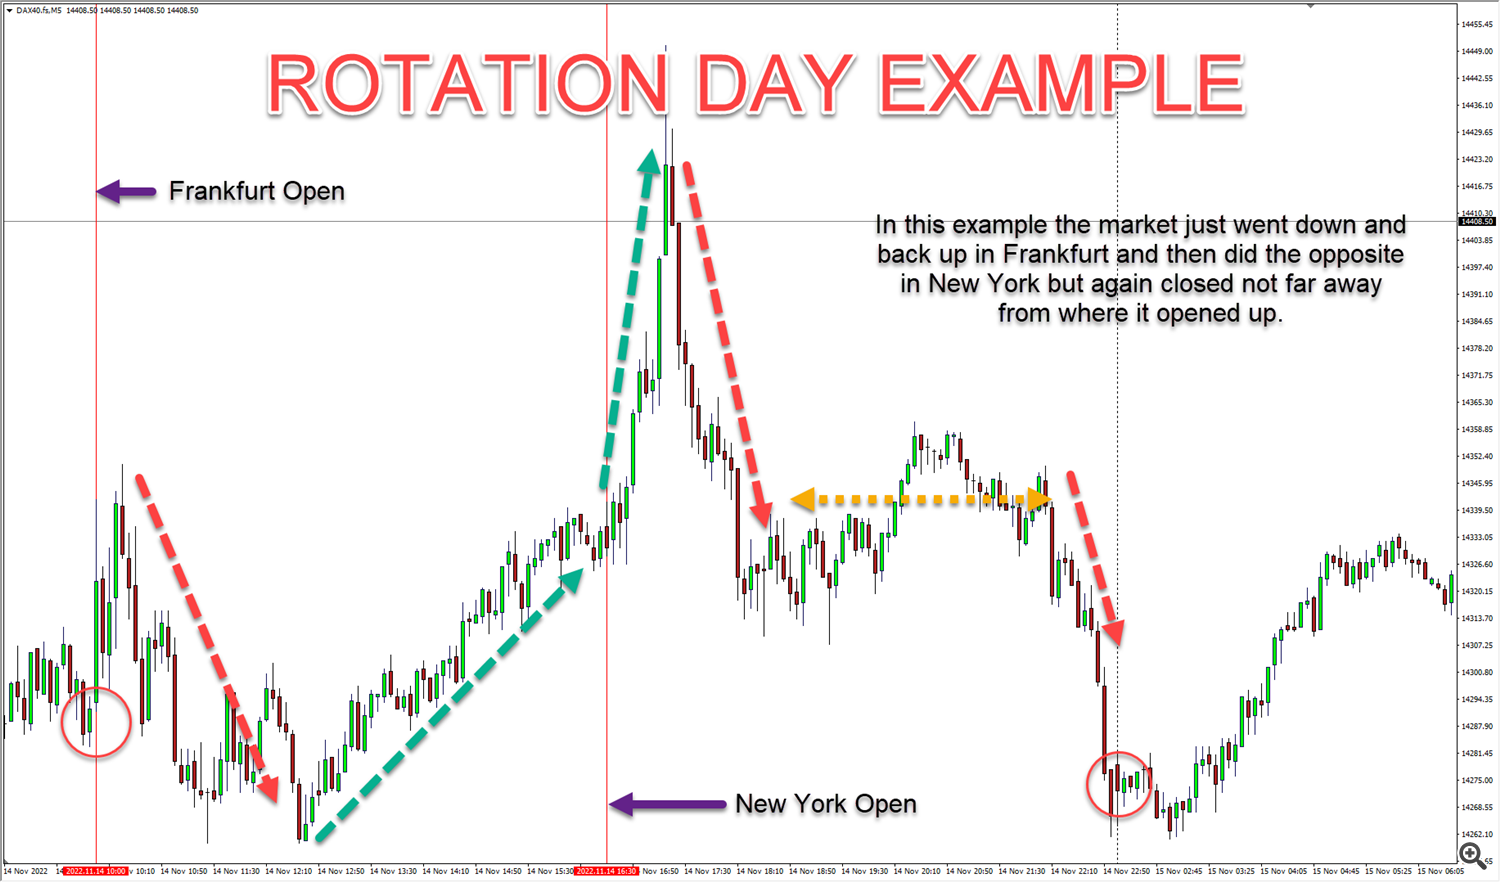
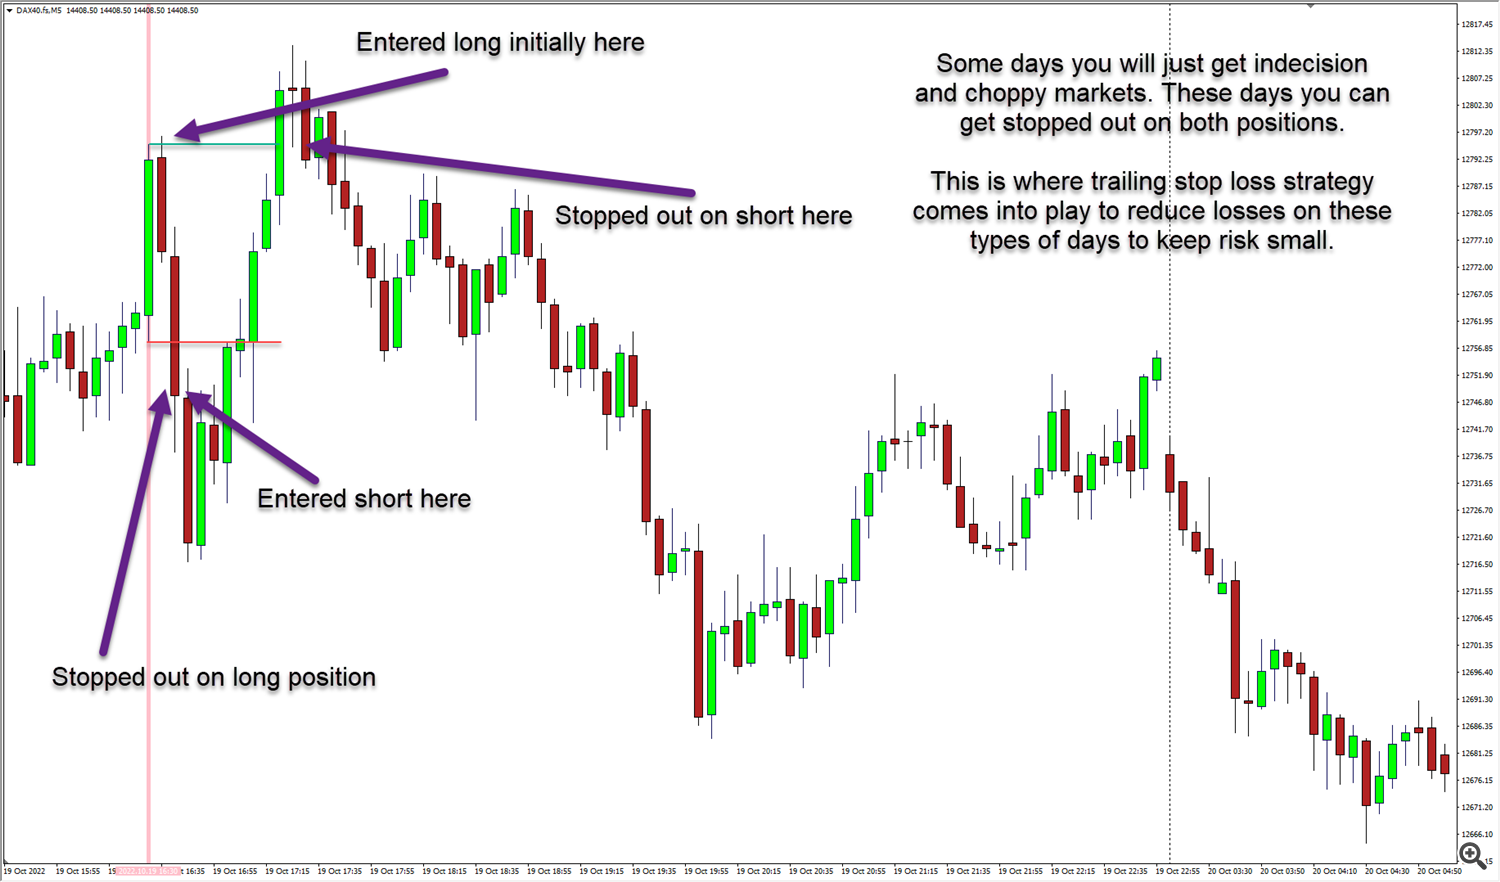
1. You get a range or rotation day where the index pushes up, reverses and the reverses again. These days the strategy will often breakeven, make small losses or make small gains depending on how far out of the initial range the participants push price.
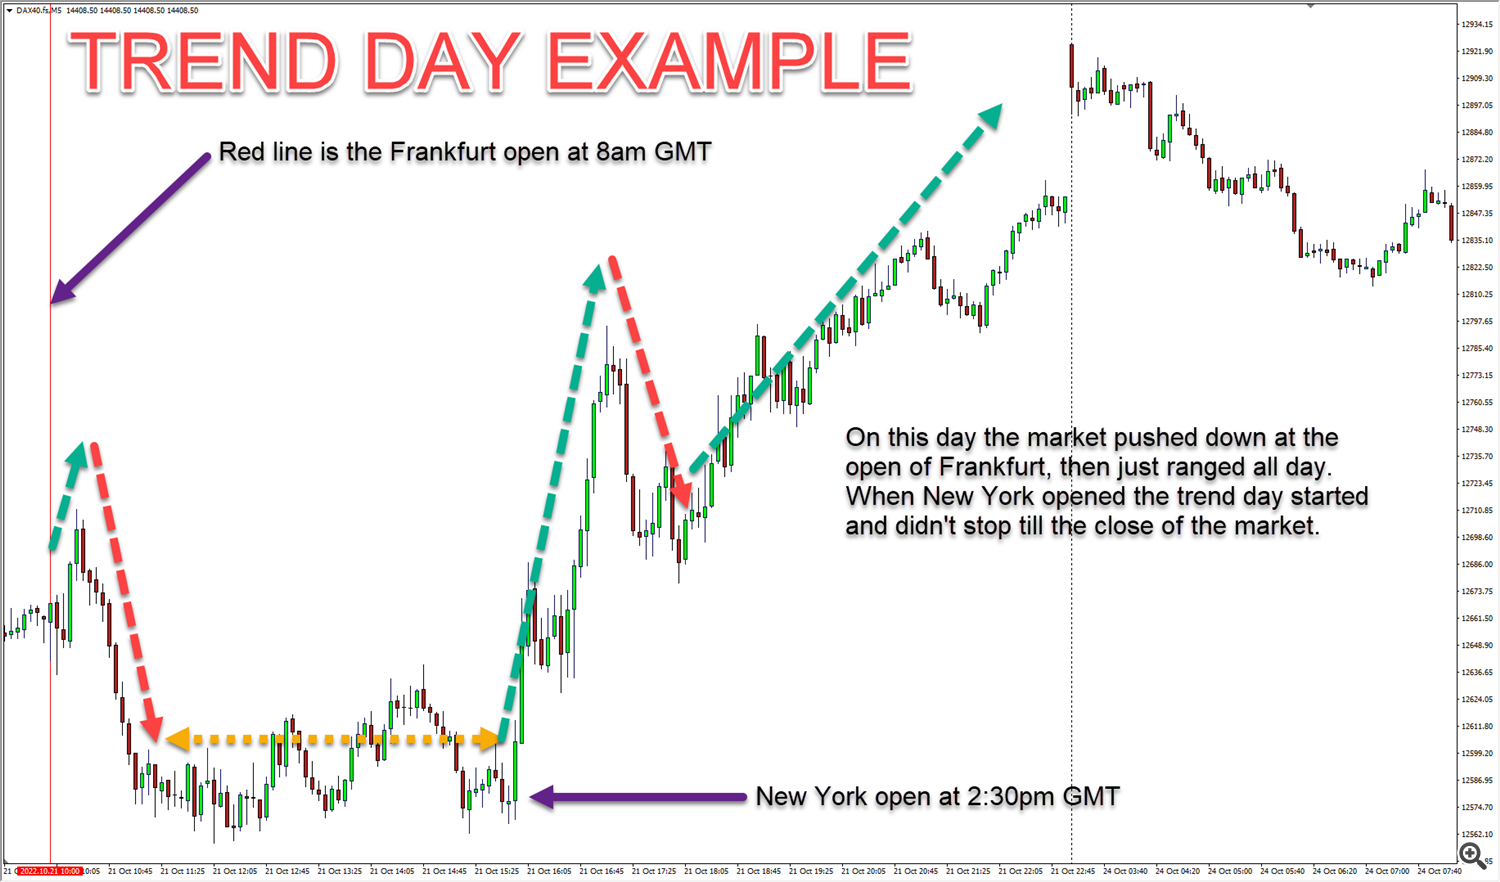
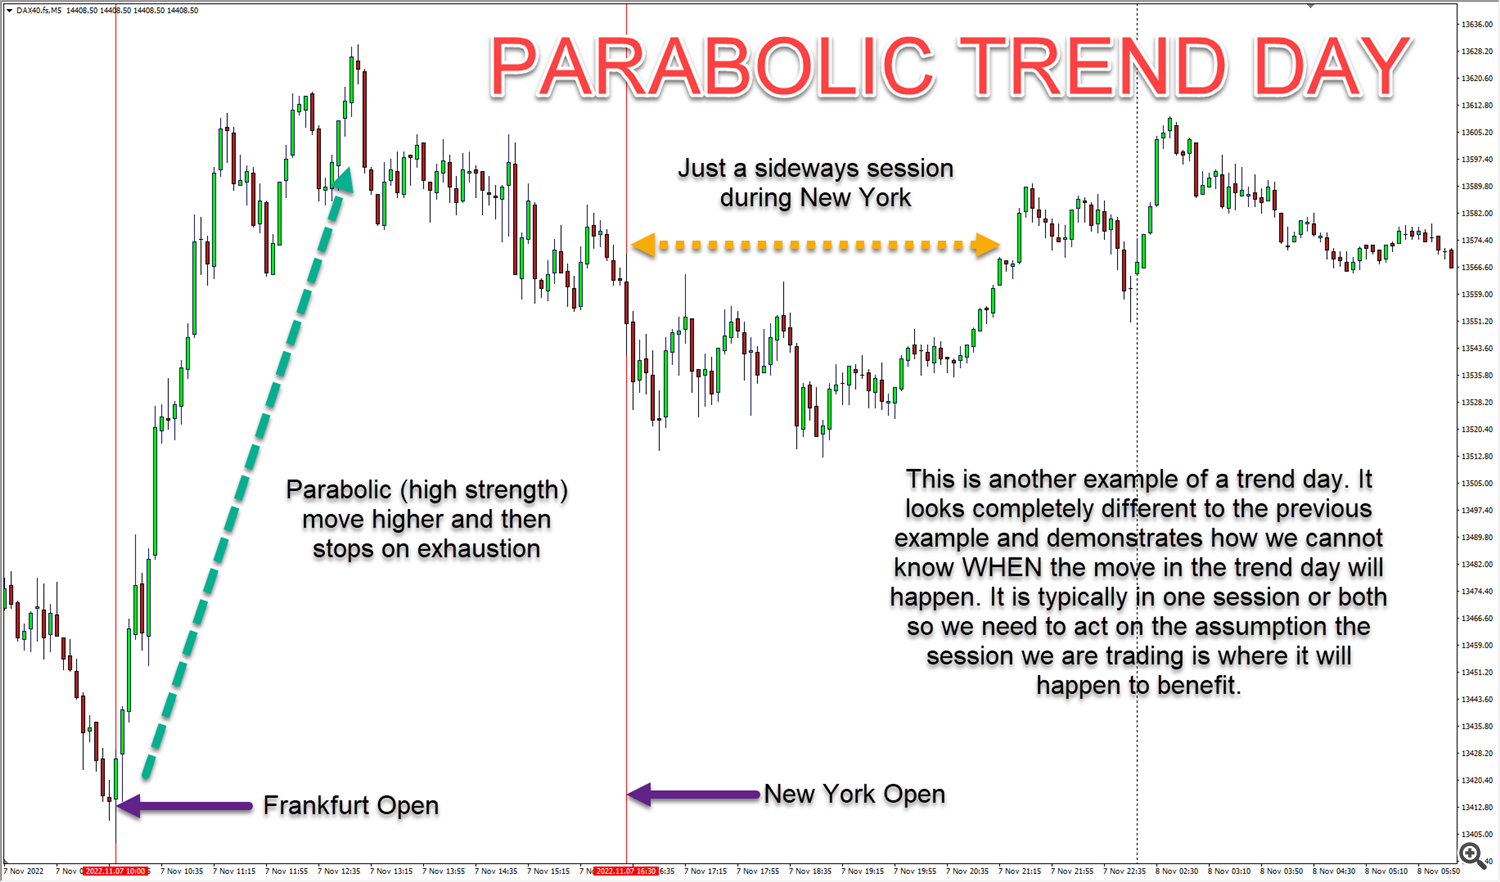
2. You get a trend day where the market pushes in one direction often for hours on end and usually for the entire trading sesssion. These are the days the strategy really banks and can generate high returns as it rides the trends.
As retail traders we can obviously not know which of these will occur, and it doesn't really matter as it's out of our control completely. We can however anticipate each and have a strategy prepared that will mean we can keep our risk small if unfavourable price action unfolds but at the same time maximise on a trend formation if that occurs. The latter is obviously our preferred outcome and you will find usually there will be at least 1 or 2 times a week on average you get a trend day or session.
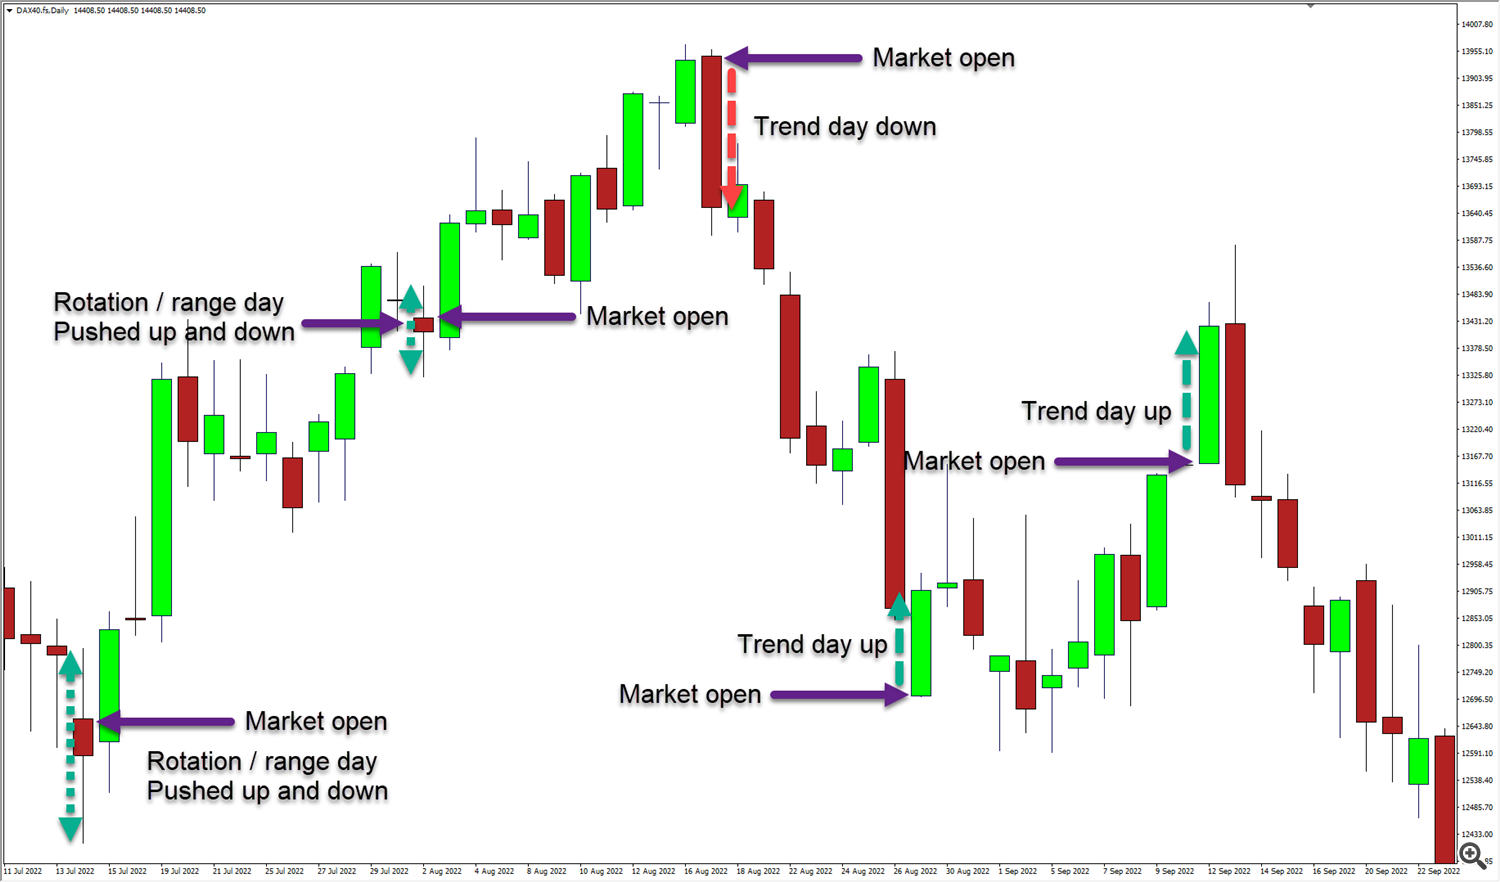
You can see the types of days clearly on a daily chart as illustrated below. This is the German Dax index daily chart but those types of days exist on every instrument you can trade. It is important to understand that only 2 types of day exist, trend days and rotation / range days. Therefore we know that one or the other outcome will happen every day, we just don't know which or how it will unfold but the fact we know one will happen gives us a clear edge in the market.
Now lets take a look at a few examples of both day types unfolding intraday on the 5 minute chart. Remember we know these types of days exist but how they unfold each day can be very different.
CONCLUSION: So we now know that there are 2 types of day we can expect, and it is totally out of our control how those days will unfold. This is the basis of the pening range breakout strategy and the edge it provides. We do NOT need to know what type of day it will be, how it will unfold or when. We just need to know they will happen and create our edge around these movements. We need to be like a fisherman, we catch fish each day (our pending orders trigger us into the market), some we throw back (stop out on) as they are not right, but the big fish we catch (the fast trends) will feed us very well. ;)
How to trade the opening range breakout
So now we know how the day COULD unfold we need a way to get in on the action as it happens. The days we are looking for and the ones we will make money on are typically the trend days but we can also benefit from the rotational days too sometimes. The strategy is best traded using a 5 minute chart as we are going to concentrate on that initial cash balance and flurry of orders that happens in the first 15 minutes.
We will only trade the open of the market at Frankfurst or New York. It is advised to ONLY trade NY markets in NY and the Dax and FTSE at the Frankfurt open as this is when they get the majority of their liquidity.
We will wait for initial opening ranges to be formed on the charts. First and most important is the 5 minute opening range. This is the initial cash balance and often the largest dump of orders for the session. We want this out of the way so we can see where the REAL direction of the market could go for this session/day.
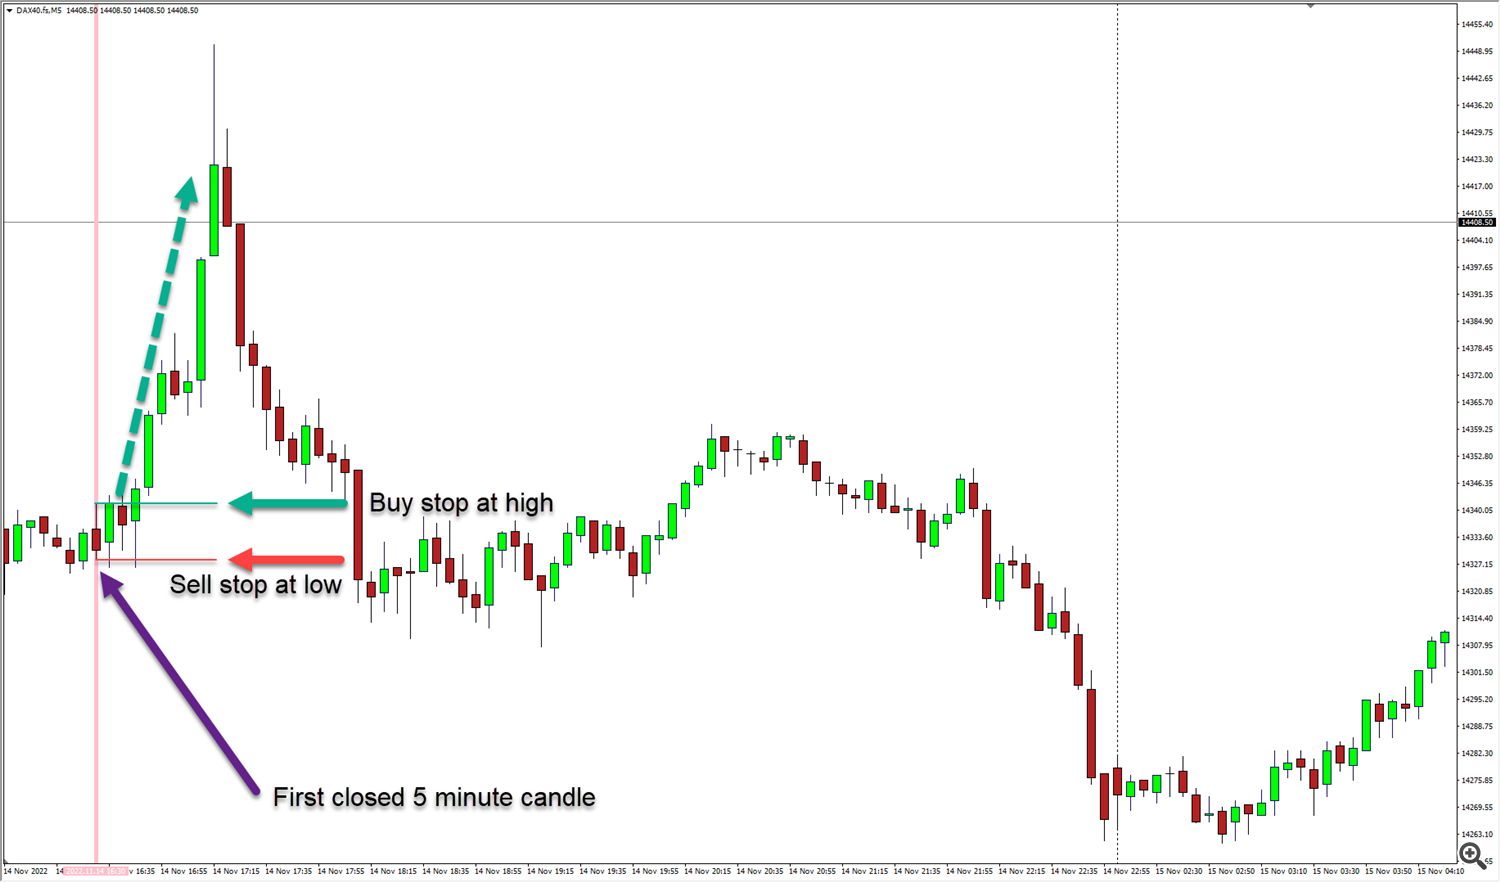
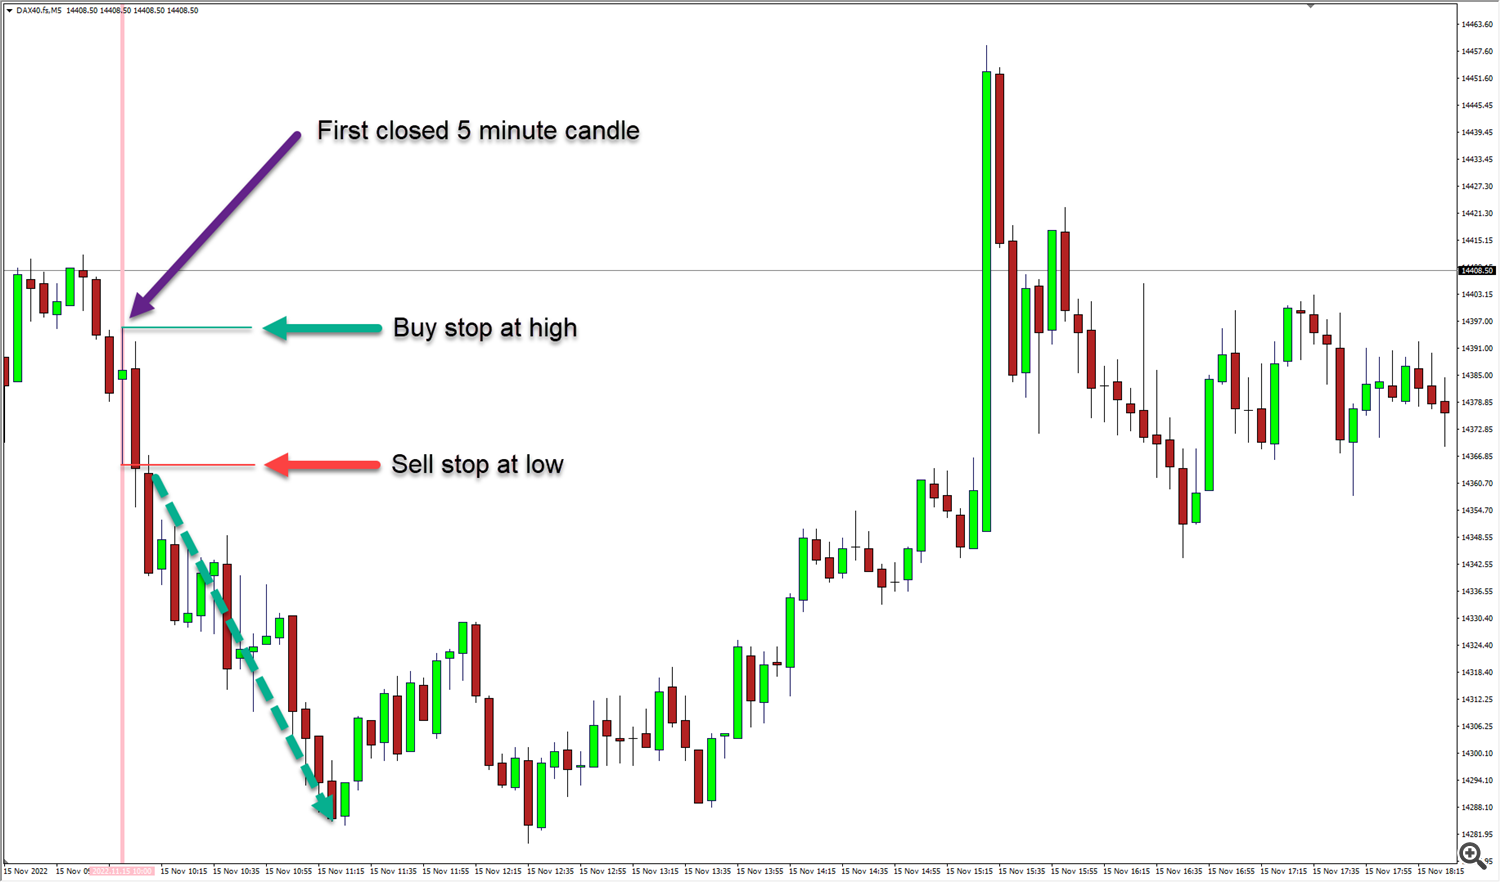
Once this opening 5 minute candle is closed we can place a pending order at the high and low of the candle. Remember, we have no idea which way the market will go now so we want to get on board with the large market participants when we know who is taking control of the session straight away, the bulls or the bears, we don't care which.
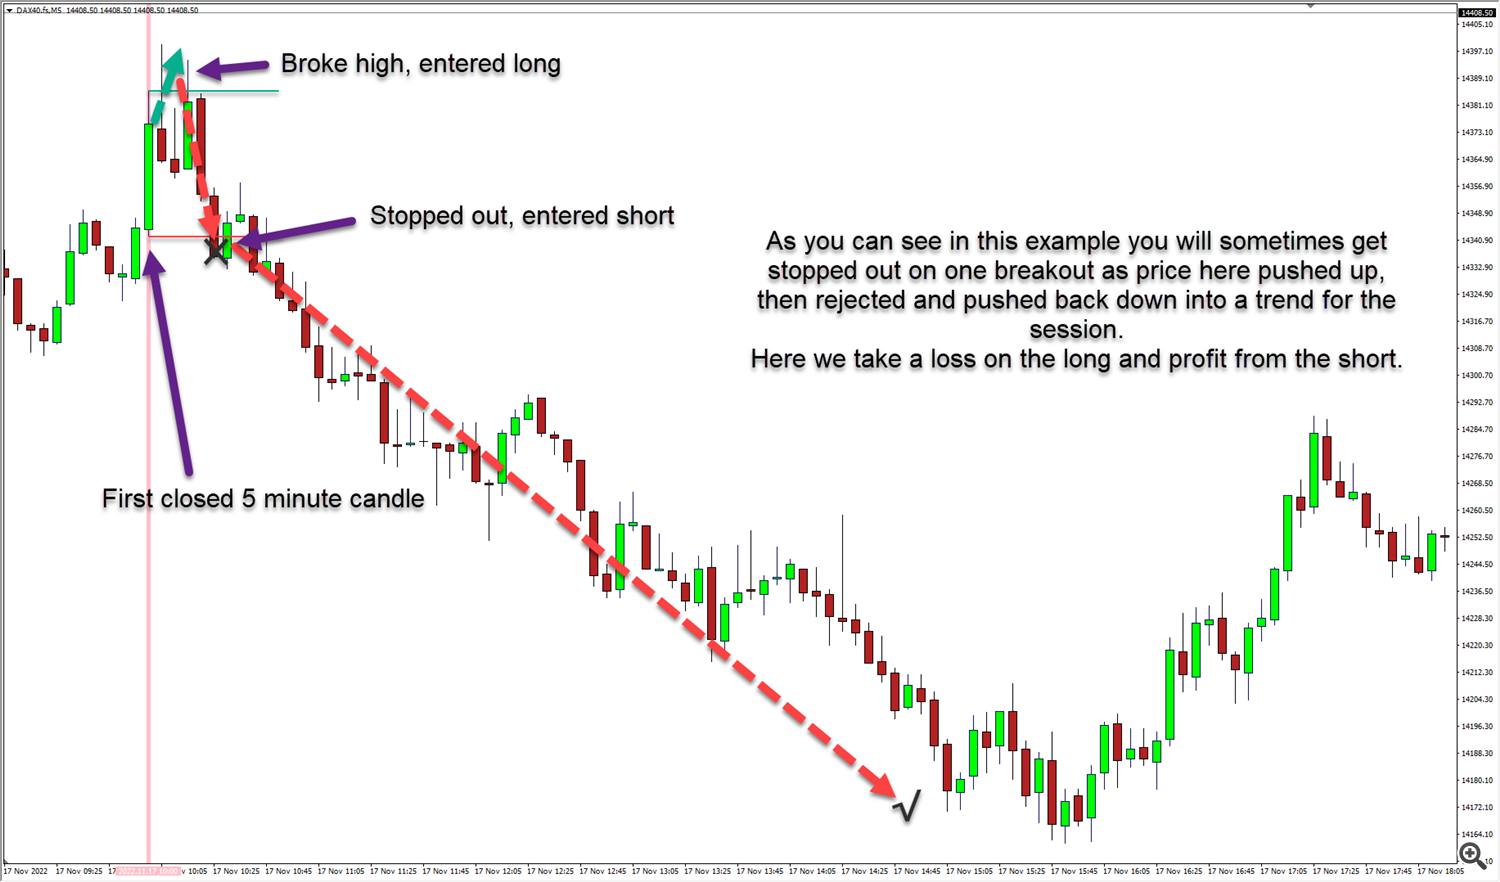
Below you can see a couple of examples of the price action that typically unfolds after the first 5 minutes of the session.
So there we have our first entry into the the market today. This strategy on it's own will be profitable long term and you can backtest to find the perfect stop positioning in pips using the opening range breakout EA which is available here: https://www.mql5.com/en/market/product/90502/
You could just use the opposite end of the opening range too as in the example above, both work well.
Your take profit on the position that works is again personal preference and there are a number of ways you could exit your positions. The most commonly used is the risk:reward method where you will simply target a percentage of your stop loss. So if you are using a 30 pip stop and you wanted a 2:1 risk:reward you would simply use a 60 pip take profit. The problem with this is you will miss those massive runs, some of them can be HUGE and even multi day! You are limiting the upside potential of your trades. You also have no idea whether the market has the potential to even hit your take profit. If you decided on a 4:1 risk:reward and on average the market only ever moves 3:1 on a daily basis it's unlikely you'd ever hit the profit target!
A better way to handle the profit taking on a strategy like this is to use either a dynamic stop loss like a parabolic sar or a moving average like the 9 SMA. Both work well and will give fairly similar results. In testing the 9 SMA has proved a very good way to take profits as it lets your winners run as long as they can and gets you out as price moves start to weaken. Alternatively a trailing stop loss is also a very good way to lock in profits when moves start and the size will obviously have an impact on results and vary on each instrument you trade. The opening range breakout EA ( https://www.mql5.com/en/market/product/90502/ ) can do all this so you can backtest and also has the ability to move your stop to breakeven too so you can mitigate risk quickly when a move starts. It will either go or it wont, reduce risk quickly when it starts to go your way.
Adding to our winning entries:
When an opening range breakout starts to work we should next look at ways to maximise our profits. When people have a trade running in profit they tend to concentrate on taking that profit or planning where they will do so. This is counter to what makes most successful traders profitable, they add to their trades that are working rather than take profits straight away.
Remember those fast moves you saw above on the 5 minute chart? They often last for 3-5 bars before they rest and if you get a parabolic move as demonstrated above you could be in a trade all day. So why just sit there, add some more size to the position and double up your profits to really kill those trend days.
Lets look at how we can achieve this.
1. The simple add on position.
If we have a single trade running we can set a level of pips in profit where we add to the trade. As an example lets say we have a 40 pip stop loss and price has moved 20 pips in our direction. We can now move the stop to breakeven on our first position and add a second one with a similar risk. Now one of two things will happen. We will continue to be correct with our trade and price will move our way or it will pull back or reverse. If it continues our way we double our profit and maximise on the potential of the move. If it pulls back we may get stopped out on one or both positions but will only have 1 loss an done breakeven trade as a worst case scenario, it could just pull back a little and then continue our way. We dont actually know and never will but we need to maximise our potential to make profits when the trades start to work. If it reverses we will have the same result as the pullback and stop out on one and breakeven the other.
2. We can take additional opening range breakouts.
We've established that first 5 minutes at the open is important and we often get explosive moves after the candle forms. But what about the 10 minute range, 15 minute, 30 minute etc....
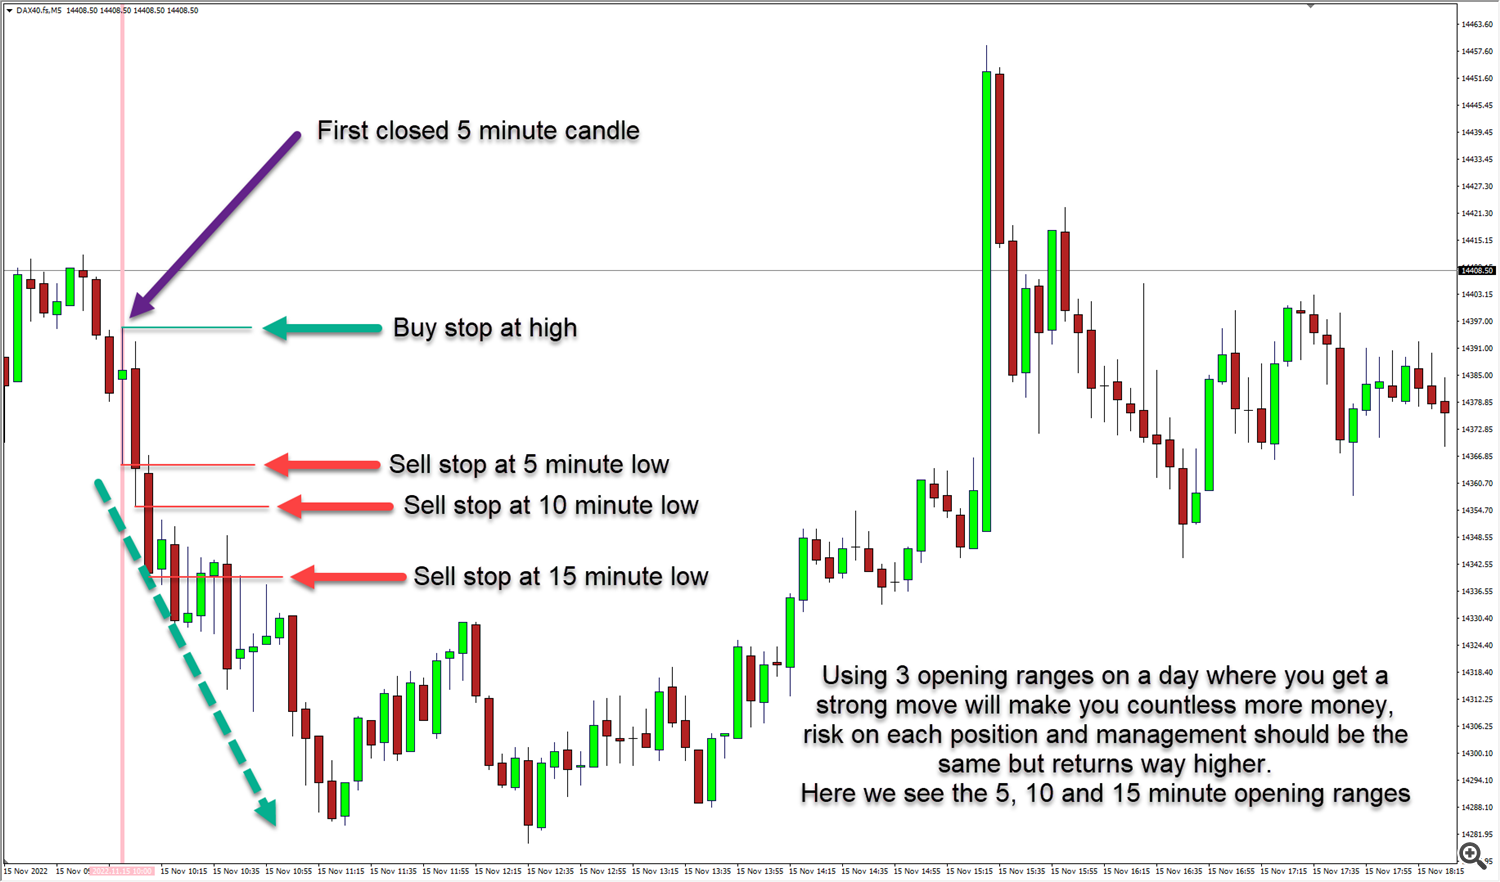
If you look at a 5 minute chart right after the open you will often find those explosive moves that turn into trend days happen fast and they dont stop, there are examples shown above of it doing just that. If we placed further pending orders at other opening ranges (say the 10 minute and 15 minute) we would essentially get 3 positions on those big moves and not just the one! This way of adding onto positions can produce huge returns on trend days or opening parabolic moves. Some argue that the 15 minute pening range is more effective than the 5 minute and on testing this theory some days that is true but on others it fails, just like any strategy. So we can assume that it's probably a good idea to take both as IF they both work sometimes when they work together you will make twice as much profit!
Lets look at some examples of additional opening ranges that could be used as either the base initial trade or add on trades.
You can use anything as an opening range but remember we are trying to benfit from the large volumes and momentum that is generated at market opens here. You can test different time periods using the opening range breakout EA ( https://www.mql5.com/en/market/product/90502/ ) but in backtesting typically anything over 30 minutes was not as profitable as the initial 5 and 15 minute ranges.

