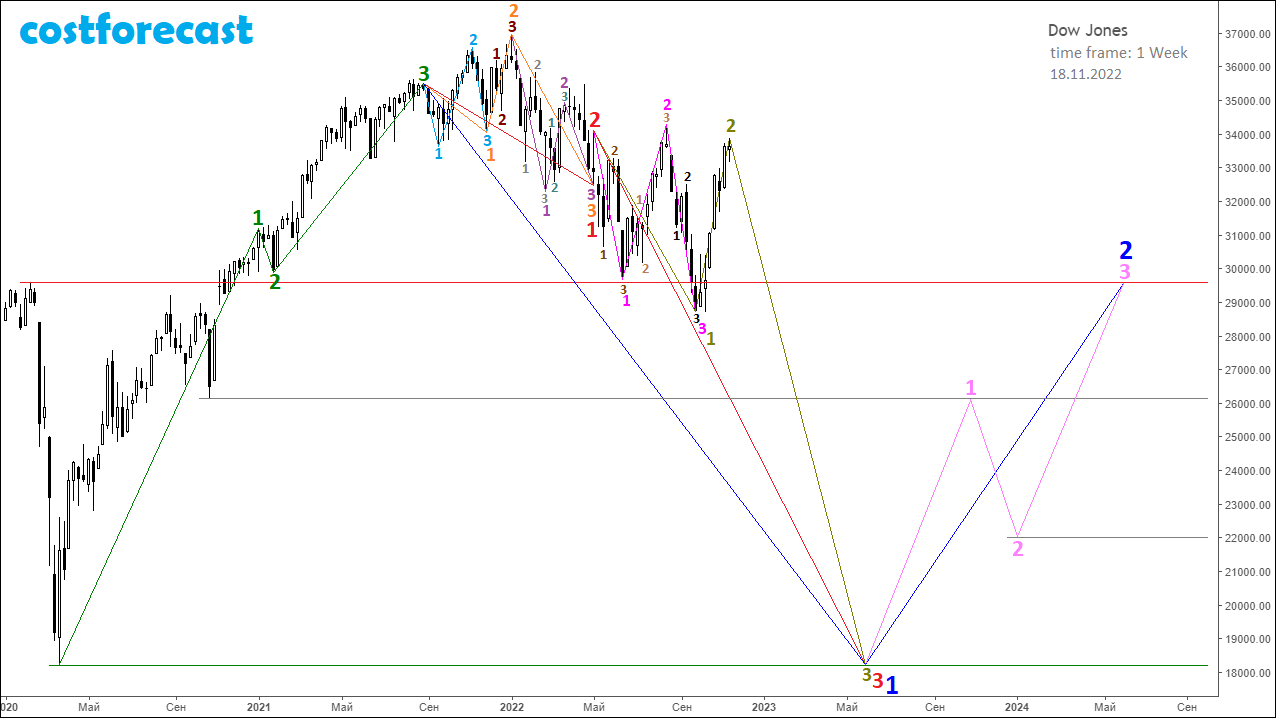
The fractal structure of the chart with a time frame of 1 Week.

Analyzing the fractal structure formed on the graph of the dynamics of the Dow Jones index, built with a time frame of 1 week as of 11/18/2022, we can assume that in the time interval (09/30/2022; 11/14/2022) the 2nd segment of the fractal was formed , which is marked in olive color on the graph.
At the moment, the most likely scenario is that the future dynamics of the Dow Jones index will take place in a downtrend as part of the formation of the 3rd segment of the olive fractal towards the support level at around 18,000 points.
The 1st segment of the olive fractal was formed on the time interval (05/04/2022; 09/30/2022) in the form of an F23 fractal, indicated in bright pink.
After its completion, the olive fractal will be the 3rd segment of a fractal of a higher order, indicated in red, the 1st segment of which was formed on the time interval (09/02/2021; 05/02/2022) in the form of a fractal, which is indicated in orange, and The 2nd segment of this red fractal formed as a mono-segment on the time interval (05/02/2022; 05/04/2022).
In this case, the collapse of the American stock market will end with the formation in the fractal structure on the graph of the dynamics of the values of the Dow Jones index of the 1st segment of the fractal, marked in blue, representing the F11 fractal, which is marked in red.
The most likely end of the fall of the index may occur at around 18,000 points. However, anything can happen, and with very strong volatility, this support level can be easily broken.


