
BTCUSD: Bullish Doji Star Pattern Above $18900
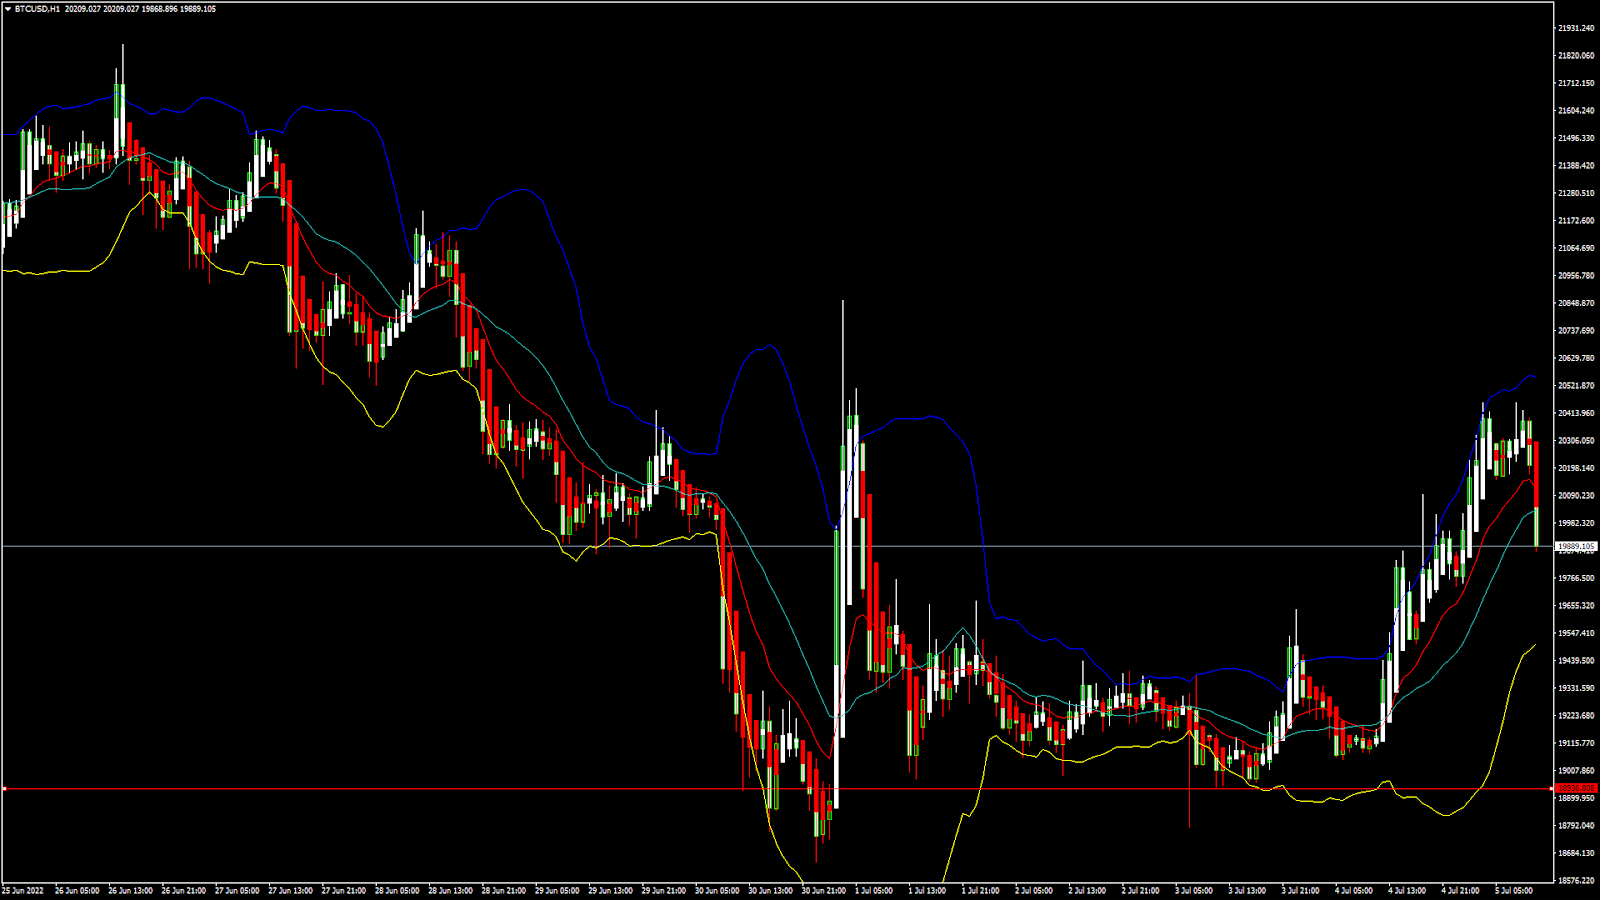
Bitcoin was unable to sustain its bullish momentum last week and started to decline against the US dollar touching a low of 18646 on 30th June, after which we can see some correction in its levels above the $19000 handle.
The prices of bitcoin started to reverse, confirming the bullish tone in the markets. We can see a shift towards the consolidation channel above the $19500 handle in the European trading session today.
We can clearly see a bullish doji star pattern above the $18900 handle which is a bullish reversal pattern because it signifies the end of a downtrend and a shift towards an uptrend.
Both the STOCH and STOCHRSI are indicating overbought levels which means that in the immediate short term a decline in the prices is expected.
The relative strength index is at 56 indicating a STRONG demand for bitcoin at the current market levels.
Bitcoin is now moving below its 100 hourly simple moving average and its 200 hourly simple moving average...More info: blog FXOpen


 Trading Guide")

