Signal Strength Meter - User Manual
This is a manual about how the Signal Strength Meter works, and how it could be used for trading.
What is the Signal Strength Meter score?
The Signal Strength Meter score is calculated from the following indicators:
- Two Different Moving Averages
- Parabolic SAR
- Directional Movements
- Force Index
- Relative Vigor Index
- Relative Strength Index
- Momentum
- William's Percentage Range
- Commodity Channel Index
- Bears vs Bulls
- Awesome Oscillator
- Accelerator Oscillator
- 11 different Candlestick Patterns
Each currency is analysed and the final score is a result of all the above criteria.
Where is the Final Score Displayed?
There is a box for each currency pair on the Signal Strength Meter Dashboard:
![]()
The green bars in the above picture indicate the score of EURCHF on the current Timeframe of the chart.
The
score is 6.
The number 3 in the small box to the right indicates the score of EURCHF on the Higher Timeframe set in the settings.
What is the Individual Currency Score and How is it calculated?
The individual currency score is a score assigned to each individual currency which constitute the currency pairs.
It is calculated by looking at all the pairs which have this certain currency, and compounding all the scores to come up with a final strength score for the currency.
For example, the score of USD, would be calculated by looking at the scores of EURUSD, GBPUSD, USDJPY, USDCHF, AUD USD, NZDUSD, USDCAD.
How to use the Signal Strength Meter for trading?
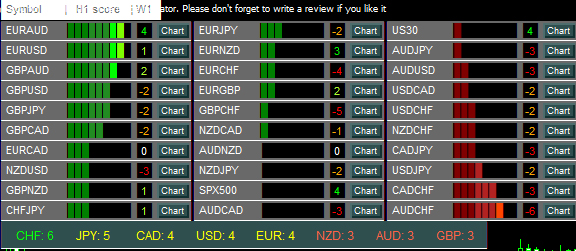
First of all you have to look at the pairs with exceptionally high/low scores:

In the picture above, EURAUD, EURUSD and GBPAUD have very high scores of 8, 8 and 7 on
the current timeframe indicating Buy tendencies:

Also AUDCHF has a very low score of -7 indicating Sell
tendencies:
![]()
EURUSD has a higher timeframe score of 1, and GBPAUD has a higher timeframe score of 2 which are low scores, and therefor it is better not to trade them.
EURAUD has a higher timeframe score of 4, which is relatively
high, but it needs further confirmation.
So I will move to the bottom Individual Currency Scores:
![]()
EUR has a score of 4, while AUD has a score of 3. This indicates that since EUR is stronger than AUD, and therefor EURAUD should be heading up, but it is not much stronger, so I will also probably not trade it.
AUDCHF has a higher timeframe score of -6. This matches the low
score of the current timeframe, and it means that it has a very strong sell tendency.
Moving to the bottom Individual Strengths, I see
that AUD has a score of 3, and CHF has a very high score of 6.
This means that CHF is much stronger than AUD, and the AUDCHF pair will be heading downwards.
Since all the signals align on the AUDCHF, I will be looking to SELL the pair.
The only things left to consider are major support/resistance levels, and if a we are at the end of a bar and the movement has already happened.
What are the Technical Parameters I see in the Settings?
fast_MA_p: Period of the fast moving average. Increase in score when price above MA, decrease when below it.
slow_MA_p: Period
of the slow moving average. Increase in score when price above MA, decrease when below it.
SAR_step: Period of the Parabolic SAR step.
Increase in score when SAR is below price, decrease when above price.
SAR_max: Period of the Parabolic SAR max. Increase in
score when SAR is below price, decrease when above price.
ADX_p: Period of the ADX indicator. Increase in score when Di+ above Di-,
decrease when Di+ below Di-.
Force_p: Period of the Force Index indicator. Increase in score when above 0, decrease when below
0.
RVI_p: Period of the RVI indicator. Increase in score when RVI line above Signal Line, decrease when RVI line below Signal
Line.
Momentum_p: Period of the Momentum indicator. Increase in score when above 100, decrease when below 100.
RSI_p: Period of the RSI indicator.
RSI_type: Type of RSI reading:
- Over Bought/ Over Sold: Increase in score when below 30, decrease when above 70.
- Trend: Increase in score when above 70, decrease when below 30.
WPR_p: Period of the Williams %R indicator.
WPR_type: Type of WPR reading:
- Over Bought/ Over Sold: Increase in score when below -80, decrease when above -20.
- Trend: Increase in score when above -20, decrease when below -80.
CCI_p: Period of the CCI indicator.
CCI_type: Type of CCI reading:
- Over Bought/ Over Sold: Increase in score when below -100, decrease when above 100.
- Trend: Increase in score when above 100, decrease when below -100.
Bears_p: Period of the Bears indicator. Increase in score when above 0, decrease when below 0.
Bulls_p: Period
of the Bulls indicator. Increase in score when above 0, decrease when below 0.
►
Get a 7-Day Free Trial Version:
(Full Access to The Indicator for 7 Days)


