Most Logic Trading Strategy For The Camarilla Pivot Levels (Case Study)
Introduction
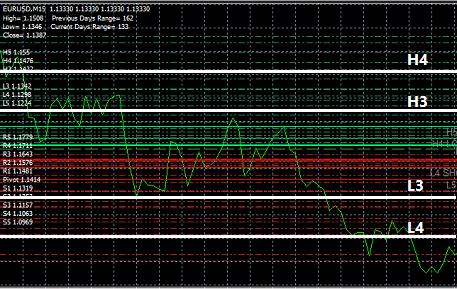
On this article i will explain a very logic, but simple way to trade on the market using the Camarilla Pivot Points, i will use graphical case studies so they will be no misunderstandings. This strategy works because "Price has natural tendency to go back to the mean price", with this in mind, we will focus on 8 lines mainly the four most interesting levels H4, H4, L3 and H4.
What are the Camarilla Pivot Levels (Graphically)

The Camarilla Pivot points/levels are a set of divider lines on your chart that mark four Support and Resistance levels of a current trend. We use these levels
to target TakeProfit and Stoplose of an order. All types of traders can implement the Camarilla pivot levels, but is mostly famous among intraday traders.
How To Calculating the Camarilla Pivot 8 Levels?
| Level | Name | Formula |
|---|---|---|
| H4 | Resistance 4 | CLOSE + RANGE * 1.1/2 |
| H3 | Resistance 3 | CLOSE + RANGE * 1.1/4 |
| H2 | Resistance 2 | CLOSE + RANGE * 1.1/6 |
| H1 | Resistance 1 | CLOSE + RANGE * 1.1/12 |
| L1 | Support 1 | CLOSE - RANGE * 1.1/12 |
| L2 | Support 2 | CLOSE - RANGE * 1.1/6 |
| L3 | Support 3 | CLOSE - RANGE * 1.1/4 |
| L4 | Support 4 | CLOSE - RANGE * 1.1/2 |
HIGH  = previous day average highest price
LOW   = previous day average lowest price
CLOSE = previous day average closing price
RANGE = HIGH - LOW
PP    = (HIGH + LOW + CLOSE)/3
Visualize the Trading Strategy!
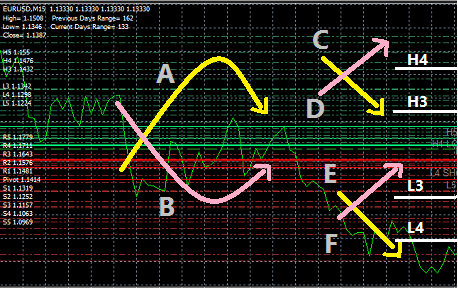
images make for the best explanation, so once you able to visualize your strategy you will not ever have to worry about emotions clouding your judgement, every trade is clear. The Camarilla Pivot levels strategy can be simply explained using the following diagram.

| yellow line | Direction to open sell order |
| pink line | Direction to open buy order |
| grey area | No trade region |
| middle area | Trading Zone |
| area between L3 and L4 | Support region |
| area between H3 and H4 | Resistance region |
Case 1
(A) If open price crosses under H3 and crosses over H3 again, open Sell order (Takeprofit = L3 and StopLoss = H4)
(B) else if open price crosses over L3 and crosses under L3 again, open Buy order (Takeprofit = H3 and StopLoss = L4)
Case 2
(C) If open price crosses over H3, open Sell order (Takeprofit = L3 and StopLoss = H4)
(D) else If open price crosses under H4, open Buy order (Takeprofit = potential_breakout and StopLoss = H3)
Case 3
(E) If open price crosses over L4, open Sell order (Takeprofit = potential_breakout and StopLoss = L3)
(F) else If open price crosses under L3, open Buy order (Takeprofit = H3 and StopLoss = L3)
Case 4
(G) if open price is on the grey area, ignore until it move closer to the Resistance region or Support Region.
Available indicators
Camarilla Levels Pivot Free by oneoleguy
Available Signals
-screenshot-
I'm planing on building one of my own, when its done, i will share the link on the updated version of this article.
Conclusion
Many have difference views about this indicator but I found this one strategy to make the most sense for this indicator, logically and account management wise (take-profit and stop-lose targeting). The Camarilla Pivot Points make it easy to open and close order without falling victim to your own emotions.
Good Luck
NOTICE: you can apply the same logic with the other pivot points namely Woodie - Tom DeMark's - Floor - Fibonacci


