

A system of alerts is available for price crossing the levels of Value Area high and low, Median, and Single Print zones.
The following sessions are supported:
- Daily: the common 24-hour session popular in Forex trading. By default, it uses your broker's timezone for day start and day end, but you can set your own time shift to change that.
- Weekly: a session length that works well for both Forex and stocks analysis as both asset types have clear weekly start and end.
- Monthly: can be useful to analyze long-term movements in any financial asset.
- Quarterly: this session length is intended mostly for analysis of the stock market with its quarterly company reports.
- Semiannual: another long-term session, which can be useful for assets that show high seasonality.
- Annual: the ultimate long-term session, which can help with analysis of any asset, be it Forex, commodities, equities, or cryptocurrencies.
- Intraday: with this session, you can break down the day into 4 or less sections to analyze specific trading sessions, for example, New York and Asian, together or separately.
- Rectangle: a free-form session, useful when you would prefer to analyze some specific period that has no fixed calendar counterpart.
Sessions can be switched either via input parameters or via the following keyboard shortcuts:
- Ctrl + 1 for Daily.
- Ctrl + 2 for Weekly.
- Ctrl + 3 for Monthly.
- Ctrl + 4 for Quarterly.
- Ctrl + 5 for Semiannual.
- Ctrl + 6 for Annual.
- Ctrl + 7 for Intraday.
- Ctrl + 8 for Rectangle.
Input parameters
Main
- Session (default = Daily) — a trading session for market profile: Daily, Weekly, Monthly, Quarterly, Semiannual, Annual, Intraday, and Rectangle. For a rectangle session to get calculated, a rectangle chart object with the name starting with MPR should be added to the chart. Pressing 'r' on the keyboard will add a properly named rectangle object automatically.
- StartFromDate (default = __DATE__) — if StartFromCurrentSession is false, then the indicator will start drawing profiles from this date. It draws to the past. For example, if you set it 2018-01-20 and SessionsToCount is 2, then it will draw the profiles for 2018-01-20 and 2018-01-19.
- StartFromCurrentSession (default = true) — if true, then the indicator starts drawing from today, else — from the date given in StartFromDate.
- SessionsToCount (default = 2) — for how many trading sessions to draw the market profiles.
- SeamlessScrollingMode (default = false) — if true, the StartFromDate and StartFromCurrentSession parameters are ignored; the sessions are calculated and displayed starting from the current chart position's rightmost bar. This allows scrolling back in time indefinitely to view past sessions.
- EnableDevelopingPOC (default = false) — if true, multiple horizontal lines will be drawn to depict how the Point of Control developed through the session.
- EnableDevelopingVAHVAL (default = false) — if true, multiple horizontal lines will be drawn to depict how the Value Area High and Value Area Low developed through the session.
- ValueAreaPercentage (default = 70) — a percentage share of the session's TPOs to include in the Value Area.
Looks and colors
- ColorScheme (default = Blue to Red) — color scheme for profile's blocks:
- blue to red
- red to green
- green to blue
- yellow to cyan
- magenta to yellow
- cyan to magenta
- SingleColor (default = clrBlue) — if ColorScheme is set to Single Color, this color will be used to draw market profiles.
- ColorBullBear (default = false) — if true, the color of the profile blocks depends not on the age of the origin bar but on its direction.
- MedianColor (default = clrWhite) — the color of the control value (median).
- ValueAreaSidesColor (default = clrWhite) — the color of the value area side borders.
- ValueAreaHighLowColor (default = clrWhite) — the color of the value area top and bottom borders.
- MedianStyle (default = STYLE_SOLID) — the Point of Control (median) line style.
- MedianRayStyle (default = STYLE_DASH) — the Point of Control (median) ray line style.
- ValueAreaSidesStyle (default = STYLE_SOLID) — the style of the value area side borders.
- ValueAreaHighLowStyle (default = STYLE_SOLID) — the style of the value area top and bottom borders.
- ValueAreaRayHighLowStyle (default = STYLE_DOT) — the style of the value area top and bottom rays.
- MedianWidth (default = 1) — the Point of Control (median) line width.
- MedianRayWidth (default = 1) — the Point of Control (median) ray line width.
- ValueAreaSidesWidth (default = 1) — the width of the value area side borders.
- ValueAreaHighLowWidth (default = 1) — the width of the value area top and bottom borders.
- ValueAreaRayHighLowWidth (default = 1) — the width of the value area top and bottom rays.
- ShowValueAreaRays (default = None) — can be set so that the value area's High and Low price levels are projected to the right side of the chart. Can be set to previous session, current, previous and current, all previous, or all.
- ShowMedianRays (default = None) — can be set so that the median is projected to the right side of the chart. Can be set to previous session, current, previous and current, all previous, or all.
- RaysUntilIntersection (default = Stop_No_Rays) — defines the way median and value area rays will be cut off when they meet the next trading session's price range:
- Stop_No_Rays — no rays are stopped anywhere.
- Stop_All_Rays — all rays are stopped at an intersection with the price of another session.
- Stop_All_Rays_Except_Prev_Session — all rays except the previous session's rays are stopped at an intersection with the price of another session.
- Stop_Only_Previous_Session — only rays of the previous session are stopped at an intersection with the price of another session.
- HideRaysFromInvisibleSessions (default = false) — if true, rays from sessions starting behind the left edge of the screen won't be displayed until you scroll back to them.
- TimeShiftMinutes (default = 0) — time shift for the sessions, in minutes. Positive value will move the session start to the left; negative — to the right.
- ShowKeyValues (default = true) — if true, Value Area High, Value Area Low, and Point of Control are displayed on the left of the market profile.
- KeyValuesColor (default = clrWhite) — the color for Value Area High, Value Area Low, and Point of Control printout.
- KeyValuesSize (default = 8) — the font size for Value Area High, Value Area Low, and Point of Control printout.
- ShowSinglePrint (default = No) — can be set to Leftside or Rightside and will mark the single print profile — a part of the profile, which is only one TPO wide.
- SinglePrintRays (default = false) — if true, single print edges are marked with rays.
- SinglePrintColor (default = clrGold) — the color for single print marking if ShowSinglePrint isn't set to No.
- SinglePrintRayStyle (default = STYLE_SOLID) — the single print ray line style.
- SinglePrintRayWidth (default = 1) — the single print ray line width.
- ProminentMedianColor (default = clrYellow) — the color for the prominent median (PPOC) if ProminentMedianPercentage is set to 100 or less.
- ProminentMedianStyle (default = STYLE_SOLID) — the style for the prominent median (PPOC) if ProminentMedianPercentage is set to 100 or less.
- ProminentMedianWidth (default = 4) — the width for the prominent median (PPOC) if ProminentMedianPercentage is set to 100 or less.
- ShowTPOCounts (default = false) — if true, TPO counts for the number of TPOs above and below the median (POC) are displayed to the right of the market profile.
- TPOCountAboveColor (default = clrHoneydew) — the color for the TPO count above the median (POC) if ShowTPOCounts is set to true.
- TPOCountBelowColor (default = clrMistyRose) — the color for the TPO count below the median (POC) if ShowTPOCounts is set to true.
- RightToLeft (default = false) — if true, the current session's market profile has its histogram drawn from right to left. In case Session is set to Rectangle, market profiles of all sessions are drawn right-to-left.
Performance
- PointMultiplier (default = 0) — the higher it is, the wider are the profile's price boxes and the fewer are the chart objects. You can use it to reduce the indicator's load on CPU. When the value is zero, an adaptive multiplier is used — the indicator attempts to calculate the optimal value automatically.
- ThrottleRedraw (default = 0) — a delay in seconds that will be applied before each redraw of the profiles. You can use it to reduce the indicator's load on CPU.
- DisableHistogram (default = false) — if true, no market profile histogram is drawn, but Value Area and Median are still marked. This makes indicator work extremely fast, but is less useful for thorough market analysis.
Alerts
- AlertNative (default = false) — if true, the indicator will issue the platform's native pop-up alert when some alert conditions are met.
- AlertEmail (default = false) — if true, MetaTrader's email alerts will be sent when some alert conditions are met. Email should be properly configured in MetaTrader via Tools->Options->Email
- AlertPush (default = false) — if true, MetaTrader's push notification alerts will be sent to your mobile device when some alert conditions are met. Notifications should be properly configured in MetaTrader via Tools->Options->Notifications. This alert type is not available in the cTrader version of the indicator.
- AlertArrows (default = false) — if true, MetaTrader will draw arrows on the chart when some alert conditions are met.
- AlertCheckBar (default = Previous) — controls the bar to check the alert conditions on. Current — the indicator will check the current unfinished bar; expect a lot of alerts. Previous — the indicator will check the previous (closed) bar; alerts will be delayed but more concise.
- AlertForValueArea (default = false) — if true, alerts will be issued whenever a Value Area ray (high or low) is crossed by the price.
- AlertForMedian (default = false) — if true, alerts will be issued whenever a Median ray is crossed by the price.
- AlertForSinglePrint (default = false) — if true, alerts will be issued whenever a Single Print ray is crossed by the price.
- AlertOnPriceBreak (default = false) — if true, alerts will be issued when the price breaks any of the trigger levels but then returns back behind it.
- AlertOnBarClose (default = false) — if true, alerts will be issued when the bar opens on one side the trigger level and closes on the other side of it.
- AlertOnGapCross (default = false) — if true, alerts will be issued when the trigger level appears inside a price gap between the last two bars.
- AlertArrowCodePB (default = 108) — arrow code for price break alert arrows.
- AlertArrowCodeCC (default = 110) — arrow code for candle close alert arrows.
- AlertArrowCodeGC (default = 117) — arrow code for gap crossover alert arrows.
- AlertArrowColorPB (default = clrRed) — arrow color for price break alert arrows.
- AlertArrowColorCC (default = clrBlue) — arrow color for candle close alert arrows.
- AlertArrowColorGC (default = clrYellow) — arrow color for gap crossover alert arrows.
- AlertArrowWidthPB (default = 1) — arrow width for price break alert arrows.
- AlertArrowWidthCC (default = 1) — arrow width for candle close alert arrows.
- AlertArrowWidthGC (default = 1) — arrow width for gap crossover alert arrows.
Intraday sessions
- EnableIntradaySessionN (default = true) — if true and Session is set to Intraday, then the indicator will attempt to drawn the intraday market profile #N on the chart.
- IntradaySessionNStartTime (default = "HH:MM") — start time in HH:MM format for the intraday session #N.
- IntradaySessionNEndTime (default = "HH:MM") — end time in HH:MM format for the intraday session #N.
- IntradaySessionNColorScheme (default = Blue_to_Red) — color scheme for the intraday session #N.
Miscellaneous
- SaturdaySunday (default = Normal sessions) — how to treat Saturday and Sunday sessions:
- Normal sessions — Saturday and Sunday will be treated as normal sessions with their own daily and intraday sessions.
- Ignore Saturday and Sunday — Saturday and Sunday candlesticks will be ignored.
- Append Saturday and Sunday — Saturday candlesticks will be appended to the Friday session; Sunday candlesticks will be appended to the Monday session.
- DisableAlertsOnWrongTimeframes (default = false) — if true, no pop-up alerts will appear on using Market Profile with wrong timeframe/session combination.
- ProminentMedianPercentage (default = 101) — percentage of TPOs out of all possible that should occur inside a median for it to be considered prominent (PPOC). For example, if you set it to 50%, a median will be marked as prominent if it contains at least 24 TPOs in a daily session on M30 timeframe. If it is set to 101, no prominent median is possible.
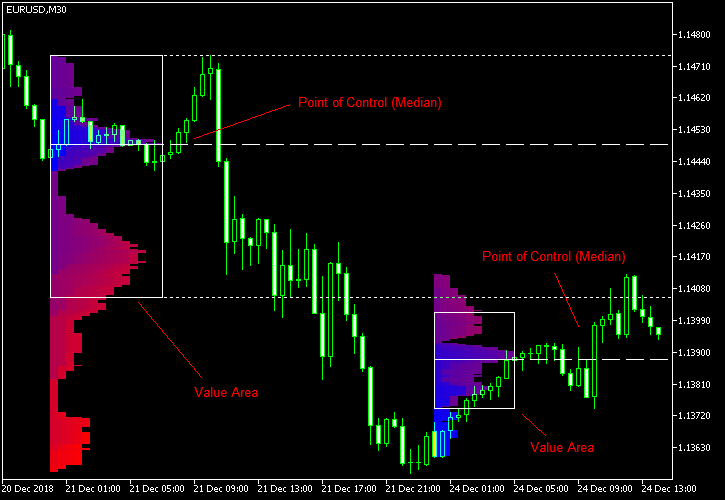
Daily sessions
The chart screenshot shows market profiles calculated and displayed for two daily Forex trading sessions. The timeframe is M30 and the right-hand daily session is still in progress. The earliest prices are blue and the latest prices are red. The medians and the value areas are marked with the white lines and display the most important price areas. Traders tend to return to those areas if the volume of the breakout movement is not too high. High-volume breakout out of these areas signifies a real breakout. You can read more about Market Profile in this short e-book:
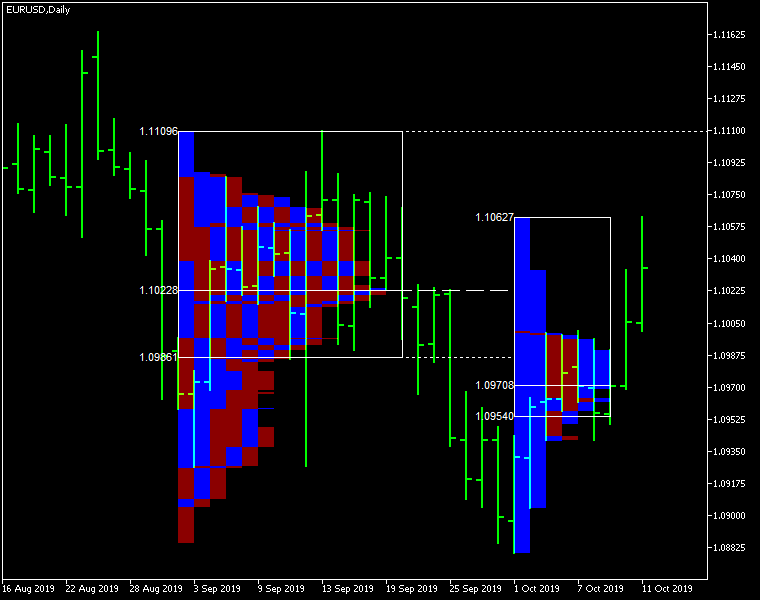
Bullish/bearish coloring
The example below demonstrates how the Market Profile can be colored according to the direction of each bar in the session rather than its age. This is done when ColorBullBear is set to true.
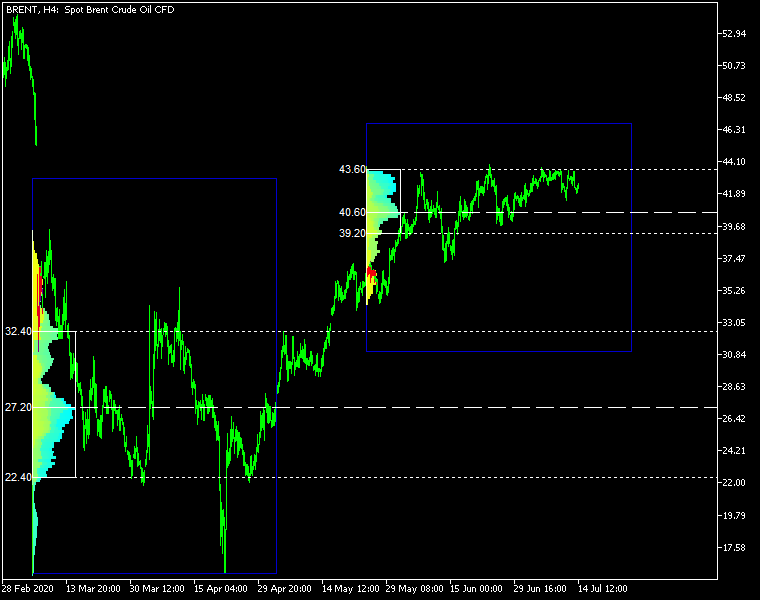
Rectangle sessions
This example demonstrates how the indicator can display a market profile based on the rectangle chart objects freely drawn by a trader. For this to work, a rectangle object's name has to start with MPR and the Session input parameter has to be set to Rectangle. You can press 'r' on your keyboard to add such a rectangle to the chart automatically.
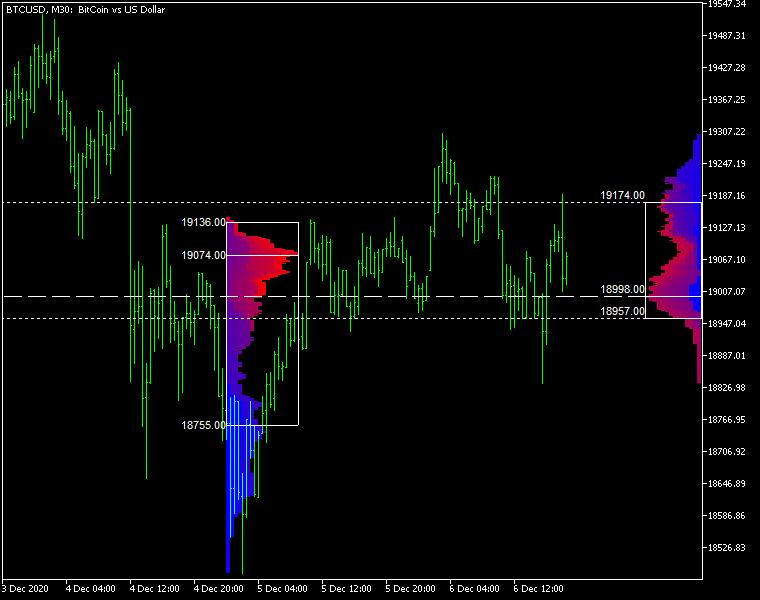
Right-to-left display
Market Profile indicator can also draw histogram from right to left. Unlike the traditional left-to-right display, it can be helpful to focus on the current trading session, without obscuring its chart. You can see how this works in the chart screenshot below.


")
")
![[XAUUSD]: Weekly Liquidity Activation Points (timings), June 22-26, 2026](https://c.mql5.com/6/1013/splash-preview-771790.png "[XAUUSD]: Weekly Liquidity Activation Points (timings), June 22-26, 2026")