

The indicator Strong Trends With Magic Entries is a wonderful tool to enter into strong moving trends at a point where the trend continues with extremely high probability!
I have written a lot about the concepts and inner workings of this indicator. You can read everything you need to know about the concepts of the blue and orange line of the indicator in the following two PDF-files:
1_How_To_Spot_Perfect_Momentum_Setups.pdf
2_Perfect_Momentum_Javelin_Comparison.pdf
The purpose of this blog is to educate you further with real-chart examples AND I will show you how you can combine setups of lower time frames with edges of bigger time frames to boost the performance of the system dramatically.
I'm happy to answer your questions in the comments section of this blog. And if it makes sense, I can address the questions within a new blog post.
TIP: When using the system "Strong Trends With Magic Entries" you should always ZOOM OUT to see a bigger portion of the trend on the charts!
![]()
Blog Entry 25th March 2018
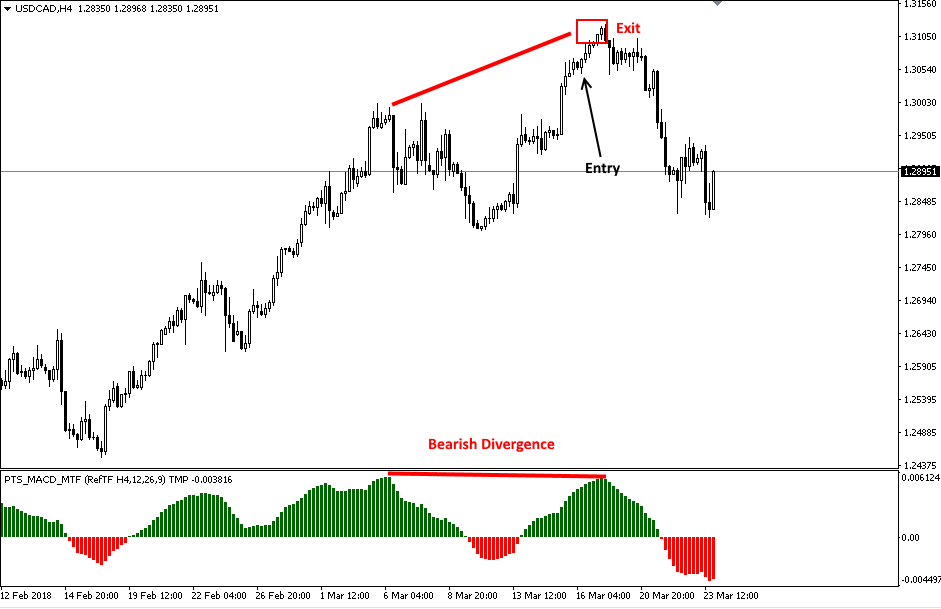
On 16th March you could have done a long entry on USDCAD on the time frame M15. As you can see the impulse move was perfect, which means that the blue line moved together with the strong moving price. As soon as the price started moving sidewards the blue and orange line were moving higher. The strength of the blue and orange line were perfect at this setup. Without an additional edge from the bigger picture (higher time frame) you should not go for a big winning trade. An exit anywhere within the red rectangle would be fine.

If we look at the bigger picture on the time frame H4 during this setup then we can see that a bearish MACD divergence existed on H4 at the moment when the long setup on M15 occurred. Therefore, the situation on the bigger picture did even talk against the long trade on M15. So if you really want to trade the long trade on M15 then you should at least go for a conservative small target.
BTW: You can detect such divergences very easy with the indicator MACD Multi Time Frame.
Now I will show you why a SETUP is more important than a SIGNAL! :)
With SETUP I mean the bigger picture. With the SIGNAL I mean the chart of the lower time frame which produces the entry signal. The better the SETUP quality is, the less important the SIGNAL quality will be.
I always advocate to trade an edge of the bigger picture combined with an edge of a lower time frame!
Therefore, the best option on USDCAD would have been to wait patiently until a short entry signal occurs in direction of the MACD divergence on H4. The power of the edge of the bigger picture will on average produce bigger winning trades on the lower time frames and you will have a higher winning percentage.
During a H4 divergence a signal on M1, M5 and M15 can occur. During this bearish divergence a short signal on the time frame M5 occurred in the area labeled with the black arrow in the following screenshot:

When we look at the M5 chart then we can see that there was an impulse move to the downside. The impulse move was not extremely strong because the orange line started leading the price late during the sideward phase of the price. This short signal on M5 looks looks less strong than the long signal on M15 from the example above. But with the additional power of the edge of the bigger picture (the bearish H4 MACD divergence) we know that this M5 signal is a lot better than the good looking M15 long signal from the example above.
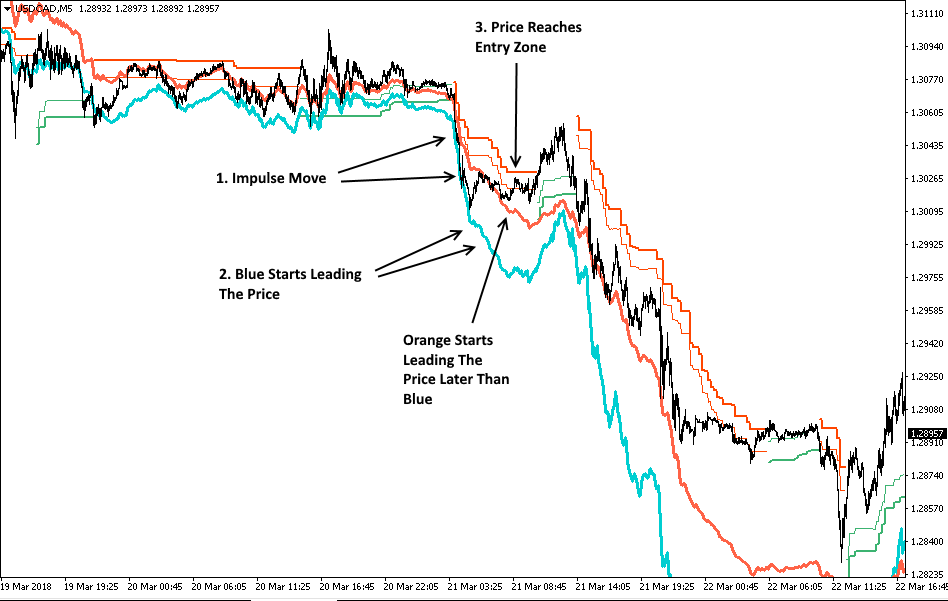
The M5 short signal could have been traded with a wide stop as shown in the following screenshot. Because we can expect a big move to the downside because of the additional power from the H4 divergence, we could have exited anywhere in the green rectangle in the following screenshot:

![]()


")
![[XAUUSD]: Weekly Liquidity Activation Points (timings), June 22-26, 2026](https://c.mql5.com/6/1013/splash-preview-771790.png "[XAUUSD]: Weekly Liquidity Activation Points (timings), June 22-26, 2026")
