

Table of contents
- Introduction
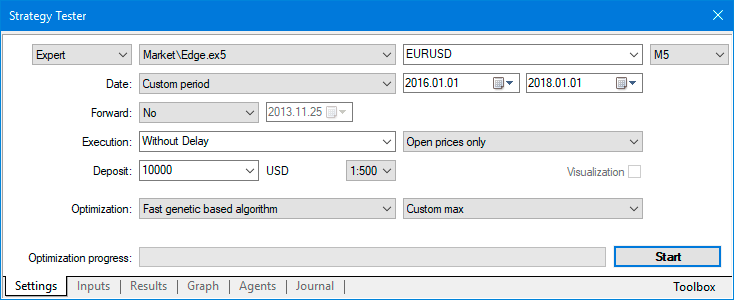
- Tester settings
- Expert settings for parameter optimization
- Which symbols should be selected for trading?
- How much time a single expert test takes in strategy tester?
- How long is parameter optimization on the computer?
- How long is parameter optimization on the cloud?
- Multi-symbol charts for test result analysis
- Test results and set-files for repeating the results
When working with EDGE it is important to keep in mind that using as many data for parameter optimization as possible is recommended. This is substantiated by the fact that for consistent results one should undergo a test with as many examples of price recoilless movement as possible. Why more of those examples are required? Because the structure of unidirectional movements is very varied and the only way to select consistent parameters is to go through as many of such examples as possible. EDGE trade expert contains all the necessary settings to select such combinations and to consider all the unpredictable outcomes. Signals are calculated on the current chart timeframe, on which the expert is downloaded. You can use it on any timeframe, but before that, one must find optimal parameters for that timeframe.
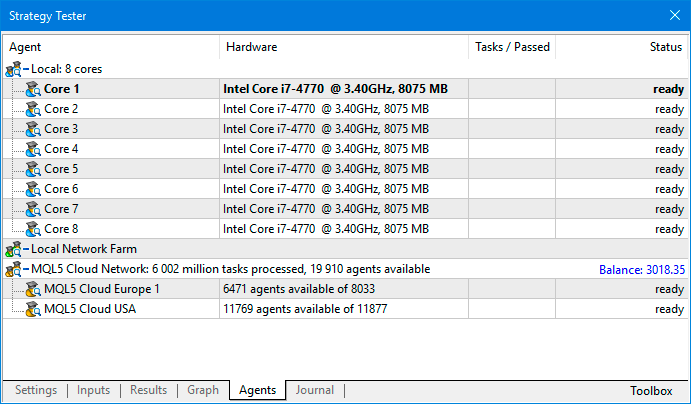
Absence of required resources for finding such combinations may turn out to be one of essential hindrances on your way. For doing this, you need a computer with a big volume of RAM as well as a many-core processor which cores will be engaged maximally during parameter optimization in strategy tester. Those, who can afford assembling a network of computers which will simultaneously participate in optimization, will have even a greater advantage. Also, using MQL5 Cloud Network service from MetaQuotes would be a great opportunity. For a reasonable payment one could perform optimization, using resources of thousands of computers globally.
It would be a mistake to think that for five-minute (M5) or one-minute (M1) timeframes, one or two years of data would be sufficient for searching optimal parameters. A “the more - the better” rule works here. There is never too much of data. The algorithm must be tested on all the data available and it is about hundreds of thousands of transactions. If the trader has serious intentions to earn, instead of losing his deposit, his job is to get prepared for it maximally.
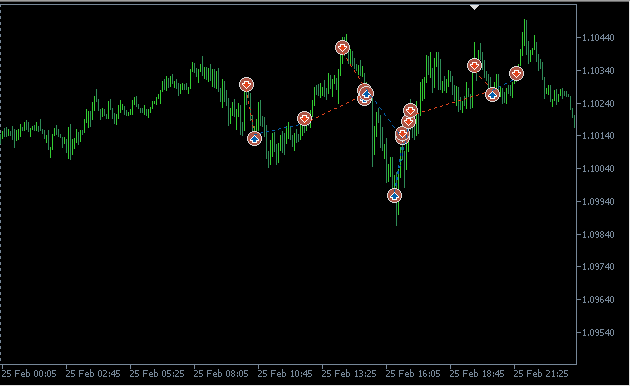
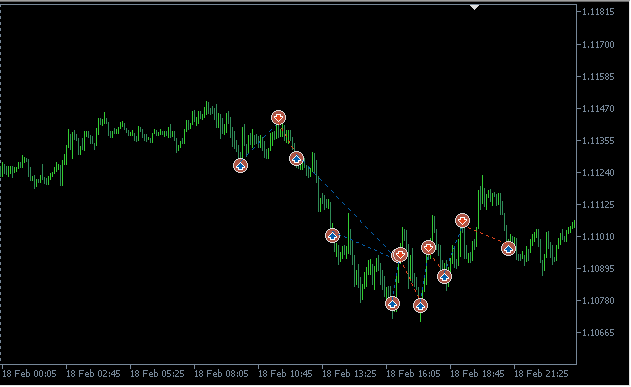
Why do we need more data? This is caused by the fact that on the time range selected for optimization, the required examples on which problems begin, simply might be not available. As we have stated already, there are recoilless unidirectional movements of various types. You can make sure in it by yourselves, simply analyzing test results in visualization mode, looking in detail through the process of deal making on a multitude of recoilless movements. Suppose, you have chosen a time range for optimization for the last year. However, this period could be calm enough, with prevalence of lateral price movements. Even if there were trends, they were with quite big rollbacks. There is no difficulty to set the expert on such price behavior. But this is a mistake to think that it will contiue this way. Immediately after the optimization period, prolonged recoilless unidirectional movement can start and your “optimal” settings will be not relevant at all. Due to that very reason, forward-testing is not the proper method to use for checking and searching optimal parameters. This method is always worse than that used when you conduct optimization on all the available data. Many cannot pass this test because they fail to get interesting results on large series of trades.
As well, it is important to realize that historical data with many brokers might have different properties. Even the same broker and on the same type of account may have different properties of data. For instance, on several years in the very beginning of historical data there may be spreads of less size. Whereas, the last year of data and on the same symbols may contain spreads of bigger size. We observe a slant towards the period when spread was less. And the earlier optimized parameters do not already fit to new data. Therefore, parameters must be optimized more often. Even the moments when manipulations over historical data are carried out must be taken into account. For this purpose, you must study all the available data provided by the broker with whom you are going to open an account for trading and further to make double checks for changes.
Unfortunately, historical data do not contain such changes as stop / limit levels. This can also have substantial effect. To reduce such effect parameters may be optimized on larger timeframes. In such a case, the best option is to choose the broker having more minute data for building the timeframe we need, as well as real tick data for final tests. Besides, the best broker for you will be the one having no stop / limit levels, no commissions and spread is minimal on the plenty of various symbols. The perfect variant for parameter optimization would be a possibility to use the same symbols but from different brokers with different conditions. Probably, this is even the only way to obtain really consistent combinations of parameters for various types of trade algorithms. But, unfortunately, for now it is difficult-to-implement. It is quite possible that such feature will be available in future versions of MetaTrader 5.
Parameters of EDGE expert allow to set both conservative and aggressive trade types. If you want to trade with minimal risks and plan to attract investors using Signals service or PAMM-account, then your choice is conservative trade type. If you prefer quick deposit growth and know when currencies are in a long flat (lateral price movements), your choice is aggressive trade type. You can find such combination of parameters where trading with strong risk you will double the deposit for several times, each time withdrawing the profit received. And, whereas, only once having lost the initial deposit already having several earned deposits of such amount in stock.
Further, we will consider in detail certain important moments for working with EDGE trading algorithm.
Currently, the best option is to optimize parameters in Open price only mode, so far as you considerably cut optimization time. After conducting optimization, having chosen the parameter combinations you are interested in and having saved them in set-files, you should make tests in mode Real ticks (Every tick based on real ticks). As a rule, test outcomes in both modes are practically identical. If no, you should search reasons for serious incompliance in test visualization mode.
EDGE expert provides a feature to optimize parameters by user’s criteria. This is an improved version for selecting optimal parameters, which allows to find the most effective parameter combinations and to display them in upper lines of optimisation results. In order to use it, select Custom max in the drop-down list of optimization modes (see screenshot below).
The below screenshot shows an example of one of the possible variants for expert parameter optimization.
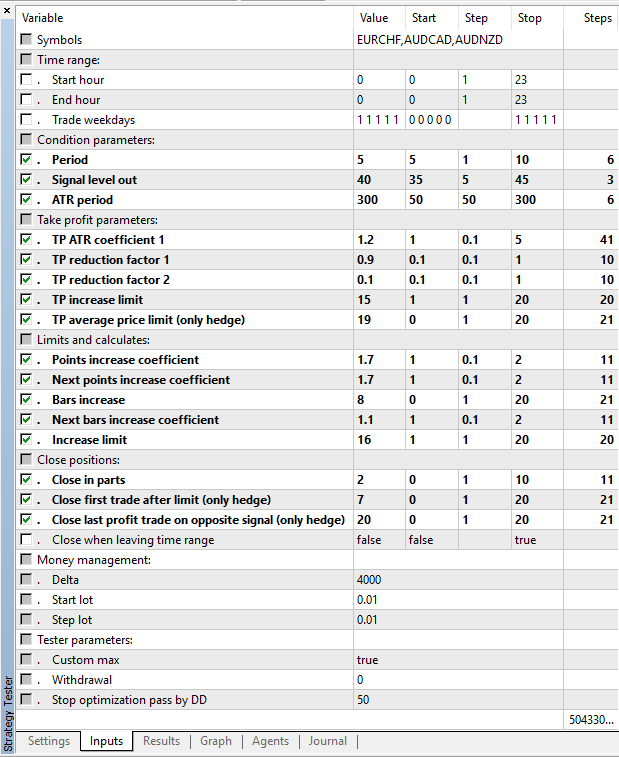
You can find a detailed description of parameters on EDGE application page in the market. Here, let’s consider which parameters should be chosen for optimization in strategy tester.
The parameters not intended for optimization are designated by inactive check-boxes. Also, these parameters have no feature of specifying ranges: start, step, stop. Therefore, they must be set manually. The below screenshot shows an example of recommended parameter ranges for optimization. Once the parameter combination is selected, these ranges may be narrowed a little and we can look which results are received in the vicinity of those values. Pay attention that there are parameters which are used only for accounts of Hedge (only hedge) type. If you have an account of Netting type, these parameters should not be used during optimization and tests, because they exert no influence over the result.
Let us consider more closely some parameters which require explanation.
If in Symbols parameter a blank line is available which means that symbols are not specified through comma (example: EURUSD,GBPUSD,USDJPY), in tests only the current symbol on which the expert is set will be used.
Setting of time range for trading looks as follows:
For example,
- Start hour = 10
- End hour = 20
The expert will start working from 10 by server time. It will work until 20, inclusively. It will bring the position to closing with profit and after closing it will not open new positions until 10 hours. In such case, position closing may take place substantially later than 20 hours. This may happen at 21, 22, 23, etc.
If you set Close when leaving time range parameter to true mode, when exiting the specified time range, the position will be closed forcedly with the current result, as is. At above specified settings of time range (Start hour: 10, End hour: 20), all the positions will get closed at 21.
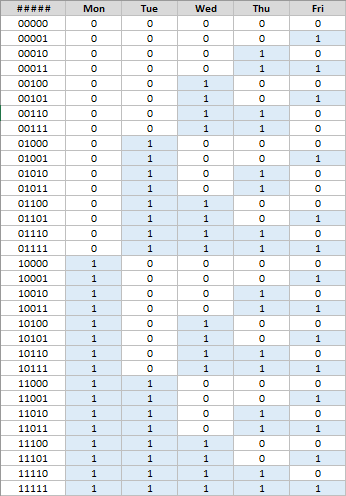
Let us look how trade days of the week are set. In the list of choice of Trade weekdays parameter, consequencies are provided, where weekdays included for trading are designated as one. For example, if choosing the sequence variant 0 0 0 0 1 from the list, this will mean that deals should be concluded only on Friday. The variant when only ones are set in the sequence - 1 1 1 1 1, will mean that all the days are selected for trading.
The complete table of variants with designation of weekdays is provided in the below screenshot:
If in tester settings you choose the user criterion for parameter optimization and in the expert - Custom max parameter to set true, then in upper results of optimization there will be the best parameter combinations with the minimal drawdown, which group with a number of other positive statistical values of the test.
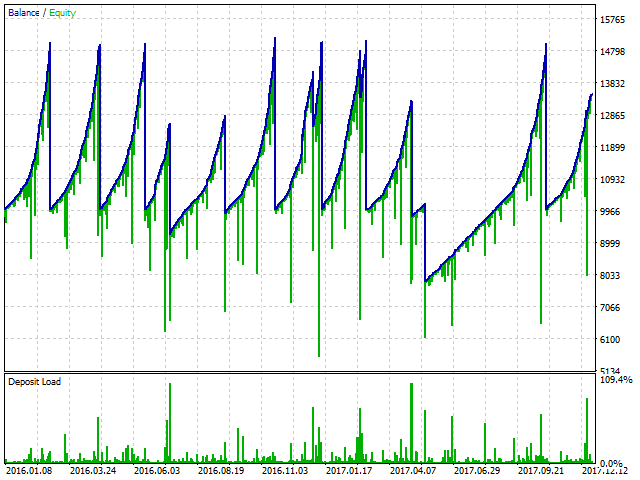
Parameter Withdrawal allows to simulate funds withdrawal, once the specified profit is achieved. Thus, you may work out own strategy for aggressive trading which, in the end, may reveal more interesting results with higher profit. The below screenshot displays a result when Withdrawal is set with the value of 5000.
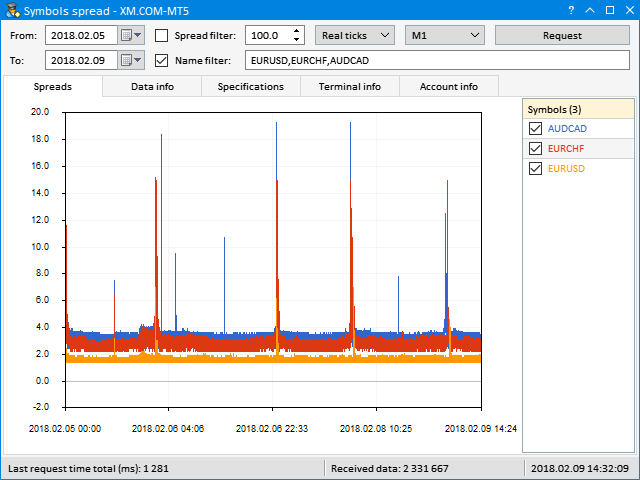
Using Symbols spread application you can easily and quickly look through key parameters of a variety of forex-symbols on your forex-broker’s server and to choose between the ones most fitting for your trade. This is specifically actual if a decision was made to apply one or another trading algorithm on short timeframes, where a big deal frequency is implied and trading levels should be set close to the current price. The fact is different brokers set their own values for such indices as spread and stop / limit levels. The shorter the timeframe is, the more these indices will influence the final result of trading. Symbols spread program might be useful for each trader who considers intraday trading for the purpose of gaining maximal profit.
The program will select symbols by user set criteria. Besides the time range filter, you can use filters for specifying the limit by spread amount (Spread filter) and by symbol name (Name filter). As well, the data type may specified: Bars (bars) or Real ticks (real ticks). If Bars data type is selected, then you might specify which timeframe should be used for viewing the spread in historical data.
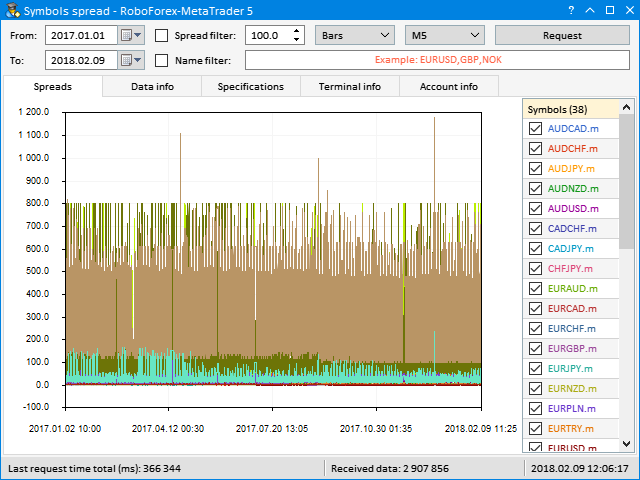
Let’s see which conditions are provided by broker RoboForex. Let’s request historical data for the last year, data type - Bars, timeframe M5 (five minutes). Once the criteria are specified, press Request button. After a while, the program will download from the broker server the data missing on your hard drive. Then it will generate series by the specified timeframe and conduct synchronization.
In the end, you see a result similar to the below shown on application chart (see screenshot below). The program has downloaded data by 38 symbols available for trading. It is obvious that many of them do not fit at all for trading due to huge spread.
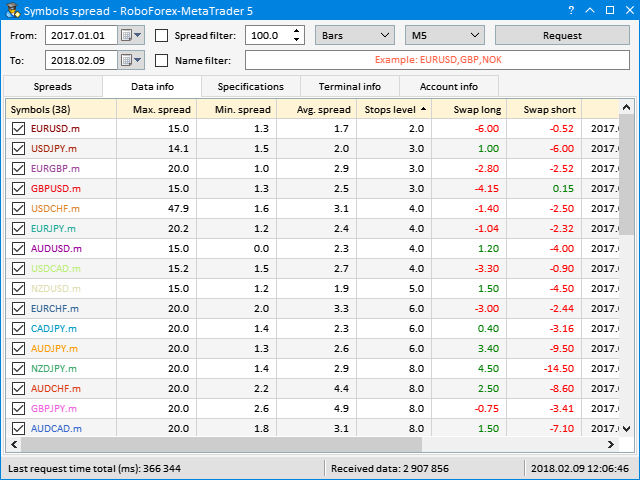
Let’s skip to Data info tab. In this section you can see more detailed data on all the symbols in table representation. Totally, the table has 10 columns of data:
- Symbols – the symbols which data are obtained for analysis.
- Max. spread - maximal spread for the specified period.
- Min. spread - minimal spread for the specified period.
- Avg. spread - average spread.
- Stops level - stop / limit levels.
- Swap long - swap for long positions.
- Swap short - swap for short positions.
- First date - the first date in the array of received data.
- Last date - the last date in the array of received data.
- Received data - how much data (bars/ticks) was received and displayed on the chart in expert Symbols spread.
For easy search of the symbols fitting for trading, values in all the columns may be sorted out. The below screenshot shows table sorting by values in Stops level.
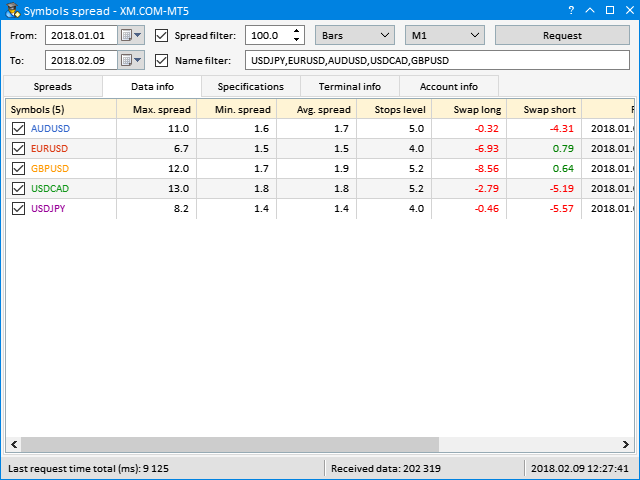
Now, let’s try obtaining data from broker XM. Let’s request data by minute (M1), but this time - only for the last several weeks. As a result, the program has downloaded data by 54 symbols. As well, it is obvious that many of them are no good for trading due to too large spread.
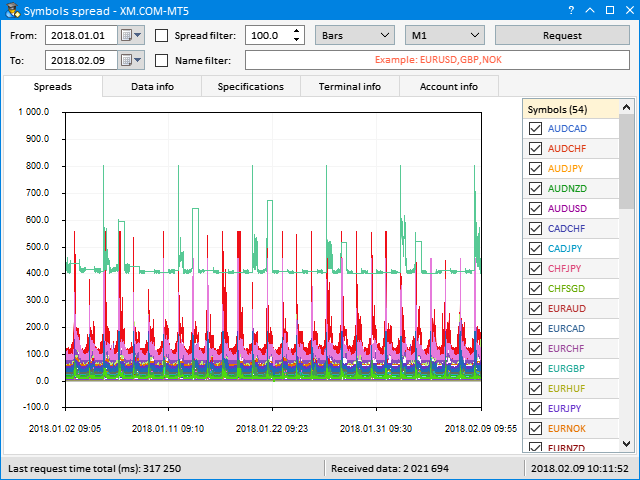
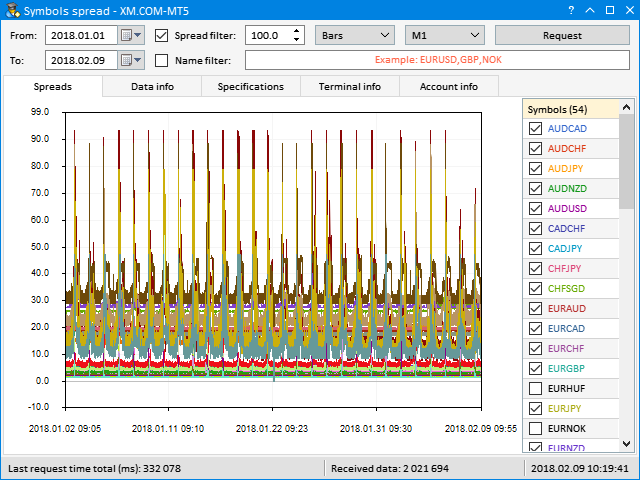
Let’s try excluding from this set all the symbols which maximal spread exceeds 100 points.
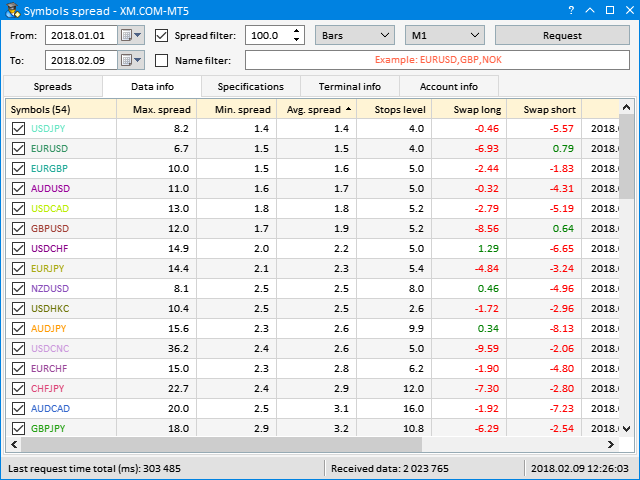
Let’s see details at Data info tab. Let’s sort out data by average spread, in ascending order.
Suppose, 5 symbols for trading should be selected. Let’s pick up from this list the following symbols for data view: USDJPY, EURUSD, AUDUSD, USDCAD, GBPUSD.
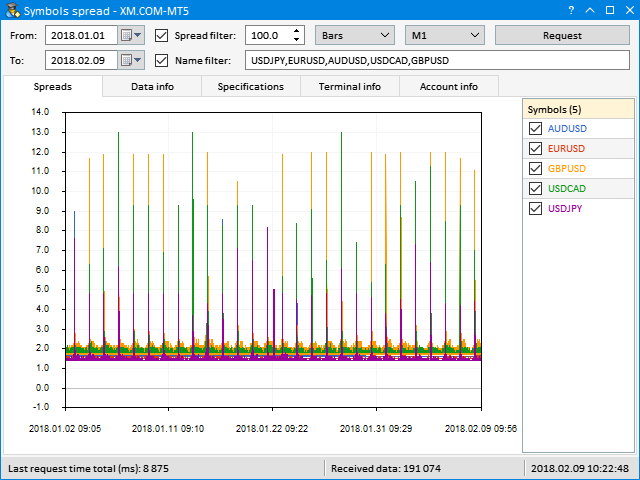
By the last act, request tick data of these symbols and see the result:
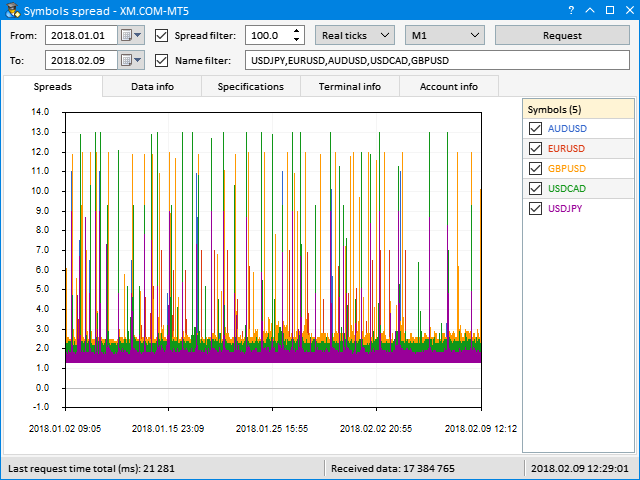
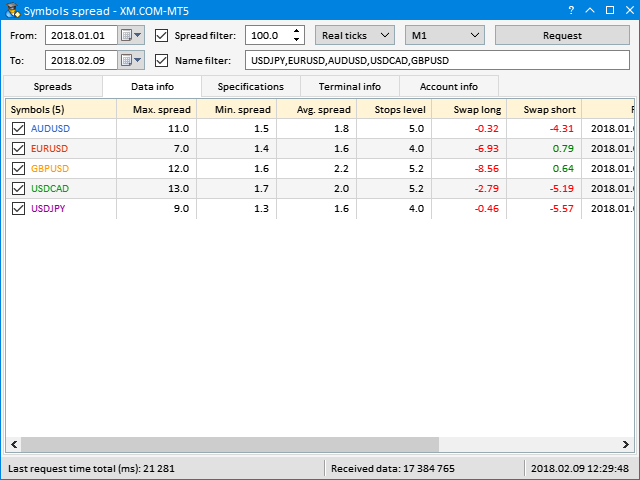
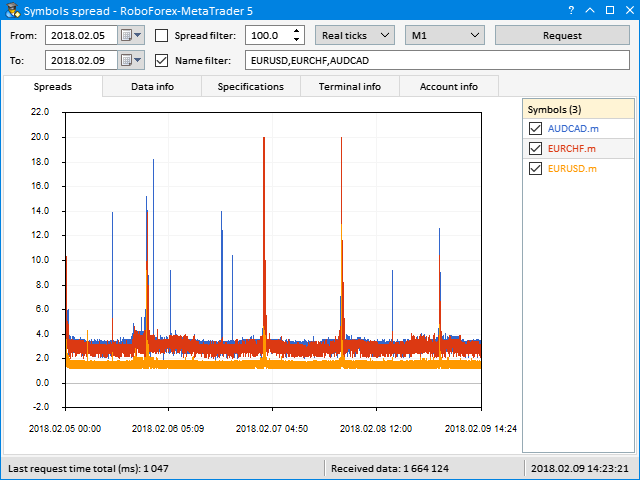
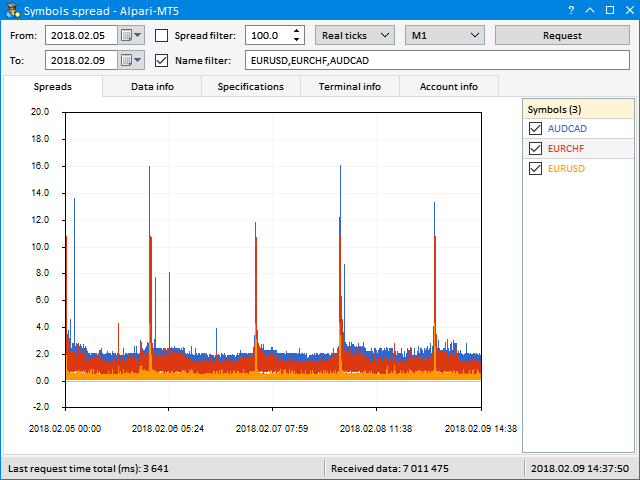
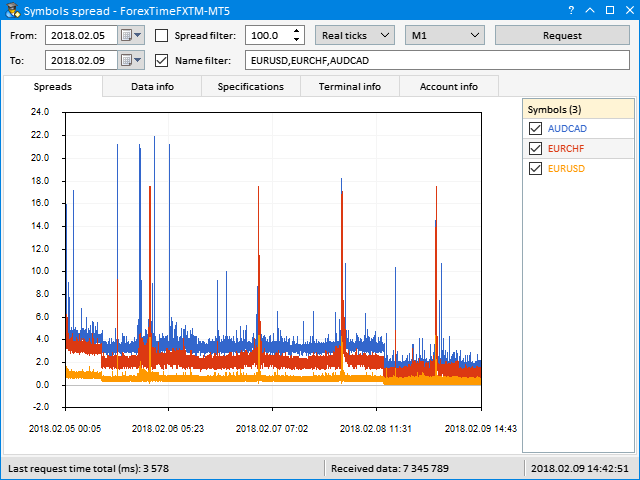
Very often something which is specified on broker’s web-site in symbol specifications, substantially contradicts to what they have in fact. Therefore, check everything by yourself. As an example, we can provide more data to see how much conditions of various brokers differ. Screenshots below demonstrate spreads for comparison by same symbols. Pay attention, that extension of spread during night-time may very much effect the result.
Once we have defined the choice of symbols for trading, we may proceed to expert testing in strategy tester.
As an example, here are test outcomes in Open price only mode. Timeframe M5 (five-minute data). Type of account Hedge. Time range is one year (2017.01.01 - 2018.01.01).
Symbol: EURUSD
EURUSD,M5: 281877 ticks, 74300 bars generated. Test passed in 0:00:01.453.
282883 total ticks for all symbols
EURUSD: passed to tester 282883 ticks
466 Mb memory used including 8 Mb of history data, 64 Mb of tick data
The outcomes of the test above show that for a one-year period the test on one symbol lasts for 1-1.5 seconds.
Now, try to make a test of the currency pair which has no account currency. For example, if you have an account in US Dollars (USD), for making the test take a symbol without USD. For example, EURCHF. The fact is, that for correct calculations of margin requirements and profit, in such case symbols EURUSD and USDCHF will be used in the test. In its turn, this will increase the test time.
Symbol: EURCHF
EURCHF,M5: 281063 ticks, 74273 bars generated. Test passed in 0:00:01.860.
846826 total ticks for all symbols
EURCHF: passed to tester 282468 ticks
EURUSD: passed to tester 282883 ticks
USDCHF: passed to tester 281475 ticks
467 Mb memory used including 8 Mb of history data, 64 Mb of tick data
As we can see, a test for cross-rates will be approximately twice longer. Here, the test took 1.5-2 seconds. Now, let’s try conducting a test on several symbols.
Symbols: EURUSD,GBPUSD,USDJPY
EURUSD,M5: 282881 ticks, 74300 bars generated. Environment synchronized in 0:00:00.031. Test passed in 0:00:07.172.
EURUSD,M5: total time from login to stop testing 0:00:07.203 (including 0:00:00.031 for history data synchronization)
853054 total ticks for all symbols
EURUSD: passed to tester 282883 ticks
GBPUSD: passed to tester 285067 ticks
USDJPY: passed to tester 285104 ticks
628 Mb memory used including 26 Mb of history data, 64 Mb of tick data
Symbols: EURCHF,AUDCAD,AUDNZD
EURCHF,M5: 282465 ticks, 74273 bars generated. Environment synchronized in 0:00:00.031. Test passed in 0:00:12.109.
EURCHF,M5: total time from login to stop testing 0:00:12.140 (including 0:00:00.031 for history data synchronization)
2264405 total ticks for all symbols
AUDCAD: passed to tester 284995 ticks
AUDNZD: passed to tester 285398 ticks
AUDUSD: passed to tester 282069 ticks
EURCHF: passed to tester 282468 ticks
EURUSD: passed to tester 282883 ticks
NZDUSD: passed to tester 282153 ticks
USDCAD: passed to tester 282964 ticks
USDCHF: passed to tester 281475 ticks
854 Mb memory used including 26 Mb of history data, 192 Mb of tick data
When testing several symbols the speed test falls. Unfortunately, now it is impossible to perform without losing in test accuracy. But, as we mentioned before, terminal developers in the nearest updates will extend features of MQL5, having added a feature of conducting multi-symbol tests several-fold faster.
As an example, try optimizing the parameters on data of Alpari broker on different symbols in Open price only mode. Timeframe M5 (five-minute data). Type of account Hedge. Time range is one year (2017.01.01 - 2018.01.01). Expert settings were demonstrated in the section above: Expert settings for parameter optimization
Symbol: EURUSD
result cache used 7953 times
genetic optimization finished on pass 15616 (of 504330836375520000)
optimization done in 28 minutes 56 seconds
local 7663 tasks (100%), remote 0 tasks (0%), cloud 0 tasks (0%)
Symbol: EURCHF
result cache used 2507 times
genetic optimization finished on pass 8704 (of 504330836375520000)
optimization done in 32 minutes 50 seconds
local 6197 tasks (100%), remote 0 tasks (0%), cloud 0 tasks (0%)
Symbols: EURUSD,GBPUSD,USDJPY
result cache used 9892 times
genetic optimization finished on pass 18176 (of 504330836375520000)
optimization done in 2 hours 15 minutes 03 seconds
local 8284 tasks (100%), remote 0 tasks (0%), cloud 0 tasks (0%)
Symbols: EURCHF,AUDCAD,AUDNZD
result cache used 7281 times
genetic optimization finished on pass 13312 (of 504330836375520000)
optimization done in 3 hours 13 minutes 37 seconds
local 6031 tasks (100%), remote 0 tasks (0%), cloud 0 tasks (0%)
Very soon terminal MetaTrader 5 will be updated and testing & optimization speed will be several-fold faster. Probably, then we can conduct optimization even in All ticks mode. Besides, using MQL5 Cloud Network service will become more beneficial because optimization speed will increase.
To compare, try conducting optimization with the same parameters as in MQL5 Cloud Network. The use of the service is paid. After each optimization, record the amount of funds frozen to pay for the service.
In this test, in order to speed up optimization, use simultaneously both local processor cores and cloud agents.
Symbol: EURUSD
result cache used 6416 times
genetic optimization finished on pass 13568 (of 504330836375520000)
optimization done in 6 minutes 41 seconds
local 587 tasks (7%), remote 0 tasks (0%), cloud 6966 tasks (92%)
Funds frozen:
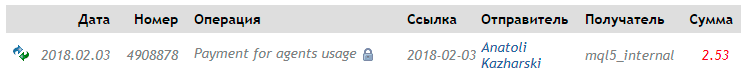
As you see, optimization was done much faster (6 min. 41 sec.), than last time, but only on the local computer (28 min. 56 sec.).
Symbol: EURCHF
You may face a situation when the service does not accept tasks for optimization into the net for a long time. This is caused by the fact that agents need time to download necessary data on the required symbols. This is what happened in this case. After long wait you may stop the optimization process. The log will have the records as shown below. There were no calculations in the cloud, thus funds will not be drawn.
result cache used 0 times
genetic optimization finished on pass 395 (of 504330836375520000)
optimization done in 10 minutes 13 seconds
local 395 tasks (100%), remote 0 tasks (0%), cloud 0 tasks (0%)
Let’s try starting optimization on this symbol once again.
result cache used 8510 times
genetic optimization finished on pass 16640 (of 504330836375520000)
optimization done in 22 minutes 14 seconds
local 543 tasks (6%), remote 0 tasks (0%), cloud 7434 tasks (93%)
This time the process proceeded, but the result was not impressive. Optimization time was 22 min. 14 sec., whereas, the last time (but only on the local computer) this took 32 min. 50 sec. In fact, this is connected with the process of data download by agents in the network. Advantage will be on larger tasks and in Slow complete algorithm mode.
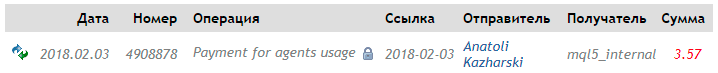
Funds frozen:
Now, let’s see whether it makes sense to start optimization in a cloud with several symbols.
Symbols: EURUSD,GBPUSD,USDJPY
result cache used 7294 times
genetic optimization finished on pass 15360 (of 504330836375520000)
optimization done in 24 minutes 56 seconds
local 480 tasks (5%), remote 0 tasks (0%), cloud 7680 tasks (94%)
Optimization time was 24 min. 56 sec., whereas, the last time (but only on the local computer) this took 2 hr. 15 min. 3 sec. In this case advantage is already obvious.
Funds frozen:

Symbols: EURCHF,AUDCAD,AUDNZD
This time optimization in the network did not start for a long time, as well. Local agents were working all this time. To realize what is going on, see the log (see listing below). Once all the agents in the network which can conduct optimization for you, download the necessary data, optimization will start.
authorized (server build 1755)
cloud server MQL5 Cloud Europe 1 selected for genetic computation
connected
common synchronization completed
authorized (server build 1755)
AUDCAD: history for 2009 year synchronized
AUDCAD: history for 2010 year synchronized
AUDCAD: history for 2011 year synchronized
AUDCAD: history for 2012 year synchronized
AUDCAD: history for 2013 year synchronized
AUDCAD: history for 2014 year synchronized
AUDCAD: history for 2015 year synchronized
AUDCAD: history for 2017 year synchronized
AUDCAD: history for 2018 year synchronized
AUDCAD: history synchronization completed [19967 Kb]
AUDCAD: 19.50 Mb of history processed in 0:04.062
AUDNZD: history for 2012 year synchronized
AUDNZD: history for 2013 year synchronized
AUDNZD: history for 2014 year synchronized
AUDNZD: history for 2015 year synchronized
AUDNZD: history for 2017 year synchronized
AUDNZD: history for 2018 year synchronized
AUDNZD: history synchronization completed [12301 Kb]
AUDNZD: 12.01 Mb of history processed in 0:03.281
AUDUSD: history for 1999 year synchronized
AUDUSD: history for 2000 year synchronized
AUDUSD: history for 2001 year synchronized
AUDUSD: history for 2002 year synchronized
AUDUSD: history for 2003 year synchronized
AUDUSD: history for 2004 year synchronized
AUDUSD: history for 2005 year synchronized
AUDUSD: history for 2006 year synchronized
AUDUSD: history for 2007 year synchronized
AUDUSD: history for 2008 year synchronized
AUDUSD: history for 2009 year synchronized
AUDUSD: history for 2010 year synchronized
AUDUSD: history for 2011 year synchronized
AUDUSD: history for 2012 year synchronized
AUDUSD: history for 2018 year synchronized
AUDUSD: history synchronization completed [443 Kb]
AUDUSD: 443.03 Kb of history processed in 0:00.203
USDCAD: history for 2018 year synchronized
USDCAD: history synchronization completed [172 Kb]
USDCAD: 172.52 Kb of history processed in 0:00.609
As the result, optimization was completed for 1 hr. 19 min. 49 sec. Whereas, the last time (but only on the local computer) this took 3 hr. 13 min. 37 sec.
result cache used 8734 times
genetic optimization finished on pass 18176 (of 504330836375520000)
optimization done in 1 hours 19 minutes 49 seconds
local 823 tasks (8%), remote 0 tasks (0%), cloud 8709 tasks (91%)
Funds frozen:
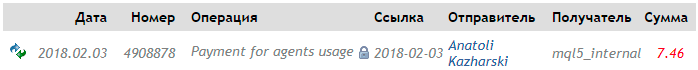
As the result, for the four optimization processes we have USD 7.46. The below table shows consolidated data. Instead of 6-7 hours optimization took 2 hours 13 minutes which is approximately three-fold less.
| Symbols | Value ($) | Time in cloud | Time on computer |
|---|---|---|---|
| EURUSD | 2.53 | 0:06:41 | 0:28:56 |
| EURCHF | 1.04 | 0:22:14 | 0:32:50 |
| EURUSD,GBPUSD,USDJPY | 1.11 | 0:24:56 | 2:15:03 |
| EURCHF,AUDCAD,AUDNZD | 2.78 | 1:19:49 | 3:13:37 |
| Totally: | 7.46 | 2:13:40 | 6:30:26 |
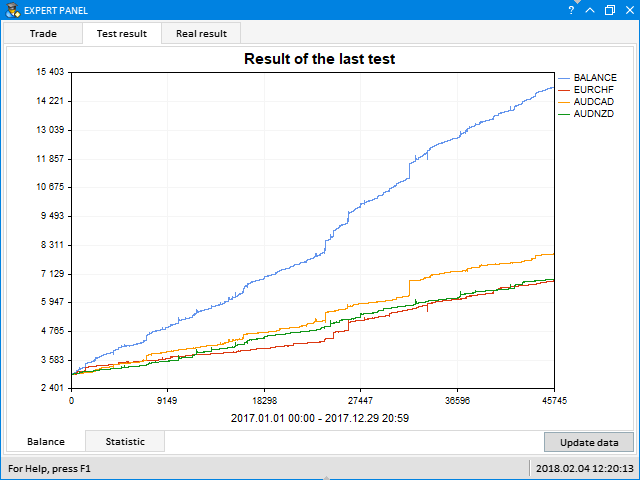
Strategy tester shows only the general chart of balance and funds for all the symbols which participated in the test.
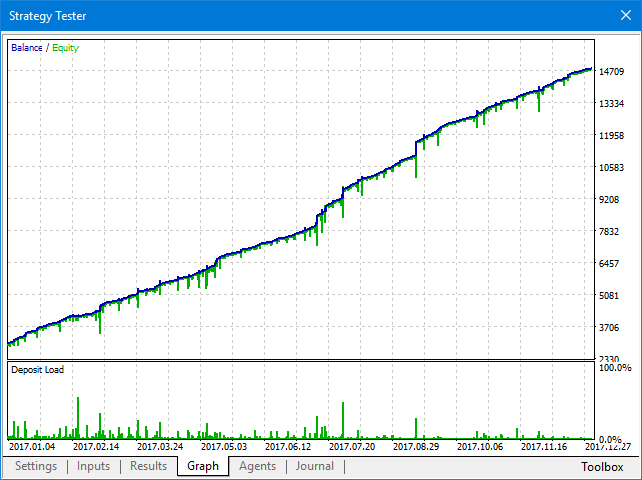
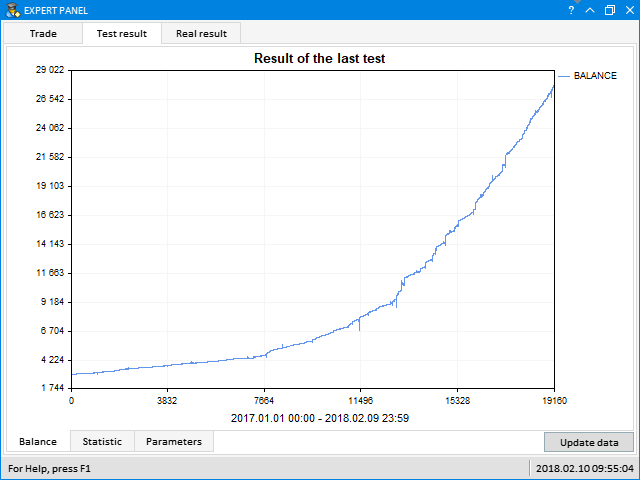
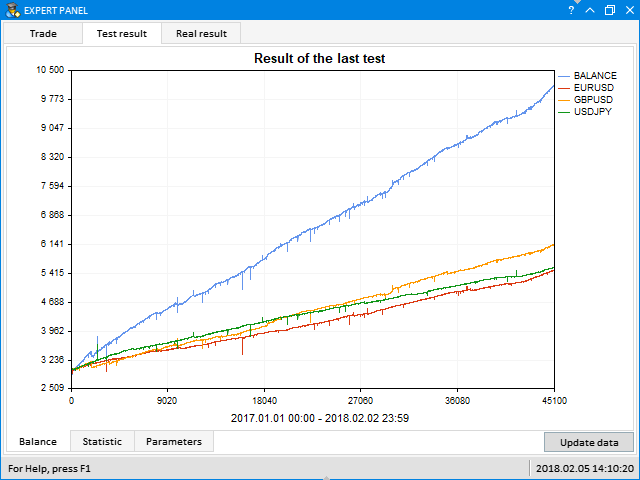
For more detailed analysis, a feature of viewing test results in multi-symbol mode is provided - when the chart demonstrates balance lines by all the symbols which participated in the test. For doing this, simply start EDGE on any open chart in the terminal and skip to Test result tab, as shown on the below screenshot. The second group of tabs will open where you can look through test results. To download and update results, press Update data.
On Balance tab you can see multi-symbol balance chart:
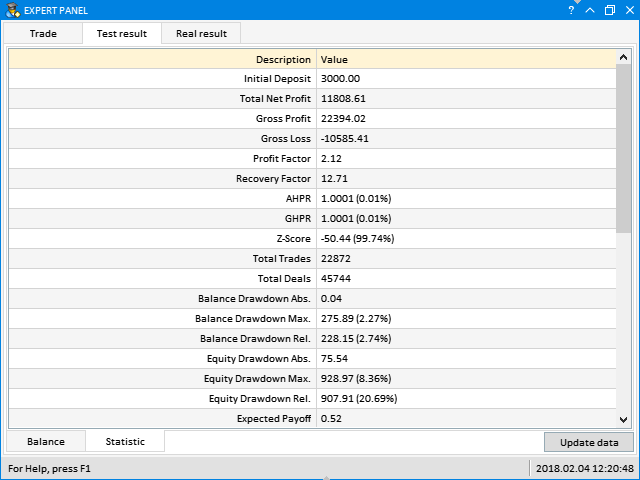
Statistics of test results are available on Statistic tab:
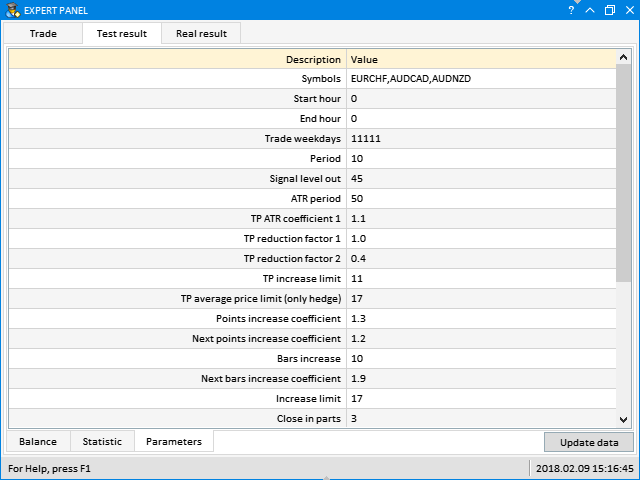
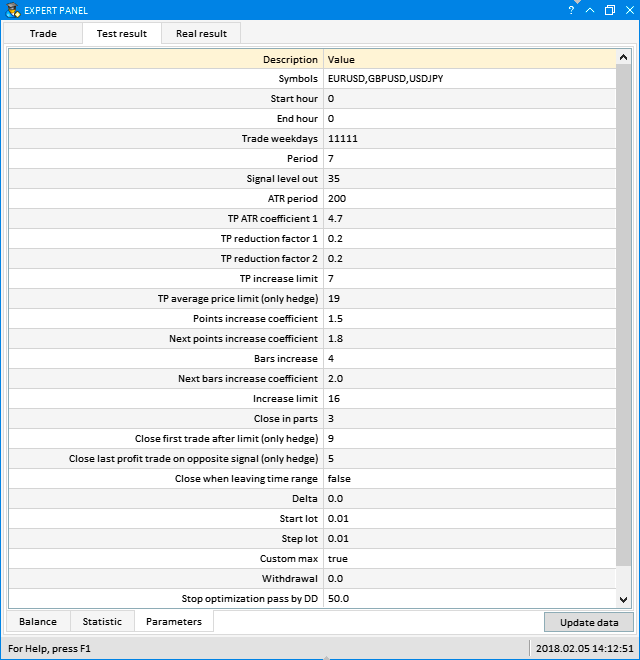
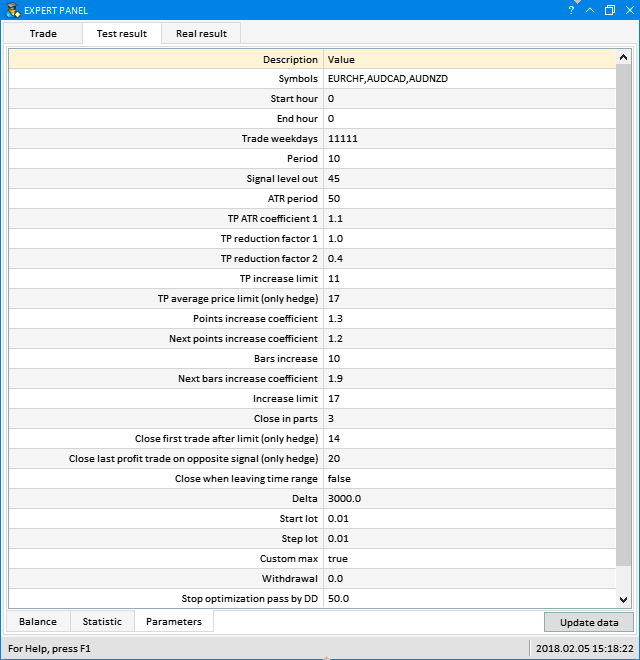
On Parameters tab you can see external parameters of the expert with which the test result was received:
Let’s consider several more test results and show ready set-files with expert settings for repeating the results on own computer. Take settings for tests from those optimizations which were done in previous sections on Alpari quotations. Normally, out of the optimization result list we picked up those results which showed up in the ultimate top by custom criteria (Custom max) or by Recovery factor. This is how you can find the best parameter combinations for EDGE. However, sometimes you want to view results not in the ultimate top of the list, but also by other factors.
The expert settings provided here are not a recommendation for the use. In order to obtain consistent parameter combinations, optimize the expert on all the data available with the broker with whom you opened a trading account. Detailed info is provided in the beginning of this article.
Symbol: EURUSD
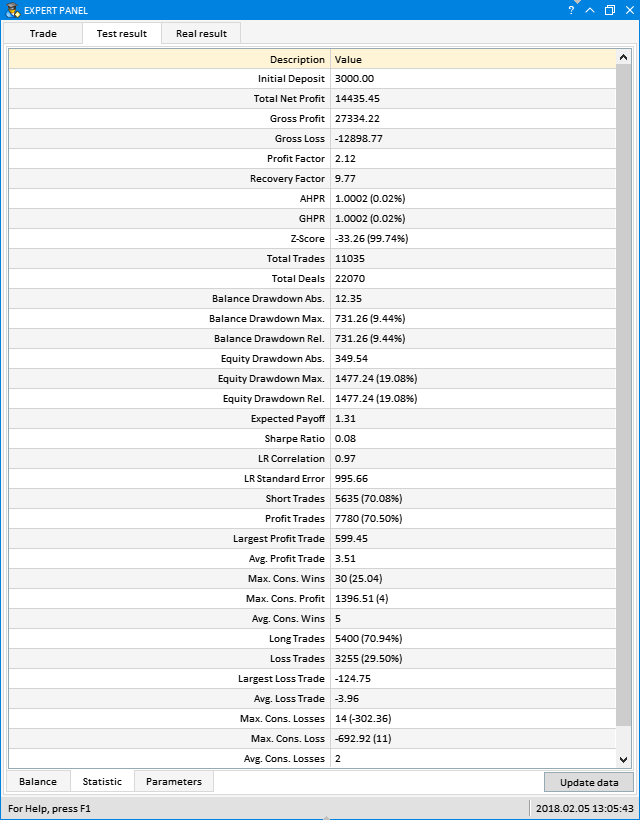
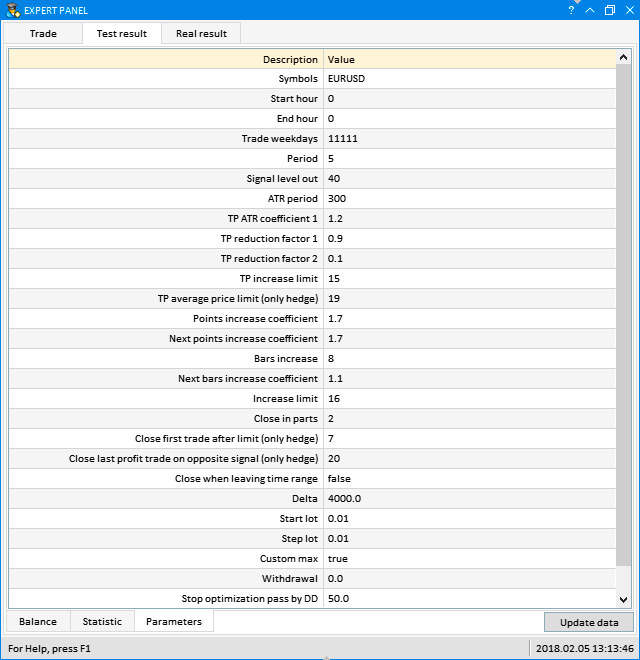
Set-file with expert parameters to repeat the result: eurusd_1y_001.set (see in the end of article)
Symbol: EURCHF

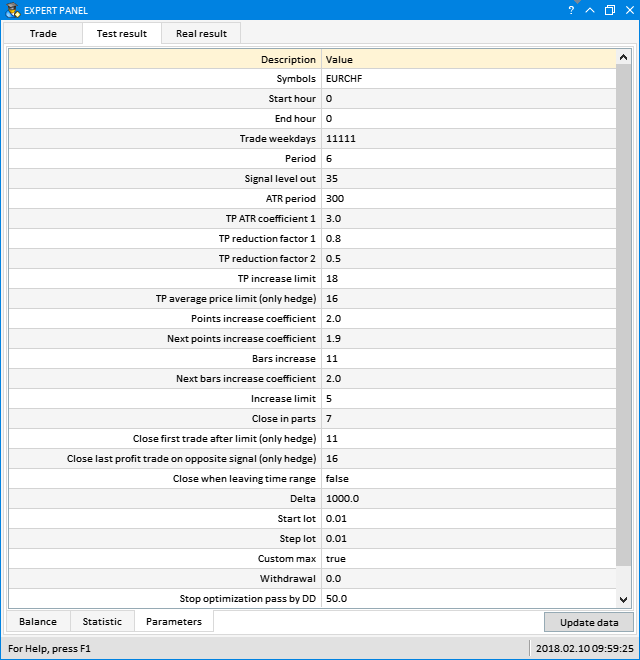
Set-file with expert parameters to repeat the result: eurchf_1y_001.set (see in the end of article)
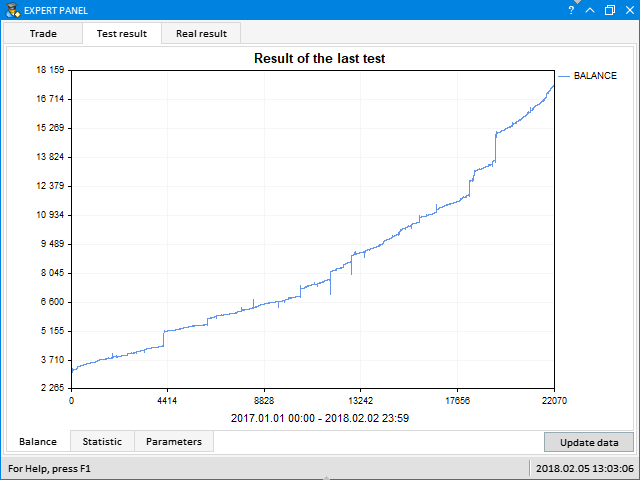
Symbols: EURUSD,GBPUSD,USDJPY

Symbols: EURCHF,AUDCAD,AUDNZD
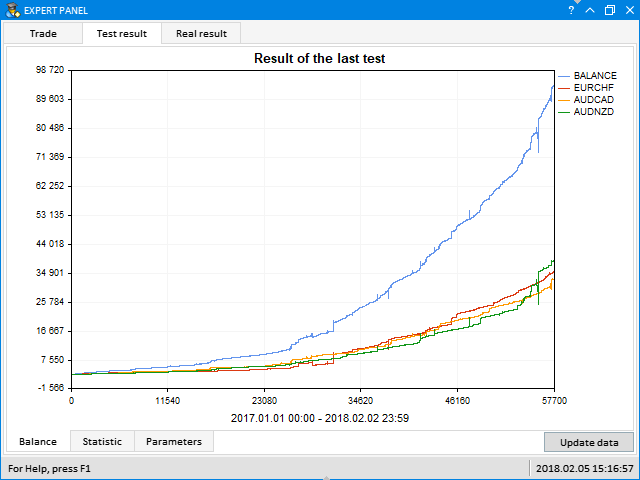

Set-file with expert parameters to repeat the result: s3_ck_1y_001.set (see in the end of article)
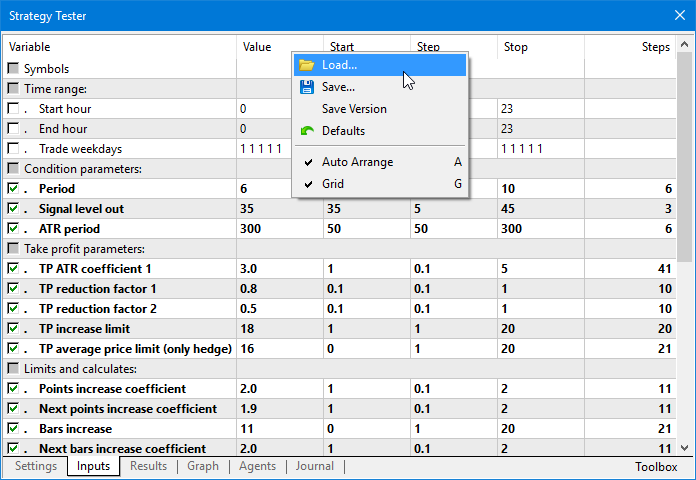
To use set-files with expert settings, put them to directory \MetaTrader 5\MQL5\Profiles\Tester. To download test settings in the tester, simply click the right mouse on parameter list and in the context menu select Load, as shown on the below screenshot:
As you can see, it is simple. Should you have any questions and suggestions, contact me and I will try to help.
- Download trading robot EDGE >>>
- Download trading utility Symbols spread >>>
- You can download archive with set-files in the end of article.


")
