
At the beginning of the new month and quarter, oil prices are declining. The latest monthly data showed that the volume of oil production in the US in July rose compared with June. According to the report of the Ministry of Energy on Friday, oil production in the US in July was 9.2 million barrels per day compared to 9.1 million barrels in June.
Investors continued to record profit after strong growth of quotations in the 3rd quarter.
Quotes of oil at NYMEX finished last quarter with a growth of 12.2% after a decline in the previous two quarters. Growth has become the strongest since the second quarter of 2016.
In September, WTI oil prices rose by 9.4% amid renewed hopes for the efforts of OPEC and other producers to reduce the world's surplus of oil. In addition, concerns about a recent Kurdish referendum appeared on the market, which could lead to a reduction in supply. Turkish President Recep Tayyip Erdogan threatened to block the export of Kurdish oil going through Turkey. If its threats are real, then soon the growth of oil prices may follow. Demand for oil in the US also increased, as the refinery recovered after Hurricane Harvey and regained activity.
On the other hand, there are fears that US producers will continue to increase production even faster to take advantage of the situation of rising prices.
According to data provided by the oil service company Baker Hughes Inc. on Friday, the number of active drilling rigs in the US rose for the first time in seven weeks. The rise in prices contributed to an increase in activity in the US oil-extracting sector.
Trading volumes in Asia on Monday were small, as the markets of China, South Korea, India and Hong Kong are closed for the weekend. Since the markets of China and South Korea will be closed all week, this could weaken activity in commodity markets and put pressure on oil prices.
On Tuesday (at 20:30 GMT), the American Petroleum Institute (API) will publish its weekly report on oil and petroleum products in the US. If the API report points to an increase in stocks, this will put additional pressure on oil prices. The official weekly report from the US Department of Energy on oil and petroleum products will be released on Wednesday (14:30 GMT).
*)An advanced fundamental analysis is available on the Tifia Forex Broker website at tifia.com/analytics
Support and resistance levels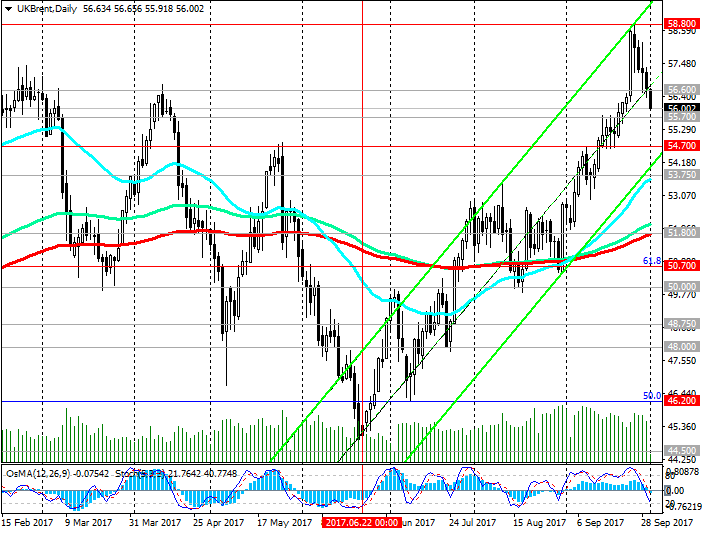
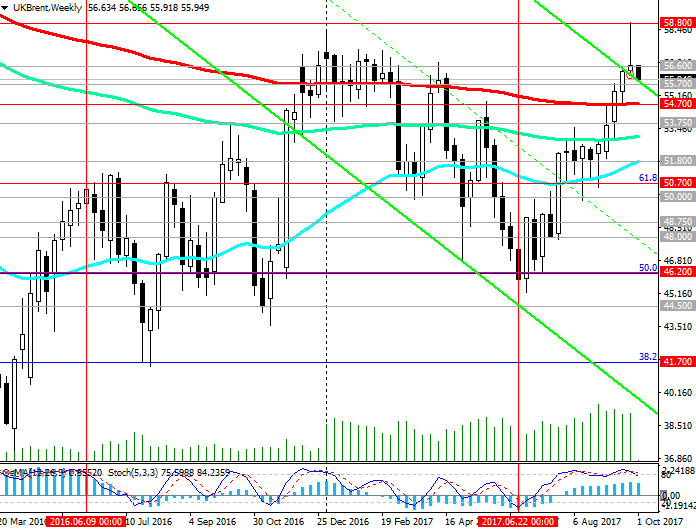
The price of Brent crude oil broke through the short-term support level of 56.60 (EMA200 on the 1-hour chart) and develops a downward trend to key support levels of 55.70 (EMA50 on the monthly chart), 54.70 (EMA200 on the weekly chart and the lower border of the rising channel on the daily chart).
At the end of last month, the price reached the level of 58.80 (highs of 2017). The last time at these levels the price was two years ago, in July 2015. Here, the upper limit of the ascending channel passes on the daily chart.
If the price falls below the level of 54.70, inside the downlink on the weekly chart, the lower limit of which passes near the level of 36.05 (the Fibonacci level of 23.6% of the correction to the decline from the level of 65.30 from June 2015 to the absolute minimums of 2016 near the 27.00 mark), increase risks of resuming the downtrend with targets at 51.80 (EMA200 on the daily chart), 50.70 (Fibonacci level 61.8%), 50.00 (lows in August), 48.75, 48.00, 46.20 (Fibonacci 50%), 44.50 (lows of the year), 41.70 (Fibonacci level 38.2%), 36.05 (the bottom line of the descending channel on the weekly chart ).
Technical indicators (OsMA and Stochastic) on the 4-hour, daily, weekly charts were deployed to short positions.
The resumption of growth will be associated with the return of prices in the zone above the level of 56.60. The next medium-term goal in the case of continued growth will be the resistance level of 62.00, near which the lines EMA144, EMA200 pass on the monthly chart.
Support levels: 55.70, 55.00, 54.70, 53.75, 51.80, 50.70, 50.00
Resistance levels: 56.60, 57.50, 58.80
Trading Scenarios
Sell in the market. Stop-Loss 56.70. Take-Profit 55.70, 55.00, 54.70, 53.75, 51.80, 50.70, 50.00
Buy Stop 56.70. Stop-Loss 55.90. Take-Profit 57.50, 58.45, 59.00, 60.00
*) For up-to-date and detailed analytics and news on the forex market visit Tifia Forex Broker website tifia.com


")