

According to official data released on Friday, the state of trade balance of New Zealand in March compared with the same period last year improved. In March, the trade surplus amounted to NZ $ 332 million against the negative balance in February (-50 million NZ dollars). The improvement of the indicator was ensured by the growth of exports from New Zealand, primarily dairy and meat products to China. According to Tehsin Islam, a representative of the statistics department of the New Zealand government, "China remains to be the main buyer of our export goods, it accounts for a quarter of total exports of dairy products in value terms. In March, exports to China exceeded $ 1 billion New Zealand dollars for the first time since March 2014 ". Not surprisingly, the New Zealand dollar is so responsive to macro statistics from China.
Also on Friday came strong data on business optimism and business activity in New Zealand (11.0 and 37.7%, respectively) for April. Indicators of company confidence indicate a strong growth in the country's economy, which is growing for the eighth consecutive year.
Nevertheless, the New Zealand currency reacted poorly to the positive data presented in the morning. In the Asia-Pacific region, tensions are growing as the situation on the Korean Peninsula worsens. So, in a recent interview with Reuters, US President Donald Trump warned about the likelihood of a "major conflict" with North Korea. It is likely that, down to a reduction in tensions in the region, New Zealand and Australian dollars will be under pressure.
Also, commodity currencies came under pressure after earlier this week the US decided to introduce import duties on wood from Canada. This news testifies to the strengthening of protectionism in world trade by the US, and this has a negative impact on commodity currencies.
Today we are waiting for data from the USA. At 12:30 (GMT) a report on GDP for the first quarter (preliminary release) is published. A strong report will positively affect the quotations of the US dollar, including in the pair NZD / USD. According to the forecast, the US annual GDP grew by 1.3% in the first quarter (against 2.1% in the previous quarter). Also at this time, published indices of expenditures on personal consumption, which are important indicators of inflation and the price index of GDP for the first quarter.
At 13:45 (GMT) Chicago PMI is published with an assessment of economic activity in the states of Illinois, Indiana and Michigan, and at 14:00 - consumer confidence index from the University of Michigan in April.
In view of the importance of the data, a surge in volatility in the foreign exchange market is expected at the time of publication. The dynamics of the US dollar and the major dollar pairs in this period of time will depend entirely on macro statistical indicators for the United States.
It is also necessary to take into account that today is the last business day of the week and month before the long weekend (on Monday - bank holiday in view of the celebration of Labor Day on May 1). It is possible to fix long positions of the dollar against commodity currencies, which will cause the growth of their quotations against the US dollar, including in the pair NZD / USD.
Support and resistance levels
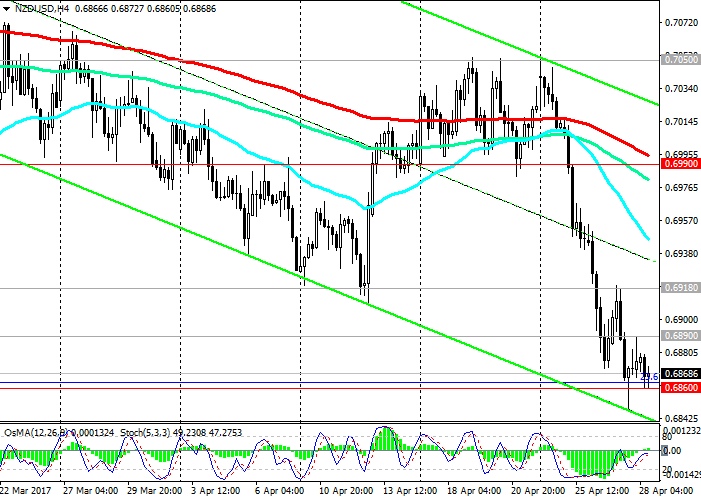
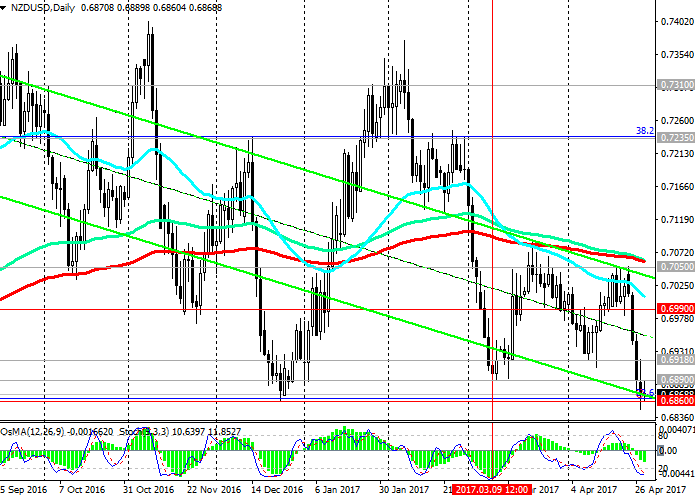
With the opening of today's trading day, the pair NZD / USD continued to decline, despite the "positive dose" from New Zealand. At the moment, the pair NZD / USD is trading at a strong support level of 0.6860 (Fibonacci level of 23.6% of the upward correction to the global wave of decline of the pair from the level of 0.8800, which began in July 2014). At this level are also the minimums of December 2016, and the lower border of the descending channel passes on the daily chart.
The strong negative impulse predominates, and the OsMA and Stochastic indicators on the daily and weekly charts recommend short positions.
From this level it is possible, however, as a retreat, and its breakdown with the acceleration of the descending dynamics.
In case of rebound from the level of 0.6860, the pair NZD / USD may return to the depth of the descending channel with the prospect of growth to the levels of 0.6990 (EMA200 on the 4-hour chart), 0.7050 (EMA200 on the daily chart). Between these levels, just the upper limit of the descending channel passes on the daily chart. The beginning of the implementation of this scenario will be connected with the breakdown of the nearest resistance levels 0.6890, 0.6918.
In case of breakdown of the support level of 0.6860, the global downtrend of the NZD / USD pair, which began in July 2014, will resume. The minima of the wave of this trend are close to the level of 0.6260, which were reached in September 2015, and from which the current upward correction began. The level of 0.6860 is the key level (the Fibonacci level is 23.6%) in this correction.
An alternative scenario for the medium-term growth of the NZD / USD pair will be possible only after the pair is consolidated above the key resistance level 0.7050 (EMA200 on the daily chart).
Below this level, the negative dynamics of the pair NZD / USD prevails.
Support levels: 0.6860, 0.6800, 0.6680
Resistance levels: 0.6890, 0.6918, 0.6990, 0.7050
Trading Scenarios
Sell Stop 0.6850. Stop-Loss 0.6910. Take-Profit 0.6800, 0.6700, 0.6680
Buy Stop 0.6910. Stop-Loss 0.6850. Take-Profit 0.6920, 0.6990, 0.7050
*) Actual and detailed analytics can be found on the Tifia website at tifia.com/analytics


")

")