

W1 price was on breakout with the bullish reversal: the price broke Ichimoku cloud to above to be reversed from the primary bearish to the primary bullish market condition. For now, the price is located near and above Senkou Span line which is the virtual border between the primary bearish and the primary bullish trend on the chart. Descending triangle pattern was formed by the price to be crossed to below for the ranging condition to be started.
Chinkou Span line
is located above the price indicating the bullish market condition, Tenkan-sen line is above Kijun-sen line
for the bullish trend to be continuing, and
Absolute Strength indicator is estimating the trend to be ranging as
well in the future.
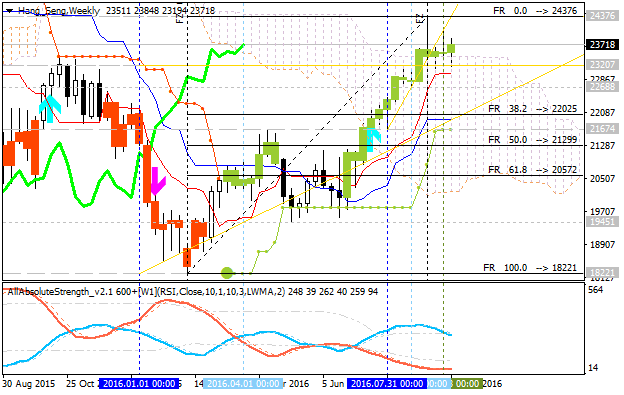
- If the price breaks 24,376
resistance level on close weekly bar to above so the bullish trend will be continuing.
- If weekly price breaks 23,207 support level on close bar to below so the reversal of the weekly price movement from the primary bullish to the ranging bearish market condition will be started.
- If weekly price breaks 20,572 support level on close bar to below so the price will be fully reversed to the primary bearish condition.
- If not so the price will be on ranging within the levels.
| Resistance | Support |
|---|---|
| 24,376 | 23,207 |
| N/A | 20,572 |
W1 - bullish


 & AMD Framework")
")