AUD/USD: The Decline is Likely to Continue. Technical Analysis as of 30.05.2016.
AUD/USD: The Decline is Likely to Continue. Technical Analysis as of 30.05.2016.
Overview and dynamics
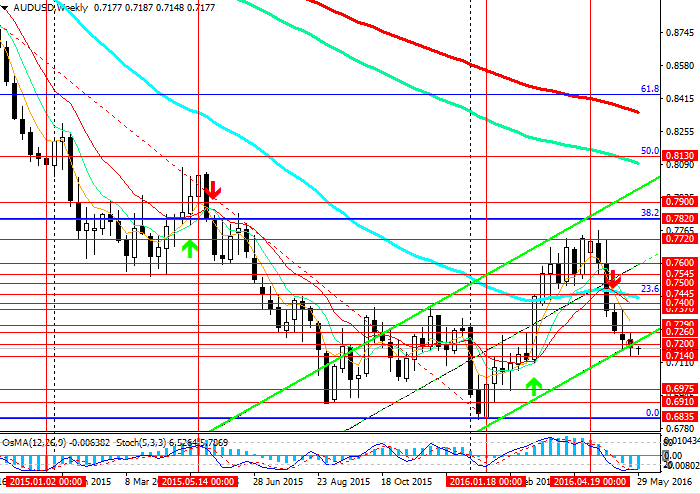
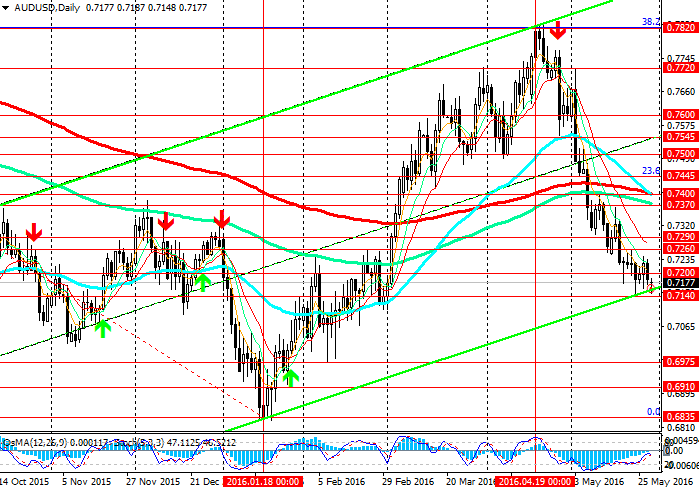
On the weekly chart AUD/USD pair broke through the bottom line of the rising channel (level 0.7200), at the same time remaining below important levels 0.7445 (23.6% Fibonacci level) and 0.7400 (EMA200 on the daily chart). The downward dynamic of AUD/USD pair remains.
Our opinion
On the weekly and 4-hour charts OsMA and Stochastic recommend short positions, on the monthly chart they reverse to short positions as well. Even despite the fact that on the daily chart the indicators started giving signals for long positions, under the pressure from fundamental factors the correction of AUD/USD pair may be negligible.
The decline of AUD/USD pair is likely to continue. As long as the pair is below the level of 0.7400, the downward trend will remain.
Only upon the return above the level of 0.7445 one might consider medium-term long positions.
Support levels: 0.7140, 0.7100, 0.7000.
Resistance levels: 0.7200, 0.7260, 0.7290, 0.7355, 0.7390, 0.7415, 0.7445
Trading recommendations
Sell according to the market. Stop-Loss 0.7210. Take-Profit 0.7140, 0.7100, 0.7000
Buy Stop 0.7310. Stop-Loss 0.7260. Take-Profit 0.7415, 0.7445, 0.7500, 0.7545, 0.7600

The price broke the lower limit of the channel

Below levels 0.7445, 0.7400


