Gold Technical Analysis for March 22, 2016
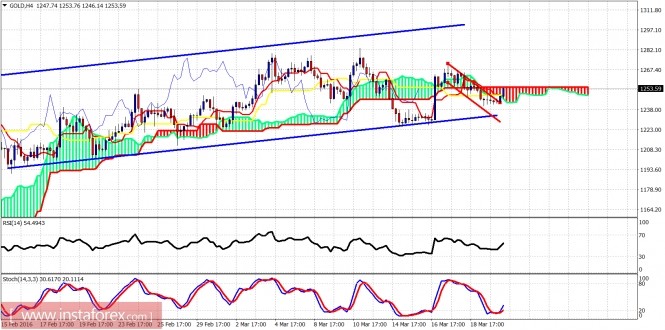
Gold price has broken above the short-term bearish channel. Price remains in a sideways channel and could now be starting the final move higher towards $1,300.

Blue lines - bullish channel
Red lines - bearish short-term channel
Stochastic oscillator is oversold and it is turning higher at the 4 hour chart. Price is reversing above the bearish channel. This is a bullish reversal signal for the short-term. Support at $1,240 is critical now. As long as we are above it, there are chances of making a final new higher high towards $1,300.

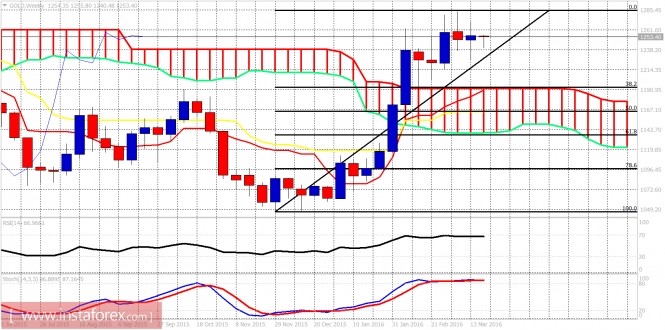
The weekly chart shows us that oscillators are overbought and that we are either at the final stages of the rise from $1,045 or we have already completed the 1st move up and we should expect a pull back towards at least the 38% retracement. The short-term trend has turned bullish again but overall we should expect a larger pull back towards $1,170-$1,100.
The material has been provided by InstaForex Company - www.instaforex.com


