Daily Analysis of USDX for March 17, 2016
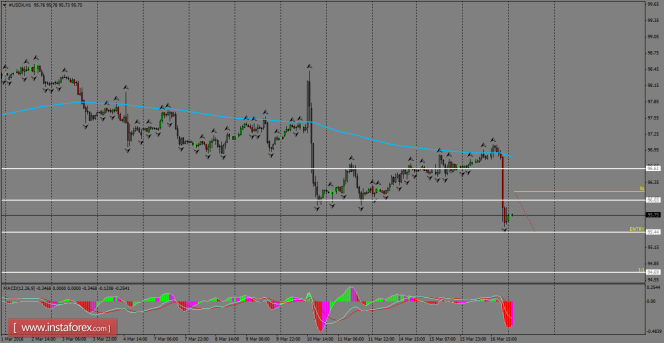
On the H1 chart, USDX is forming a lower low pattern below the resistance level of 96.03, in an effort to do a bearish continuation towards new lows. The current structure is still calling for more declines, because the Index reacted to the FOMC minutes released during yesterday's session. The 200 SMA is pointing to the bearish side and the MACD indicator remains negative.

H1 chart's resistance levels: 96.03 / 96.61
H1 chart's support levels: 95.44 / 94.69
Trading recommendations for today: Based on the H1 chart, place sell (short) orders only if the USD Index breaks with a bearish candlestick; the support level is at 95.44, take profit is at 94.69, and stop loss is at 96.19.
The material has been provided by InstaForex Company - www.instaforex.com


