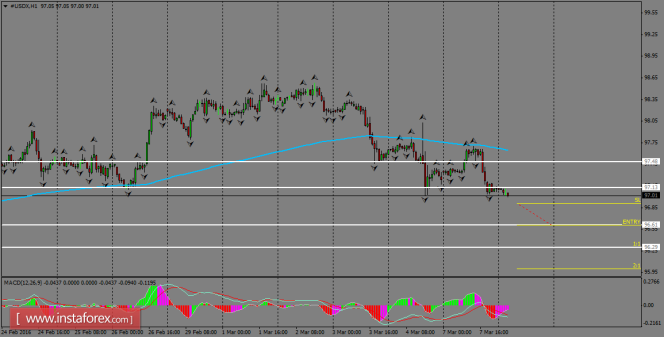
Daily Analysis of USDX for March 08, 2016
The USDX is trying to break the bottom formed around the zone of 97.13 and we can expect another decline towards the support level of 96.61. However, the rebounds have not been discarded yet, as the index can again correct the decline towards the 200 SMA in the H1 chart, but our short-term targets are placed in the downside.

H1 chart's resistance levels: 97.13 / 97.48
H1 chart's support levels: 96.61 / 96.29
Trading recommendations for today: Based on the H1 chart, place sell (short) orders only if the USDX breaks with a bearish candlestick; the support level is seen at 96.61, take profit is at 96.29, and stop loss is at 96.91.
The material has been provided by InstaForex Company - www.instaforex.com


