
Introduction to COSMOS4UAd MACD Indicator.
The MACD is one of the most highly acclaimed indicators, utilized in financial markets’ technical analysis. It combines trend-following moving averages (fast and slow), with an oscillator that accurately calculates convergence or divergence between the aforementioned moving averages (fast and slow).
A twofold advantage is the outcome of this technical analysis strategy; the primary one is the fact that the AdMACD can identify bullish and bearish trends, which gives traders the ability to quickly and easily identify and highlight the short-term trend direction. The second advantage is the fact that the oscillator can detect and send robust signals with regard to the momentum.
By definition, the MACD depends on three time parameters, namely the time constants of the three EMAs (Exponential Moving Averages). The notation “MACD(f,s,g)” denotes the indicator where the MACD series is the difference of EMAs with characteristic times f ("fast" -short period exponential moving average) , and s, (a "slow" longer period EMA) The average series is an EMA of the MACD series with characteristic time g. .These parameters are usually measured in days. The most commonly used values are 12, 26, and 9 days, that is, MACD(12,26,9). As the working week used to be 6-days, the period settings of (12, 26, 9) represent 2 weeks, 1 month and one and a half week.
COSMOS4U has launched the AdMACD (http://www.cosmos4u.com/index.php/cosmos4u-metatrader-indicators/cosmos4u-admacd-indicator) technical indicator, which can efficiently accommodate a variety of values with regard to all three parameters(f,s,g) .
COSMOS4U research department, publishes optimised parameters for sought-after securities and foreign exchange rates on our official website, at the following address: http://www.cosmos4u.com/index.php/cosmos4u-macd-indicator-and-expert-advisor-optimized-parameters-for-h1-time-interval
How to Trade Using AdMACD
As we have already mentioned, the MACD oscillator, identifies and calculates the difference between slow(b) and fast (a) moving averages. This difference is defined as MACD, and it indicates a new trend, whether it’s bullish or bearish.
The formula for MACD is as follows: MACD= EMA( f)- EMA(s).
The MACD line (the solid line), results from plotting various MACD values on a chart.
The MACD line is calculated by subtracting the 26-day exponential moving average (EMA) from the 12-day EMA. A nine-day EMA of the MACD, called the "signal line", is then plotted on top of the MACD, functioning as a trigger for buy and sell signals.
The following hourly chart of USDJPY highlights the Ad MACD indicator as well as the MACD line and the signal line.
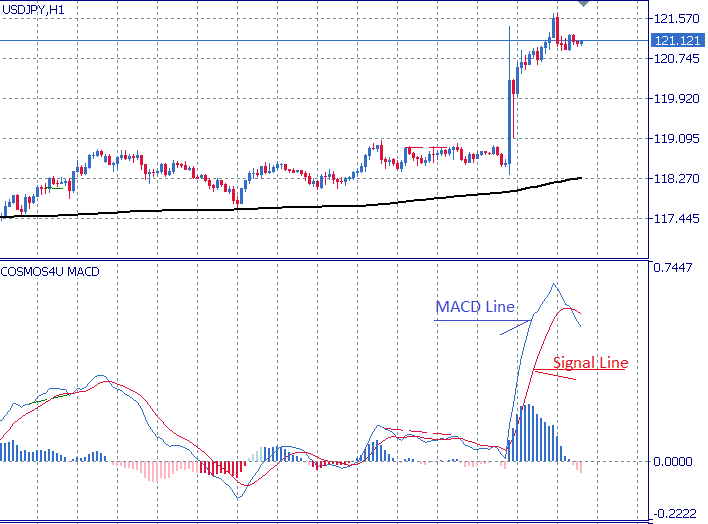
COSMOS4U Ad MACD indicator denotes consecutive MACD line and signal line crossovers.
These crossovers trigger buy and sell signals. The basic bullish signal (buy sign) occurs when the MACD line (the solid line) crosses above the signal line (the dotted line), and the basic bearish signal (sell sign) is generated when the MACD crosses below the signal line. Waning upward momentum can sometimes foreshadow a trend reversal or sizable decline.
That is the standard use of the oscillator in trading.
The Ad MACD indicator is not concerned with the above-mentioned interpretation of the oscillator.
The research team’s highlights the divergence resulting from the oscillation of the MACD above and below the zero line and the MACD and signal line crossover. Oscillation below zero level generates an "oversold" signal, while oscillation above the zero line generates "overbought" signals.
Consequently, when the MACD line crosses above the signal line, a bullish crossover occurs.
When downside momentum increases, and the MACD line breaks below the signal line, a strong bearish signal is generated.
The following hourly EURUSD chart highlights the zero line as well as overbought and oversold territories.
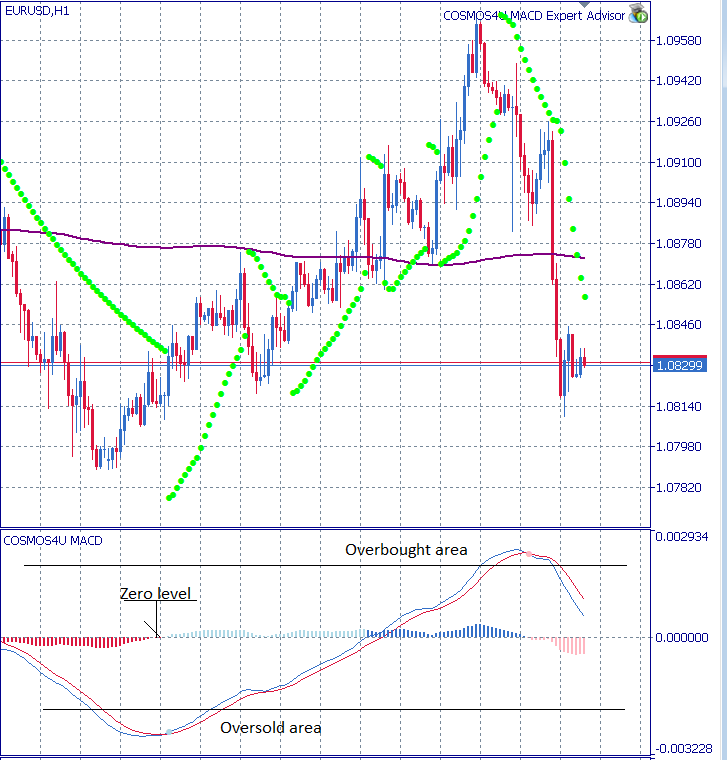
On balance, the use of the Ad MACD indicator abides by the following rules:
Buy signal: It is generated when the MACD line breaks above the signal line. The signal is strong when the crossover occurs on the oversold level.
Sell signal: It is triggered whenever negative MACD values occur on the overbought level.
The following graphs were contrived to showcase the use of COSMOS4UAdMACD and of COSMOS4U Volume indicators. They accentuate and exemplify successfully generated buy and sell signals.
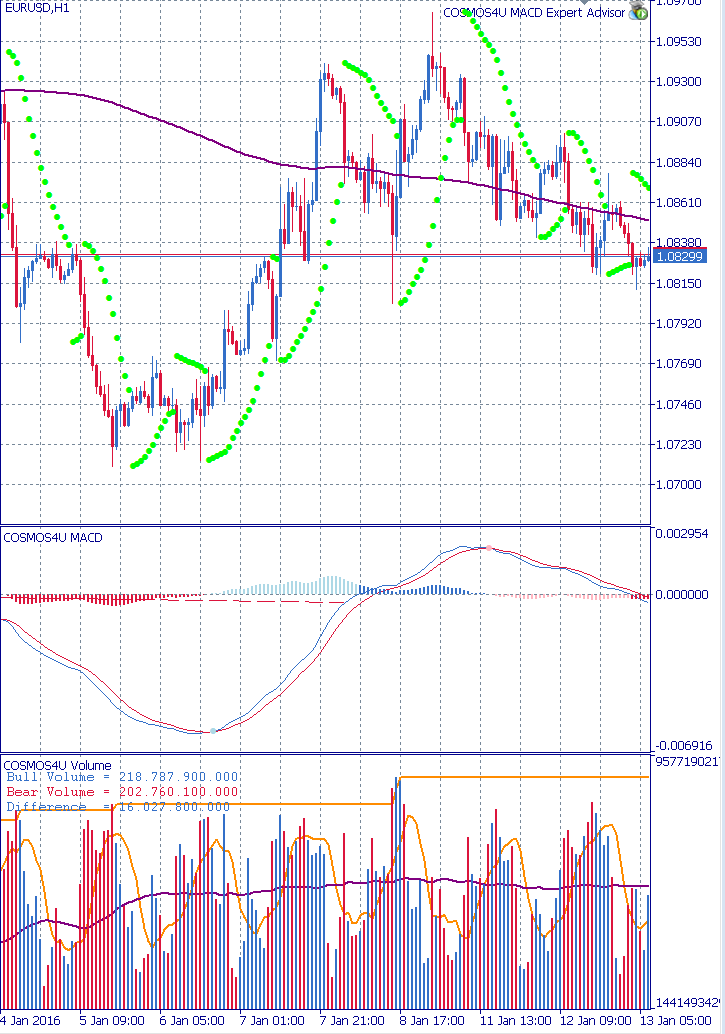
The above EURUSD hourly chart denotes the buy signal generated on 6 January 2016 on the oversold level, and the sell signal triggered on 11 Jan 2016 above the zero line. In the event of a EURUSD uptrend, increasing volumes determine momentum. AdMACD parameters for the EURUSD were 49,126,7.
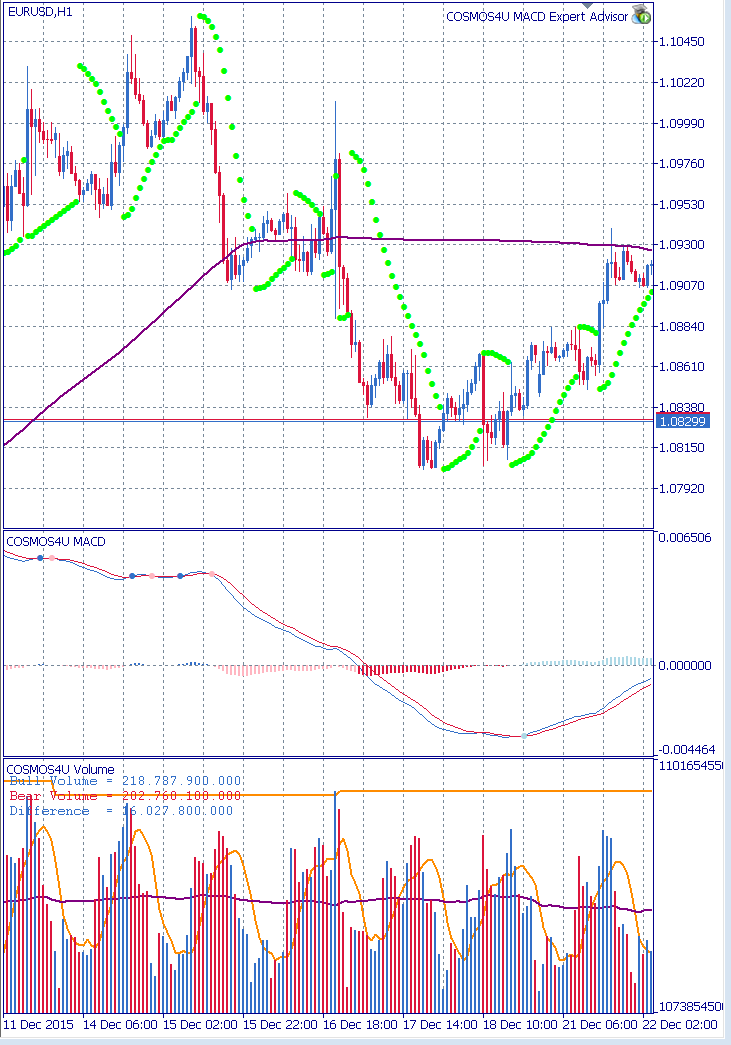
The above EURUSD chart demonstrates the sell signal triggered on 15 Dec 2015 on the overbought level and a sell signal generated on 18 Dec 2015 below the zero line. In the event of a EURUSD uptrend, increasing volumes determine momentum.
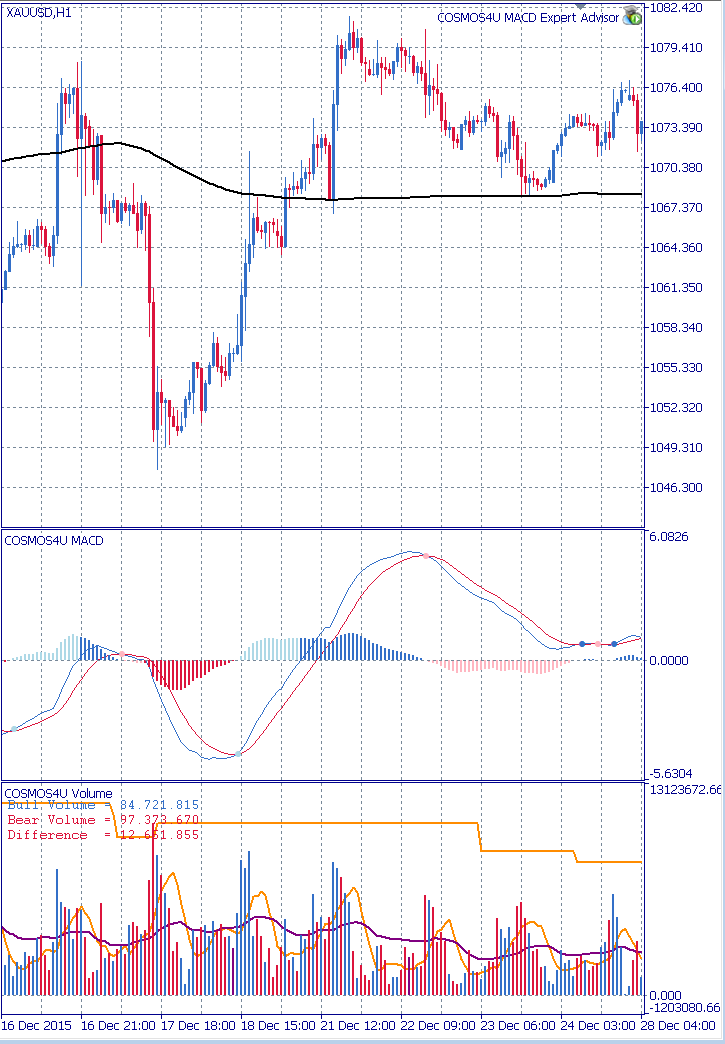
The above hourly XAUUSD chart highlights a buy signal triggered on 18 Dec 2015, and a sell signal generated on 22 Dec 2015. In The event of a XAUUSD uptrend, waning volumes foreshadow potential trend reversal. The AD MACD parameters for XAUUSD were 31,81,9.
Divergences
Divergences occur whenever the direction of the COSMOS4UAdMACD indicator is separated from security prices. Bearish divergence occurs when the indicator is suggesting that a price should be going down but the price of the security is continuing to maintain its current uptrend.
We then observe a divergence between security prices and the MACD trend. The imbedded divergence signals that are hidden inside of MACD, can be used to spot potential market reversals in the Forex market.
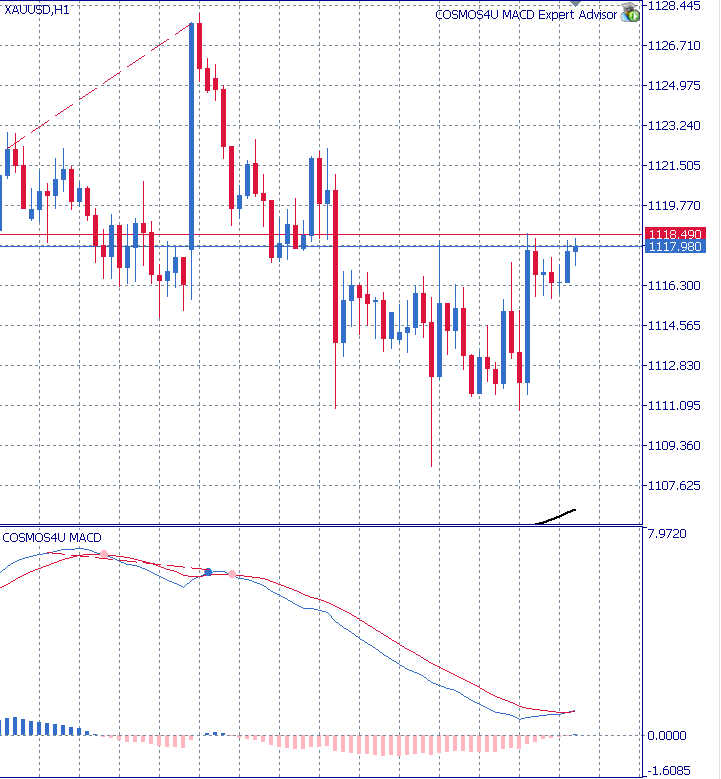
The above histogram displays a successful divergence signal generated on 27-28 Jan 2016, by comparing hourly XAUUSD prices with declining MACD values.
As soon as the divergence occurred, the XAUUSD exhibited a downtrend and confirmed the short position signal generated by the COSMOS4U AdMACD.
In conclusion, COSMOS4UAdMACD indicator, making the most of the custom settings recommended by COSMOS4U research department, constitutes a valuable technical analysis tool , providing sound trading advice.
The use of the indicator relies on the efficiency of the applied parameters.
Parameters for the AdMACD indicator can be found at the following addrees:
For Metatrader COSMOS4U products and updates, click
https://www.mql5.com/en/users/cosmos4ucom/seller#products


")

