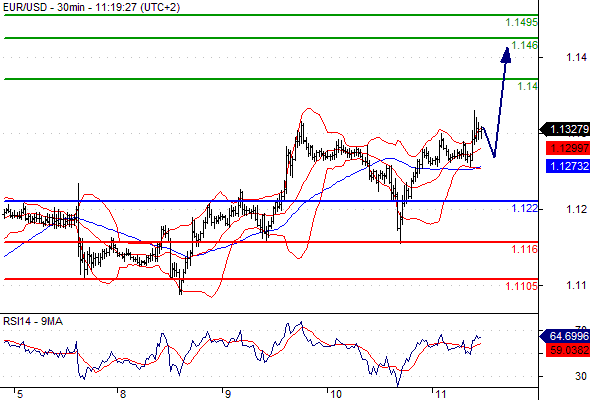
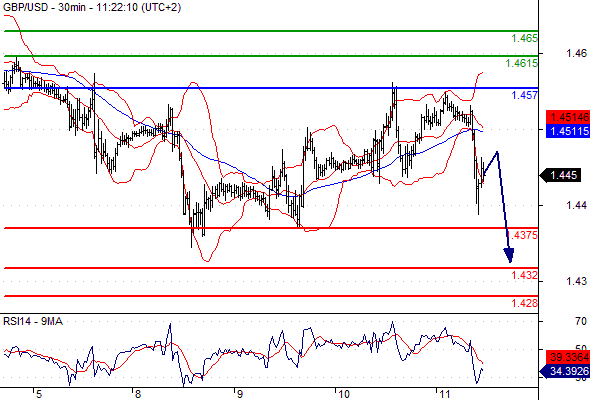
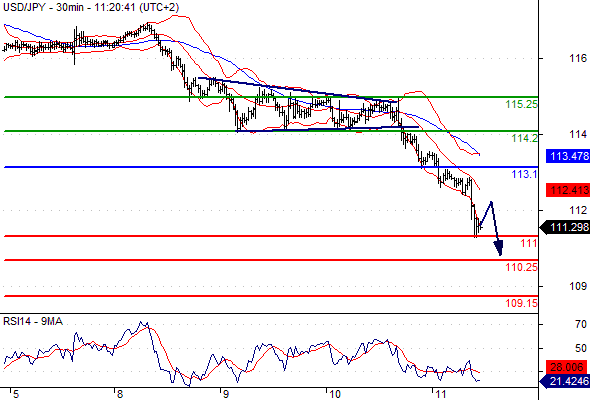
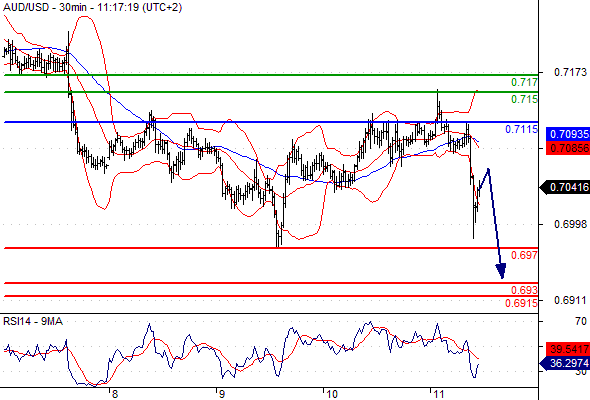
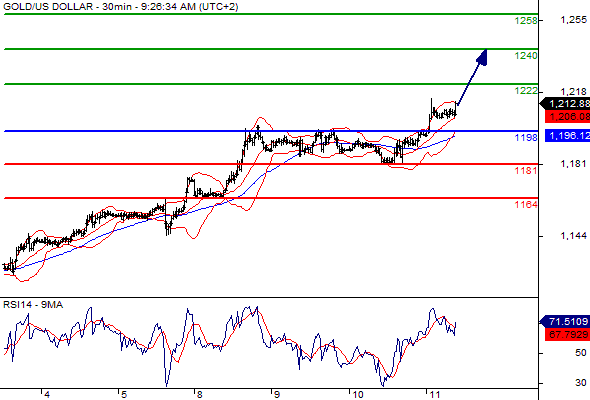
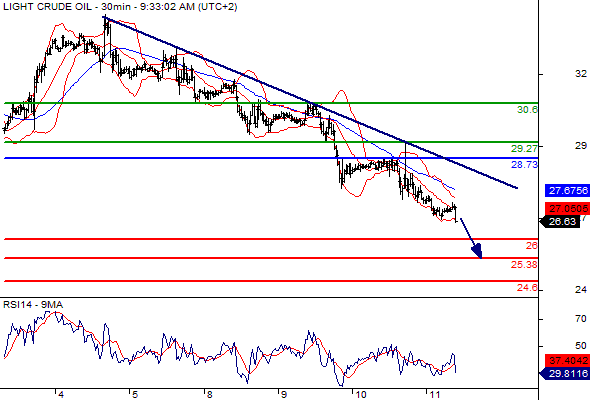
Charts All Blogs / My Trading / Charts Charts Pre US Open, Daily Technical Analysis Thursday, February 11, 2016 11 February 2016, 12:19 Mohammed Abdulwadud Soubra 0 171 Pre US Open, Daily Technical Analysis Thursday, February 11, 2016 Please note that due to market volatility, some of the below sight prices may have already been reached and scenarios played out. EUR/USD Intraday: the upside prevails. PrevNext Pivot: 1.1220Most Likely Scenario: long positions above 1.1220 with targets @ 1.1400 & 1.1460 in extension.Alternative scenario: below 1.1220 look for further downside with 1.1160 & 1.1105 as targets.Comment: the RSI is well directed. GBP/USD Intraday: under pressure. PrevNext Pivot: 1.4570Most Likely Scenario: short positions below 1.4570 with targets @ 1.4375 & 1.4320 in extension.Alternative scenario: above 1.4570 look for further upside with 1.4615 & 1.4650 as targets.Comment: the RSI is badly directed. USD/JPY Intraday: the downside prevails. PrevNext Pivot: 113.10Most Likely Scenario: short positions below 113.10 with targets @ 111.00 & 110.25 in extension.Alternative scenario: above 113.10 look for further upside with 114.20 & 115.25 as targets.Comment: the RSI is bearish and calls for further downside. AUD/USD Intraday: under pressure. PrevNext Pivot: 0.7115Most Likely Scenario: short positions below 0.7115 with targets @ 0.6970 & 0.6930 in extension.Alternative scenario: above 0.7115 look for further upside with 0.7150 & 0.7170 as targets.Comment: the RSI is badly directed. Gold spot Intraday: further advance. PrevNext Pivot: 1198.00Most Likely Scenario: long positions above 1198.00 with targets @ 1222.00 & 1240.00 in extension.Alternative scenario: below 1198.00 look for further downside with 1181.00 & 1164.00 as targets.Comment: the RSI is well directed. Crude Oil (WTI) (H6) Intraday: under pressure. PrevTop Pivot: 28.73Most Likely Scenario: short positions below 28.73 with targets @ 26.00 & 25.38 in extension.Alternative scenario: above 28.73 look for further upside with 29.27 & 30.60 as targets.Comment: the RSI has broken down its 30 level. To add comments, please log in or register Custom Indicators vs Built-in Indicators: Which Is Better for Forex Trading? Trading Strategies 24 0 If You're Not Buying, Here's What's Free Trading Strategies 22 0 1 How prop firms count daily loss and max loss - and the open-stop trap that fails accounts My Trading 30 0 Wick Map: which hours leave long wicks on your chart? Statistics 30 0 Why backtesting your signals matters before you subscribe Trading Strategies 32 0 1 minute OHLC versus real ticks: comparing September 2026 test totals Trading Strategies 58 0 How We Locked $856.20 on Gold on October 26: The Step-by-Step Trailing Sequence Trading Strategies 49 1 2 Swing Size Ruler: is this swing already long? Statistics 42 0 How Much Money Do You Need to Trade Gold with an EA? My Trading 34 0 225 Forex and Crypto Forecast for 26-30 October 2026 167 −67,269 USD — USD/JPY Falls Despite a Firm Dollar: Policy Meetings Will Shape the Next Move from the 156s 232 My AI Gold vs Smart Golden Portfolio— Live Performance Update (October 24, 2026) forex technical analysis eurusd EUR/USD gbpusd gold usdjpy GBP/USD usd/jpy usd Trading AUD/USD usd/chf S&P 500 forecast usd/cad Fed bitcoin Fxwirepro dax fundamental analysis VistaBrokers Gold spot ($) Silver spot ($) Crude Oil (WTI) USD/TRY audusd EUR forex news ECB